Grundlæggende statistik
| Institutionelle aktier (lange) | 40.143.603 - 115,56% (ex 13D/G) - change of -9,26MM shares -18,74% MRQ |
| Institutionel værdi (lang) | $ 627.804 USD ($1000) |
Institutionelt ejerskab og aktionærer
Dave & Buster's Entertainment, Inc. (US:PLAY) har 194 institutionelle ejere og aktionærer, der har indsendt 13D/G- eller 13F-formularer til Securities Exchange Commission (SEC). Disse institutioner har i alt 40,143,603 aktier. Største aktionærer omfatter Hill Path Capital LP, BlackRock, Inc., Vanguard Group Inc, Nomura Holdings Inc, Eminence Capital, Lp, Healthcare Of Ontario Pension Plan Trust Fund, Goldman Sachs Group Inc, Morgan Stanley, State Street Corp, and Arrowstreet Capital, Limited Partnership .
Dave & Buster's Entertainment, Inc. (NasdaqGS:PLAY) institutionel ejerskabsstruktur viser aktuelle positioner i virksomheden efter institutioner og fonde, samt seneste ændringer i positionsstørrelse. Større aktionærer kan omfatte individuelle investorer, investeringsforeninger, hedgefonde eller institutioner. Skema 13D angiver, at investoren besidder (eller besidder) mere end 5 % af virksomheden og har til hensigt (eller har til hensigt at) aktivt at forfølge en ændring i forretningsstrategi. Skema 13G indikerer en passiv investering på over 5%.
The share price as of April 23, 2026 is 12,70 / share. Previously, on April 24, 2025, the share price was 19,36 / share. This represents a decline of 34,40% over that period.

Fondens stemningsscore
Fund Sentiment Score (fka Ownership Accumulation Score) finder de aktier, der bliver mest købt af fonde. Det er resultatet af en sofistikeret, multi-faktor kvantitativ model, der identificerer virksomheder med de højeste niveauer af institutionel akkumulering. Scoringsmodellen bruger en kombination af den samlede stigning i oplyste ejere, ændringerne i porteføljeallokeringer i disse ejere og andre målinger. Tallet går fra 0 til 100, hvor højere tal indikerer et højere niveau af akkumulering for sine jævnaldrende, og 50 er gennemsnittet.
Opdateringsfrekvens: Dagligt
Se Ownership Explorer, som giver en liste over højest rangerende virksomheder.
AI+ Ask Fintel’s AI assistant about Dave & Buster's Entertainment, Inc..
Select a question to share a public post with an AI-crafted answer.
Thinking of good questions…
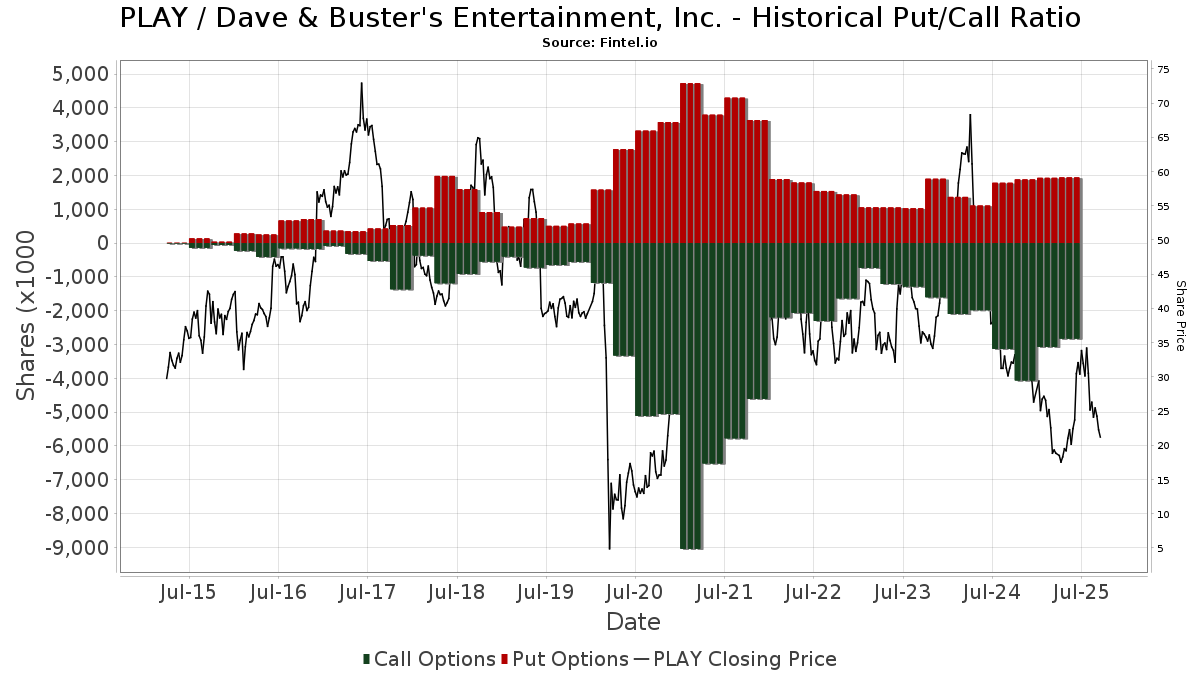
Institutionel Put/Call-forhold
Ud over at indberette standardaktie- og gældsudstedelser skal institutter med mere end 100 mill. aktiver under forvaltning også oplyse deres put- og call-optionsbeholdninger. Da salgsoptioner generelt indikerer negativ stemning, og købsoptioner indikerer positiv stemning, kan vi få en fornemmelse af den overordnede institutionelle stemning ved at plotte forholdet mellem put og kald. Diagrammet til højre viser det historiske put/call-forhold for dette instrument.
Brug af Put/Call Ratio som en indikator for investorernes stemning overvinder en af de vigtigste mangler ved at bruge totalt institutionelt ejerskab, som er, at en betydelig mængde af aktiver under forvaltning investeres passivt for at spore indekser. Passivt forvaltede fonde køber typisk ikke optioner, så indikatoren for put/call-forholdet følger mere nøje følelsen af aktivt forvaltede fonde.
13D/G-arkivering
Vi præsenterer 13D/G ansøgninger separat fra 13F ansøgninger på grund af den forskellige behandling af SEC. 13D/G-ansøgninger kan indgives af grupper af investorer (med én ledende), hvorimod 13F-ansøgninger ikke kan. Dette resulterer i situationer, hvor en investor kan indsende en 13D/G, der rapporterer én værdi for de samlede aktier (der repræsenterer alle de aktier, der ejes af investorgruppen), men derefter indsender en 13F, der rapporterer en anden værdi for de samlede aktier (der udelukkende repræsenterer deres egne) ejendomsret). Det betyder, at aktieejerskab af 13D/G-arkiver og 13F-arkiveringer ofte ikke er direkte sammenlignelige, så vi præsenterer dem separat.
Bemærk: Fra den 16. maj 2021 viser vi ikke længere ejere, der ikke har indsendt en 13D/G inden for det seneste år. Tidligere viste vi den fulde historie af 13D/G-arkiver. Generelt skal enheder, der er forpligtet til at indgive 13D/G-ansøgninger, indgive mindst årligt, før de indsender en afsluttende ansøgning. Dog forlader fonde nogle gange positioner uden at indsende en afsluttende ansøgning (dvs. de afvikler), så visning af den fulde historie resulterede nogle gange i forvirring om det nuværende ejerskab. For at undgå forvirring viser vi nu kun 'aktuelle' ejere - det vil sige - ejere, der har anmeldt inden for det seneste år.
Upgrade to unlock premium data.
| Fil dato | Form | Investor | Forrige Aktier |
Seneste Aktier |
Δ Aktier (Procent) |
Ejendomsret (Procent) |
Δ Ejerskab (Procent) |
|
|---|---|---|---|---|---|---|---|---|
| 2026-04-07 | BlackRock, Inc. | 4,674,242 | 2,084,177 | -55.41 | 6.00 | -50.41 | ||
| 2026-03-26 | VANGUARD GROUP INC | 2,453,674 | 0 | -100.00 | 0.00 | -100.00 | ||
| 2025-05-15 | EMINENCE CAPITAL, LP | 3,710,359 | 2,905,454 | -21.69 | 7.50 | -20.21 | ||
| 2025-04-30 | Patient Capital Management, LLC | 2,201,507 | 5.72 | |||||
| 2025-04-09 | Hill Path Capital Partners LP | 7,119,255 | 7,119,255 | 0.00 | 20.60 | 11.35 |
13F og NPORT arkivering
Detaljer om 13F-arkivering er gratis. Detaljer om NP-ansøgninger kræver et premium-medlemskab. Grønne rækker angiver nye positioner. Røde rækker angiver lukkede positioner. Klik på linket ikon for at se den fulde transaktionshistorik.
Opgrader
for at låse premium-data op og eksportere til Excel ![]() .
.
| Fil dato | Kilde | Investor | Type | Gennemsnitlig pris (Øst) |
Aktier | Δ Aktier (%) |
Rapporteret Værdi ($1000) |
Δ Værdi (%) |
Port Alloc (%) |
|
|---|---|---|---|---|---|---|---|---|---|---|
| 2026-02-17 | 13F | Fund 1 Investments, LLC | 453.909 | 5,81 | 7.358 | -5,56 | ||||
| 2026-02-11 | 13F | Group One Trading, L.p. | Put | 44.500 | -5,72 | 721 | -15,87 | |||
| 2026-02-03 | 13F | NewEdge Wealth, LLC | 0 | -100,00 | 0 | -100,00 | ||||
| 2026-02-13 | 13F | Transamerica Financial Advisors, Inc. | 5 | 0 | ||||||
| 2026-02-11 | 13F | Group One Trading, L.p. | Call | 146.000 | -5,62 | 2.367 | -15,77 | |||
| 2026-02-17 | 13F | Sender Co & Partners, Inc. | Call | 0 | -100,00 | 0 | ||||
| 2026-02-11 | 13F | Fox Run Management, L.l.c. | 0 | -100,00 | 0 | -100,00 | ||||
| 2026-02-13 | 13F | MAI Capital Management | 165 | 0,00 | 3 | 0,00 | ||||
| 2026-01-30 | 13F | Torren Management, LLC | 471 | 8 | ||||||
| 2026-02-11 | 13F | Simplex Trading, Llc | Put | 49.000 | 8,65 | 794 | ||||
| 2026-02-19 | 13F | Invesco Ltd. | 357.133 | 31,21 | 5.789 | 17,14 | ||||
| 2026-02-11 | 13F | Simplex Trading, Llc | 1.161 | 19 | ||||||
| 2026-02-11 | 13F | Simplex Trading, Llc | Call | 79.800 | -28,37 | 1.294 | 64.550,00 | |||
| 2026-01-29 | 13F | Vanguard Group Inc | 2.453.674 | -16,03 | 39.774 | -25,05 | ||||
| 2026-02-10 | 13F | Bnp Paribas Arbitrage, Sa | 25.004 | 106,46 | 405 | 84,93 | ||||
| 2026-02-13 | 13F | Morgan Stanley | 1.451.586 | 3,16 | 23.530 | -7,92 | ||||
| 2026-02-02 | 13F | GDS Wealth Management | 15.202 | 0,00 | 246 | -10,87 | ||||
| 2026-02-05 | 13F | Bessemer Group Inc | 0 | -100,00 | 0 | |||||
| 2026-02-13 | 13F | American Century Companies Inc | 77.827 | -29,84 | 1.262 | -37,39 | ||||
| 2026-02-09 | 13F | Quest Partners LLC | 16.594 | 105,02 | 269 | 83,56 | ||||
| 2026-02-06 | 13F | EverSource Wealth Advisors, LLC | 19 | -56,82 | 0 | |||||
| 2026-02-13 | 13F | Pinnacle Wealth Planning Services, Inc. | 57 | 1 | ||||||
| 2026-02-04 | 13F | Oregon Public Employees Retirement Fund | 6.160 | 1,65 | 100 | -10,00 | ||||
| 2026-02-13 | 13F | First Trust Advisors Lp | 75.225 | 1.219 | ||||||
| 2026-02-10 | 13F | Goldman Sachs Group Inc | Call | 0 | -100,00 | 0 | ||||
| 2026-02-12 | 13F | Brown Brothers Harriman & Co | 0 | -100,00 | 0 | |||||
| 2026-02-13 | 13F | Public Sector Pension Investment Board | 0 | -100,00 | 0 | |||||
| 2026-02-11 | 13F | Group One Trading, L.p. | 0 | -100,00 | 0 | -100,00 | ||||
| 2025-11-18 | 13F | Boyar Asset Management Inc. | 0 | -100,00 | 0 | |||||
| 2026-02-17 | 13F | Price T Rowe Associates Inc /md/ | 36.688 | 28,50 | 1 | |||||
| 2026-02-17 | 13F | Royal Bank Of Canada | 1.607 | -98,07 | 26 | -98,28 | ||||
| 2026-01-29 | 13F | Teachers Retirement System Of The State Of Kentucky | 7.391 | -12,02 | 0 | |||||
| 2026-04-22 | 13F | Sterling Capital Management LLC | 177 | -64,17 | 2 | -87,50 | ||||
| 2026-02-17 | 13F | Fmr Llc | 10.290 | 120,48 | 167 | 97,62 | ||||
| 2026-02-13 | 13F | BNP Paribas Asset Management Holding S.A. | 537 | 66,77 | 0 | |||||
| 2025-11-14 | 13F | Cubist Systematic Strategies, LLC | Put | 0 | -100,00 | 0 | ||||
| 2026-02-18 | 13F | Caitlin John, LLC | 27 | 0,00 | 0 | |||||
| 2026-04-16 | 13F | SG Americas Securities, LLC | 663.199 | 4,58 | 7 | -30,00 | ||||
| 2026-02-13 | 13F | Toroso Investments, LLC | 0 | -100,00 | 0 | |||||
| 2026-02-11 | 13F | Parallel Advisors, LLC | 22 | -88,60 | 0 | -100,00 | ||||
| 2026-02-13 | 13F | Arrowstreet Capital, Limited Partnership | 1.041.578 | 7,19 | 16.884 | -4,32 | ||||
| 2026-02-17 | 13F | Canada Pension Plan Investment Board | 296.100 | 4.800 | ||||||
| 2026-02-17 | 13F | CastleKnight Management LP | 440.389 | -49,61 | 7.139 | -55,02 | ||||
| 2026-02-17 | 13F | Public Employees Retirement System Of Ohio | 1.599 | 25,81 | 26 | 8,70 | ||||
| 2026-04-07 | 13F | Farther Finance Advisors, LLC | 2.080 | 447,37 | 26 | 333,33 | ||||
| 2026-01-28 | 13F | DekaBank Deutsche Girozentrale | 2.729 | 0,00 | 0 | |||||
| 2026-02-17 | 13F | LMR Partners LLP | Call | 50.000 | 0,00 | 810 | -10,79 | |||
| 2025-10-29 | 13F | Maryland State Retirement & Pension System | 0 | -100,00 | 0 | |||||
| 2026-02-17 | 13F | LMR Partners LLP | 47.631 | -4,18 | 772 | -14,41 | ||||
| 2026-02-02 | 13F | Fifth Third Bancorp | 144 | 0,00 | 2 | 0,00 | ||||
| 2026-02-09 | 13F | Hartland & Co., LLC | 441 | 7 | ||||||
| 2025-11-13 | 13F | Marathon Trading Investment Management LLC | 0 | -100,00 | 0 | -100,00 | ||||
| 2026-02-09 | 13F | Keating Financial Advisory Services, Inc. | 62 | 1 | ||||||
| 2026-01-28 | 13F | Salomon & Ludwin, LLC | 445 | 29,74 | 8 | 16,67 | ||||
| 2026-02-17 | 13F | Millennium Management Llc | Call | 32.800 | -3,53 | 532 | -13,94 | |||
| 2026-02-05 | 13F | Gamco Investors, Inc. Et Al | 55.062 | -13,40 | 893 | -22,70 | ||||
| 2026-02-13 | 13F | Police & Firemen's Retirement System of New Jersey | 7.522 | 0,00 | 122 | -11,03 | ||||
| 2026-02-17 | 13F | Nomura Holdings Inc | 2.411.191 | 0,00 | 39.085 | -10,74 | ||||
| 2026-02-17 | 13F | Sapience Investments, LLC | 25.960 | 48,06 | 421 | 32,08 | ||||
| 2026-02-17 | 13F | Woodline Partners LP | 393.676 | 6.381 | ||||||
| 2026-02-17 | 13F | Ameriprise Financial Inc | 75.963 | -12,21 | 1.231 | -21,64 | ||||
| 2026-02-06 | 13F | Covestor Ltd | 2 | 0,00 | 0 | |||||
| 2026-04-06 | 13F | GAMMA Investing LLC | 212 | -86,05 | 2 | -91,67 | ||||
| 2026-02-12 | 13F | Principal Securities, Inc. | 0 | -100,00 | 0 | -100,00 | ||||
| 2025-11-12 | 13F | Headlands Technologies LLC | 0 | -100,00 | 0 | |||||
| 2026-02-13 | 13F | Manufacturers Life Insurance Company, The | 0 | -100,00 | 0 | |||||
| 2026-02-04 | 13F | First Eagle Investment Management, LLC | 0 | -100,00 | 0 | |||||
| 2026-02-10 | 13F | Intech Investment Management Llc | 44.658 | -73,00 | 724 | -75,92 | ||||
| 2026-02-17 | 13F | Susquehanna International Group, Llp | 0 | -100,00 | 0 | -100,00 | ||||
| 2026-04-09 | 13F | DHJJ Financial Advisors, Ltd. | 10 | 0,00 | 0 | |||||
| 2026-01-28 | 13F | N.E.W. Advisory Services LLC | 0 | -100,00 | 0 | |||||
| 2026-02-17 | 13F | Clearline Capital LP | 683.408 | -57,81 | 11.078 | -62,34 | ||||
| 2026-02-11 | 13F | LPL Financial LLC | 11.532 | 187 | ||||||
| 2026-02-13 | 13F | AlTi Global, Inc. | 13.585 | 0,00 | 220 | -10,57 | ||||
| 2026-01-28 | 13F | Klp Kapitalforvaltning As | 11.000 | 83,33 | 178 | 64,81 | ||||
| 2026-02-11 | 13F | CenterBook Partners LP | 265.155 | 4.298 | ||||||
| 2026-02-12 | 13F | Ci Investments Inc. | 0 | -100,00 | 0 | |||||
| 2026-02-06 | 13F | Pnc Financial Services Group, Inc. | 2.812 | -3,60 | 46 | -13,46 | ||||
| 2026-02-13 | 13F | Boston Partners | 38.917 | 70,62 | 631 | 52,17 | ||||
| 2026-02-17 | 13F | Magnetar Financial LLC | 11.413 | 185 | ||||||
| 2025-11-14 | 13F | Texas Permanent School Fund | 0 | -100,00 | 0 | |||||
| 2026-02-13 | 13F | Barclays Plc | Call | 0 | -100,00 | 0 | -100,00 | |||
| 2026-02-14 | 13F | Rockefeller Capital Management L.P. | 123.500 | -16,92 | 2.002 | -25,86 | ||||
| 2026-02-17 | 13F | Optiver Holding B.V. | 0 | -100,00 | 0 | |||||
| 2026-02-13 | 13F | Victory Capital Management Inc | 139.422 | 74,00 | 2.260 | 55,33 | ||||
| 2025-11-12 | 13F | Easterly Investment Partners Llc | 0 | -100,00 | 0 | |||||
| 2026-02-12 | 13F | Wealthspire Advisors, LLC | 0 | -100,00 | 0 | |||||
| 2026-02-13 | 13F | Charles Schwab Investment Management Inc | 628.455 | 12,50 | 10.187 | 0,42 | ||||
| 2026-01-29 | 13F | Comerica Bank | 4.017 | -18,47 | 65 | -26,97 | ||||
| 2026-02-17 | 13F | XTX Topco Ltd | 0 | -100,00 | 0 | |||||
| 2026-02-10 | 13F | Goldman Sachs Group Inc | 1.511.591 | 31,96 | 24.503 | 17,79 | ||||
| 2026-04-15 | 13F | Fortitude Family Office, LLC | 39 | 2,63 | 0 | |||||
| 2026-02-11 | 13F | Cedar Mountain Advisors, LLC | 31 | 416,67 | 1 | |||||
| 2026-02-17 | 13F | Advisor Group Holdings, Inc. | 3.930 | 78,15 | 64 | 18,87 | ||||
| 2026-02-12 | 13F | Campbell & CO Investment Adviser LLC | 0 | -100,00 | 0 | -100,00 | ||||
| 2026-02-13 | 13F | Natixis | 374.000 | 6.063 | ||||||
| 2026-02-17 | 13F | Tower Research Capital LLC (TRC) | 2.783 | 24,74 | 45 | 12,50 | ||||
| 2026-02-17 | 13F | Dark Forest Capital Management Lp | 0 | -100,00 | 0 | |||||
| 2026-02-05 | 13F | Allworth Financial LP | 318 | -16,09 | 5 | -16,67 | ||||
| 2025-11-14 | 13F | Manatuck Hill Partners, LLC | 0 | -100,00 | 0 | |||||
| 2026-04-16 | 13F | Beese Fulmer Investment Management, Inc. | 30.165 | 0,99 | 327 | -32,64 | ||||
| 2026-02-17 | 13F | Schonfeld Strategic Advisors LLC | 52.272 | 847 | ||||||
| 2025-11-21 | 13F | Bell Investment Advisors, Inc | 0 | -100,00 | 0 | |||||
| 2026-02-17 | 13F | State Of Wisconsin Investment Board | 26.454 | 429 | ||||||
| 2026-02-17 | 13F | Citadel Advisors Llc | Put | 295.600 | 38,58 | 4.792 | 23,70 | |||
| 2026-02-17 | 13F | Citadel Advisors Llc | 272.783 | -4,06 | 4.422 | -14,37 | ||||
| 2026-02-17 | 13F | Guggenheim Capital Llc | 16.362 | 265 | ||||||
| 2026-02-17 | 13F | Algert Global Llc | 15.290 | 0 | ||||||
| 2026-02-17 | 13F | Citadel Advisors Llc | Call | 357.900 | -38,46 | 5.802 | -45,07 | |||
| 2026-02-17 | 13F | Alliancebernstein L.p. | 11.710 | -37,64 | 190 | -44,57 | ||||
| 2026-02-17 | 13F | Russell Investments Group, Ltd. | 85.004 | 8,97 | 1.378 | -2,75 | ||||
| 2026-02-12 | 13F | Cibc World Markets Corp | 335.799 | -0,46 | 5.443 | -46,36 | ||||
| 2025-11-17 | 13F | GWM Advisors LLC | 0 | -100,00 | 0 | |||||
| 2026-02-12 | 13F | Dimensional Fund Advisors Lp | 500.272 | -26,53 | 8.109 | -34,44 | ||||
| 2026-02-11 | 13F | Ing Groep Nv | 451.000 | 7.311 | ||||||
| 2026-02-13 | 13F | Citigroup Inc | 87.343 | 68,42 | 1.416 | 50,37 | ||||
| 2026-04-13 | 13F | IFP Advisors, Inc | 108 | 12,50 | 1 | 0,00 | ||||
| 2026-04-20 | 13F | State of Alaska, Department of Revenue | 0 | -100,00 | 0 | |||||
| 2026-01-30 | 13F | New York State Teachers Retirement System | 42.923 | -0,23 | 1 | |||||
| 2026-02-12 | 13F | BlackRock, Inc. | 4.168.127 | 2,14 | 67.565 | -8,83 | ||||
| 2026-02-23 | 13F | Virtu Financial LLC | 22.213 | 0 | ||||||
| 2026-02-11 | 13F | Ameritas Investment Partners, Inc. | 2.272 | 37 | ||||||
| 2026-02-13 | 13F | Barclays Plc | 112.311 | -33,46 | 1.821 | -40,62 | ||||
| 2026-04-07 | 13F | CoreCap Advisors, LLC | 8 | 0 | ||||||
| 2026-02-12 | 13F | Ensign Peak Advisors, Inc | 4.048 | -71,08 | 66 | -74,41 | ||||
| 2026-02-09 | 13F | Geode Capital Management, Llc | 656.282 | -1,01 | 10.640 | -11,64 | ||||
| 2026-02-17 | 13F | Susquehanna International Group, Llp | Call | 373.300 | 3,41 | 6.051 | -7,69 | |||
| 2026-02-13 | 13F | Public Employees Retirement Association Of Colorado | 4.474 | 0,00 | 0 | |||||
| 2026-02-17 | 13F | Eminence Capital, Lp | 2.346.038 | -0,64 | 38.029 | -11,31 | ||||
| 2026-02-17 | 13F | Susquehanna International Group, Llp | Put | 184.300 | -46,14 | 2.988 | -51,93 | |||
| 2026-02-13 | 13F | Walleye Trading LLC | 12.794 | 193,37 | 207 | 162,03 | ||||
| 2026-02-13 | 13F | Walleye Trading LLC | Put | 75.800 | 68,07 | 1.229 | 49,94 | |||
| 2026-02-13 | 13F | Walleye Trading LLC | Call | 48.100 | -40,76 | 780 | -47,15 | |||
| 2025-11-14 | 13F | Point72 Asia (Singapore) Pte. Ltd. | 9.794 | 230,10 | 178 | 98,88 | ||||
| 2025-11-21 | 13F/A | CIBC Bancorp USA Inc. | 336.899 | 6.118 | ||||||
| 2026-01-16 | 13F | FNY Investment Advisers, LLC | 0 | -100,00 | 0 | |||||
| 2026-02-17 | 13F | Farringdon Capital, Ltd. | 0 | -100,00 | 0 | |||||
| 2026-01-16 | 13F | FNY Investment Advisers, LLC | Call | 0 | -100,00 | 0 | ||||
| 2026-02-13 | 13F | Verition Fund Management LLC | 130.604 | -17,39 | 2.117 | -26,26 | ||||
| 2026-02-18 | 13F | State of Tennessee, Treasury Department | 6.938 | -7,32 | 130 | -3,70 | ||||
| 2026-02-13 | 13F | Healthcare Of Ontario Pension Plan Trust Fund | 1.515.000 | 40,15 | 24.558 | 25,10 | ||||
| 2026-02-17 | 13F | Tudor Investment Corp Et Al | Put | 25.100 | 52,12 | 407 | 35,79 | |||
| 2025-11-13 | 13F | Total Investment Management Inc | 0 | -100,00 | 0 | |||||
| 2026-02-17 | 13F | Tudor Investment Corp Et Al | Call | 25.700 | 0,39 | 417 | -10,34 | |||
| 2026-02-13 | 13F | Prudential Financial Inc | 25.594 | -7,62 | 415 | -17,69 | ||||
| 2026-02-11 | 13F | Los Angeles Capital Management Llc | 222 | 3 | ||||||
| 2026-02-17 | 13F | D. E. Shaw & Co., Inc. | Call | 112.400 | -34,54 | 1.822 | -41,57 | |||
| 2026-02-10 | 13F | CIBC World Markets Inc. | 335.100 | -0,53 | 5.432 | -11,23 | ||||
| 2026-02-17 | 13F | D. E. Shaw & Co., Inc. | Put | 210.600 | 51,62 | 3.414 | 35,33 | |||
| 2026-02-13 | 13F | Marshall Wace, Llp | 0 | -100,00 | 0 | |||||
| 2026-02-17 | 13F | D. E. Shaw & Co., Inc. | 174.005 | -11,14 | 2.821 | -20,70 | ||||
| 2026-01-29 | 13F | UBS Group AG | 100.411 | -80,31 | 1.628 | -82,43 | ||||
| 2026-02-17 | 13F | Capital Fund Management S.a. | Call | 67.300 | -50,30 | 1.091 | -55,66 | |||
| 2026-02-12 | 13F | Steward Partners Investment Advisory, Llc | 100 | 19,05 | 2 | 0,00 | ||||
| 2025-11-14 | 13F | Bayesian Capital Management, LP | 0 | -100,00 | 0 | |||||
| 2026-02-17 | 13F | Caption Management, LLC | 18.906 | 33,58 | 306 | 19,07 | ||||
| 2026-01-30 | 13F | Us Bancorp \de\ | 346 | -59,95 | 6 | -66,67 | ||||
| 2026-02-17 | 13F | Capital Fund Management S.a. | Put | 62.000 | -68,04 | 1.005 | -71,47 | |||
| 2026-01-28 | 13F | Ruffer LLP | 130.065 | 2.111 | ||||||
| 2026-01-29 | 13F | IMC-Chicago, LLC | 0 | -100,00 | 0 | -100,00 | ||||
| 2026-02-13 | 13F | Blueshift Asset Management, LLC | 0 | -100,00 | 0 | |||||
| 2026-02-09 | 13F | Kazazian Asset Management, LLC | 100.000 | 32,11 | 1.621 | 17,98 | ||||
| 2025-11-14 | 13F | Point72 (DIFC) Ltd | 11.048 | 172,12 | 201 | 63,93 | ||||
| 2026-02-17 | 13F | Mangrove Partners | 15.352 | -27,64 | 249 | -35,58 | ||||
| 2026-02-12 | 13F | Counterpoint Mutual Funds LLC | 31.718 | 514 | ||||||
| 2026-02-17 | 13F | Quantinno Capital Management LP | 11.307 | 183 | ||||||
| 2026-02-17 | 13F | Hill Path Capital LP | 7.119.255 | 0,00 | 115.403 | -10,74 | ||||
| 2026-02-17 | 13F | Tudor Investment Corp Et Al | 11.011 | 178 | ||||||
| 2026-01-15 | 13F | Nisa Investment Advisors, Llc | 648 | 24,86 | 11 | 11,11 | ||||
| 2026-01-26 | 13F | Cwm, Llc | 591 | 111,83 | 0 | |||||
| 2026-02-13 | 13F | State Street Corp | 1.106.488 | 2,63 | 17.936 | -8,39 | ||||
| 2026-02-10 | 13F | Bank of New York Mellon Corp | 155.032 | -19,24 | 2.513 | -27,91 | ||||
| 2026-02-13 | 13F | Landscape Capital Management, L.l.c. | 32.457 | 526 | ||||||
| 2025-11-12 | 13F | Commonwealth Of Pennsylvania Public School Empls Retrmt Sys | 0 | -100,00 | 0 | |||||
| 2026-04-13 | 13F | True Wealth Design, LLC | 0 | -100,00 | 0 | |||||
| 2026-01-07 | 13F | Central Pacific Bank - Trust Division | 0 | -100,00 | 0 | |||||
| 2026-02-17 | 13F | California State Teachers Retirement System | 25.649 | -15,89 | 416 | -24,95 | ||||
| 2026-02-13 | 13F | Quarry LP | 72 | 1 | ||||||
| 2026-02-13 | 13F | Squarepoint Ops LLC | Call | 80.300 | -54,56 | 1.302 | -59,45 | |||
| 2026-02-13 | 13F | Peak6 Llc | Call | 0 | -100,00 | 0 | ||||
| 2026-02-13 | 13F | Squarepoint Ops LLC | Put | 93.600 | -63,47 | 1.517 | -67,39 | |||
| 2025-11-14 | 13F | Point72 Hong Kong Ltd | 0 | -100,00 | 0 | |||||
| 2026-02-09 | 13F | Schwarz Dygos Wheeler Investment Advisors Llc | 12.940 | 0,00 | 210 | -10,68 | ||||
| 2026-02-13 | 13F | Squarepoint Ops LLC | 36.153 | -77,89 | 586 | -80,26 | ||||
| 2026-02-10 | 13F | MUFG Securities EMEA plc | 454.000 | 7.359 | ||||||
| 2026-02-12 | 13F | CIBC Private Wealth Group, LLC | 7 | 0 | ||||||
| 2026-02-12 | 13F | Ankerstar Wealth, LLC | 12 | 0 | ||||||
| 2026-02-06 | 13F | Lsv Asset Management | 400.486 | -1,91 | 6 | -14,29 | ||||
| 2026-02-13 | 13F | Peak6 Llc | 0 | -100,00 | 0 | |||||
| 2026-02-12 | 13F | Swiss National Bank | 53.673 | 0,00 | 870 | -10,68 | ||||
| 2026-02-17 | 13F | Bank Of America Corp /de/ | 154.193 | -41,48 | 2.499 | -47,77 | ||||
| 2026-02-17 | 13F | MIRAE ASSET GLOBAL ETFS HOLDINGS Ltd. | 12.634 | -0,94 | 205 | -11,69 | ||||
| 2025-11-14 | 13F | Skopos Labs, Inc. | 0 | -100,00 | 0 | |||||
| 2026-02-11 | 13F | Illinois Municipal Retirement Fund | 0 | -100,00 | 0 | |||||
| 2026-02-13 | 13F | Peak6 Llc | Put | 0 | -100,00 | 0 | ||||
| 2025-11-07 | 13F | Shell Asset Management Co | 3.586 | -56,85 | 0 | |||||
| 2026-04-06 | 13F | Versant Capital Management, Inc | 834 | 6.315,38 | 9 | |||||
| 2026-02-17 | 13F | CastleKnight Management LP | Call | 0 | -100,00 | 0 | -100,00 | |||
| 2026-02-11 | 13F | Barrow Hanley Mewhinney & Strauss Llc | 0 | -100,00 | 0 | |||||
| 2026-02-12 | 13F | Nuveen, LLC | 102.226 | 1,24 | 1.657 | -9,60 | ||||
| 2025-11-14 | 13F | Jain Global LLC | 0 | -100,00 | 0 | |||||
| 2026-02-05 | 13F | Thrivent Financial For Lutherans | 18.580 | -4,50 | 0 | |||||
| 2026-02-10 | 13F | Quantbot Technologies LP | 1.878 | -20,09 | 30 | -28,57 | ||||
| 2026-04-17 | 13F | Signal Advisors Wealth, LLC | Call | 2.000 | 8 | |||||
| 2026-02-06 | 13F | Leonteq Securities AG | 2.600 | 54,58 | 42 | 40,00 | ||||
| 2026-02-12 | 13F | New York State Common Retirement Fund | 8.586 | 0,00 | 139 | -10,32 | ||||
| 2026-02-13 | 13F | Great West Life Assurance Co /can/ | 23.794 | -21,38 | 0 | |||||
| 2026-02-17 | 13F | Millennium Management Llc | 0 | -100,00 | 0 | |||||
| 2026-02-17 | 13F | Aqr Capital Management Llc | 34.746 | 186,80 | 563 | 155,91 | ||||
| 2026-02-17 | 13F | Point72 Asset Management, L.P. | Call | 11.200 | 182 | |||||
| 2026-02-13 | 13F/A | Alberta Investment Management Corp | 0 | -100,00 | 0 | |||||
| 2026-02-17 | 13F | Point72 Asset Management, L.P. | 348.484 | 48,52 | 5.649 | 32,58 | ||||
| 2026-02-17 | 13F | Brevan Howard Capital Management LP | 0 | -100,00 | 0 | |||||
| 2026-04-08 | 13F | M.e. Allison & Co., Inc. | 97.700 | 16,38 | 1.058 | -22,21 | ||||
| 2025-11-05 | 13F | Envestnet Asset Management Inc | 0 | -100,00 | 0 | |||||
| 2026-02-13 | 13F | Smartleaf Asset Management LLC | 166 | -34,13 | 3 | -50,00 | ||||
| 2025-11-21 | 13F | Nebula Research & Development LLC | 0 | -100,00 | 0 | |||||
| 2026-02-12 | 13F | Quadrant Capital Group Llc | 991 | -82,77 | 16 | -84,62 | ||||
| 2026-03-17 | 13F/A | Barclays Plc | Put | 0 | -100,00 | 0 | -100,00 | |||
| 2026-02-09 | 13F | Atlantic Trust, LLC | 0 | -100,00 | 0 | |||||
| 2026-02-13 | 13F | Parkside Financial Bank & Trust | 3 | 0,00 | 0 | |||||
| 2026-02-17 | 13F | Crawford Fund Management, LLC | Put | 21.000 | -61,82 | 340 | -65,93 | |||
| 2026-01-21 | 13F | Sound Income Strategies, LLC | 100 | 2 | ||||||
| 2026-01-28 | 13F | Universal- Beteiligungs- und Servicegesellschaft mbH | 95.986 | 0,00 | 1.556 | -10,79 | ||||
| 2026-02-17 | 13F | Incline Global Management LLC | 76.548 | -90,95 | 1.241 | -91,93 | ||||
| 2026-02-12 | 13F | State Board Of Administration Of Florida Retirement System | 10.340 | 0,00 | 168 | -10,70 | ||||
| 2026-04-07 | 13F | Signaturefd, Llc | 509 | -24,70 | 6 | -50,00 | ||||
| 2026-04-17 | 13F | Signal Advisors Wealth, LLC | 4.288 | 46 | ||||||
| 2025-11-14 | 13F | Janus Henderson Group Plc | 0 | -100,00 | 0 | |||||
| 2026-02-06 | 13F | Gsa Capital Partners Llp | 110.080 | 138,97 | 2 | |||||
| 2026-02-12 | 13F | Groupe la Francaise | 0 | -100,00 | 0 | |||||
| 2026-02-10 | 13F | Rothschild Investment Llc | 4 | 0 | ||||||
| 2026-02-11 | 13F | Hughes Financial Services, LLC | 0 | -100,00 | 0 | |||||
| 2026-02-11 | 13F | Deutsche Bank Ag\ | 24.794 | 3,08 | 402 | -8,03 | ||||
| 2026-02-11 | 13F | Jpmorgan Chase & Co | 424.277 | 474,53 | 6.878 | 412,83 | ||||
| 2026-02-13 | 13F | Ausdal Financial Partners, Inc. | 13.220 | 17,77 | 214 | 5,42 | ||||
| 2026-04-23 | 13F | Game Plan Financial Advisors, LLC | 152 | 0,00 | 2 | -50,00 | ||||
| 2025-11-14 | 13F | ExodusPoint Capital Management, LP | 0 | -100,00 | 0 | -100,00 | ||||
| 2026-02-17 | 13F | Engineers Gate Manager LP | 31.734 | -58,75 | 514 | -63,21 | ||||
| 2026-02-06 | 13F | Larson Financial Group LLC | 591 | 5.810,00 | 10 | |||||
| 2026-02-09 | 13F | Legal & General Group Plc | 73.118 | -1,19 | 1.185 | -11,76 | ||||
| 2026-02-03 | 13F | SBI Securities Co., Ltd. | 100 | 0,00 | 2 | 0,00 | ||||
| 2025-10-30 | 13F | Jennison Associates Llc | 0 | -100,00 | 0 | |||||
| 2026-02-17 | 13F | Creative Planning | 20.232 | 91,34 | 328 | 70,31 | ||||
| 2026-01-22 | 13F | Bfsg, Llc | 30 | 0,00 | 0 | |||||
| 2026-02-13 | 13F | Caitong International Asset Management Co., Ltd | 1.942 | 616,61 | 31 | 675,00 | ||||
| 2026-02-05 | 13F | Amalgamated Bank | 8.008 | -4,90 | 0 | |||||
| 2026-02-12 | 13F | Jane Street Group, Llc | Call | 275.700 | -2,23 | 4.469 | -12,73 | |||
| 2026-02-12 | 13F | Jane Street Group, Llc | 221.661 | 150,22 | 3.593 | 123,45 | ||||
| 2026-02-13 | 13F | Sei Investments Co | 13.139 | -60,87 | 213 | -65,19 | ||||
| 2026-02-13 | 13F | Wells Fargo & Company/mn | 80.267 | 8,77 | 1.301 | -2,91 | ||||
| 2026-02-12 | 13F | Jane Street Group, Llc | Put | 35.600 | 4,71 | 577 | -6,48 | |||
| 2026-02-13 | 13F | Ubs Asset Management Americas Inc | 79.929 | 34,72 | 1.296 | 20,24 | ||||
| 2026-02-17 | 13F | Northern Trust Corp | 281.764 | -8,73 | 4.567 | -18,52 | ||||
| 2025-11-21 | 13F/A | Royal Bank Of Canada | Put | 0 | -100,00 | 0 | -100,00 | |||
| 2026-04-16 | 13F | Capital Advisors, Ltd. LLC | 0 | -100,00 | 0 | |||||
| 2026-01-29 | 13F | IMC-Chicago, LLC | Put | 109.800 | -35,90 | 1.780 | -42,80 | |||
| 2026-01-29 | 13F | IMC-Chicago, LLC | Call | 171.200 | -18,05 | 2.775 | -26,84 | |||
| 2026-04-13 | 13F | Massmutual Trust Co Fsb/adv | 529 | 0,00 | 6 | -37,50 | ||||
| 2026-02-13 | 13F | Maverick Capital Ltd | 325.487 | 115,20 | 5.276 | 92,13 | ||||
| 2026-02-13 | 13F | SRS Capital Advisors, Inc. | 41 | -92,53 | 1 | -100,00 | ||||
| 2026-02-17 | 13F | Freestone Grove Partners LP | 18.517 | -25,05 | 300 | -33,04 | ||||
| 2026-02-17 | 13F | Shay Capital LLC | Call | 10.000 | 162 | |||||
| 2026-04-20 | 13F | Louisiana State Employees Retirement System | 0 | -100,00 | 0 | |||||
| 2026-02-13 | 13F | Rhumbline Advisers | 88.822 | 1,75 | 1.440 | -9,21 | ||||
| 2026-04-20 | 13F | Edge Wealth Management LLC | 10.083 | 0,00 | 109 | -33,13 | ||||
| 2026-02-02 | 13F | Principal Financial Group Inc | 129.307 | -0,85 | 2.096 | -11,49 | ||||
| 2026-02-13 | 13F | Walleye Capital LLC | Call | 64.500 | -48,15 | 1.046 | -53,74 | |||
| 2026-02-13 | 13F | Walleye Capital LLC | Put | 25.500 | -53,80 | 413 | -58,78 | |||
| 2026-02-12 | 13F | MetLife Investment Management, LLC | 16.275 | 0,00 | 264 | -10,85 | ||||
| 2026-02-17 | 13F | Hotchkis & Wiley Capital Management Llc | 243.940 | 22,51 | 3.954 | 9,35 | ||||
| 2026-02-17 | 13F | Raymond James Financial Inc | 107.418 | -4,95 | 1.741 | -15,16 | ||||
| 2026-02-17 | 13F | Jones Financial Companies Lllp | 374 | 31,69 | 6 | 20,00 | ||||
| 2026-02-02 | 13F | Hussman Strategic Advisors, Inc. | 0 | -100,00 | 0 | |||||
| 2025-11-14 | 13F | Wolverine Trading, Llc | 29.170 | 137,48 | 554 | 47,86 | ||||
| 2025-11-14 | 13F | Wolverine Trading, Llc | Call | 123.200 | 3,79 | 2.340 | -35,28 | |||
| 2025-11-14 | 13F | Wolverine Trading, Llc | Put | 76.100 | 37,12 | 1.445 | -14,45 | |||
| 2026-02-17 | 13F | Capital Fund Management S.a. | 0 | -100,00 | 0 | -100,00 | ||||
| 2026-01-27 | 13F | Zurcher Kantonalbank (Zurich Cantonalbank) | 11.890 | 0,00 | 193 | -10,70 | ||||
| 2025-11-14 | 13F | Millennium Management Llc | Put | 0 | -100,00 | 0 | -100,00 | |||
| 2026-04-17 | 13F | Signal Advisors Wealth, LLC | Put | 6.000 | 13 | |||||
| 2026-02-13 | 13F | National Bank Of Canada /fi/ | 398.000 | 6.452 | ||||||
| 2025-11-12 | 13F/A | Norges Bank | 0 | -100,00 | 0 | |||||
| 2026-02-09 | 13F | Hantz Financial Services, Inc. | 909 | 127,82 | 0 | |||||
| 2025-12-18 | 13F | Danske Bank A/s | 0 | -100,00 | 0 | |||||
| 2026-04-20 | 13F | Hilton Head Capital Partners, LLC | 144 | 0,00 | 2 | -50,00 | ||||
| 2026-02-12 | 13F | Hrt Financial Lp | 49.600 | 129,63 | 1 | |||||
| 2026-02-13 | 13F | Patient Capital Management, LLC | 0 | -100,00 | 0 | |||||
| 2026-04-23 | 13F | Farmers & Merchants Investments Inc | 0 | -100,00 | 0 | |||||
| 2026-02-13 | 13F | Walleye Capital LLC | 63.533 | 1.030 | ||||||
| 2025-11-03 | 13F | Arizona State Retirement System | 0 | -100,00 | 0 | |||||
| 2026-02-09 | 13F | Huntington National Bank | 14 | 0,00 | 0 | |||||
| 2026-02-17 | 13F | Advisory Services Network, LLC | 0 | -100,00 | 0 | |||||
| 2026-02-17 | 13F | Saba Capital Management, L.P. | 320.309 | 236,07 | 5.192 | 200,12 |
Other Listings
| DE:9DB | 10,90 € |