Grundlæggende statistik
| Institutionelle ejere | 100 total, 100 long only, 0 short only, 0 long/short - change of 12,36% MRQ |
| Gennemsnitlig porteføljeallokering | 0.3464 % - change of 31,35% MRQ |
| Institutionelle aktier (lange) | 9.095.965 (ex 13D/G) - change of 1,88MM shares 25,97% MRQ |
| Institutionel værdi (lang) | $ 443.187 USD ($1000) |
Institutionelt ejerskab og aktionærer
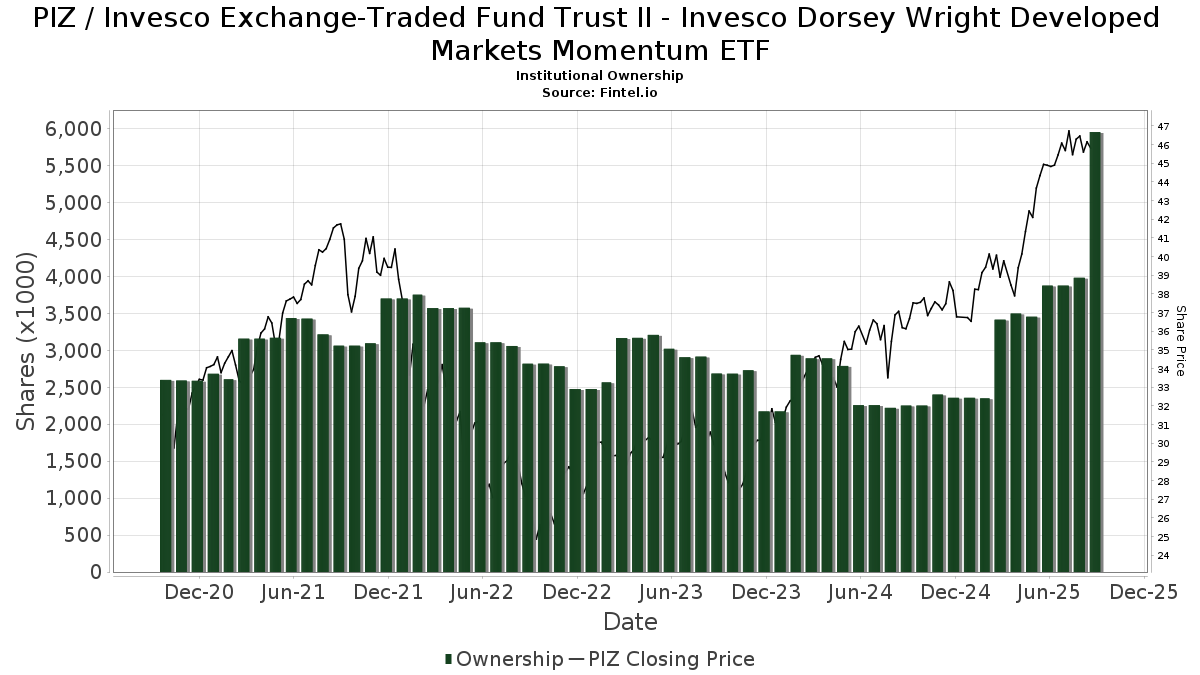
Invesco Exchange-Traded Fund Trust II - Invesco Dorsey Wright Developed Markets Momentum ETF (US:PIZ) har 100 institutionelle ejere og aktionærer, der har indsendt 13D/G- eller 13F-formularer til Securities Exchange Commission (SEC). Disse institutioner har i alt 9,095,965 aktier. Største aktionærer omfatter Wells Fargo & Company/mn, Morgan Stanley, Affinity Wealth Management Llc, LPL Financial LLC, Royal Bank Of Canada, Axiom Financial Strategies, LLC, Creative Financial Designs Inc /adv, Systelligence, LLC, Wealth Enhancement Advisory Services, Llc, and UBS Group AG .
Invesco Exchange-Traded Fund Trust II - Invesco Dorsey Wright Developed Markets Momentum ETF (NasdaqGM:PIZ) institutionel ejerskabsstruktur viser aktuelle positioner i virksomheden efter institutioner og fonde, samt seneste ændringer i positionsstørrelse. Større aktionærer kan omfatte individuelle investorer, investeringsforeninger, hedgefonde eller institutioner. Skema 13D angiver, at investoren besidder (eller besidder) mere end 5 % af virksomheden og har til hensigt (eller har til hensigt at) aktivt at forfølge en ændring i forretningsstrategi. Skema 13G indikerer en passiv investering på over 5%.
The share price as of April 21, 2026 is 54,20 / share. Previously, on April 22, 2025, the share price was 40,54 / share. This represents an increase of 33,70% over that period.
Fondens stemningsscore
Fund Sentiment Score (fka Ownership Accumulation Score) finder de aktier, der bliver mest købt af fonde. Det er resultatet af en sofistikeret, multi-faktor kvantitativ model, der identificerer virksomheder med de højeste niveauer af institutionel akkumulering. Scoringsmodellen bruger en kombination af den samlede stigning i oplyste ejere, ændringerne i porteføljeallokeringer i disse ejere og andre målinger. Tallet går fra 0 til 100, hvor højere tal indikerer et højere niveau af akkumulering for sine jævnaldrende, og 50 er gennemsnittet.
Opdateringsfrekvens: Dagligt
Se Ownership Explorer, som giver en liste over højest rangerende virksomheder.
AI+ Ask Fintel’s AI assistant about Invesco Exchange-Traded Fund Trust II - Invesco Dorsey Wright Developed Markets Momentum ETF.
Select a question to share a public post with an AI-crafted answer.
Thinking of good questions…
Institutionel Put/Call-forhold
Ud over at indberette standardaktie- og gældsudstedelser skal institutter med mere end 100 mill. aktiver under forvaltning også oplyse deres put- og call-optionsbeholdninger. Da salgsoptioner generelt indikerer negativ stemning, og købsoptioner indikerer positiv stemning, kan vi få en fornemmelse af den overordnede institutionelle stemning ved at plotte forholdet mellem put og kald. Diagrammet til højre viser det historiske put/call-forhold for dette instrument.
Brug af Put/Call Ratio som en indikator for investorernes stemning overvinder en af de vigtigste mangler ved at bruge totalt institutionelt ejerskab, som er, at en betydelig mængde af aktiver under forvaltning investeres passivt for at spore indekser. Passivt forvaltede fonde køber typisk ikke optioner, så indikatoren for put/call-forholdet følger mere nøje følelsen af aktivt forvaltede fonde.

13F og NPORT arkivering
Detaljer om 13F-arkivering er gratis. Detaljer om NP-ansøgninger kræver et premium-medlemskab. Grønne rækker angiver nye positioner. Røde rækker angiver lukkede positioner. Klik på linket ikon for at se den fulde transaktionshistorik.
Opgrader
for at låse premium-data op og eksportere til Excel ![]() .
.
| Fil dato | Kilde | Investor | Type | Gennemsnitlig pris (Øst) |
Aktier | Δ Aktier (%) |
Rapporteret Værdi ($1000) |
Δ Værdi (%) |
Port Alloc (%) |
|
|---|---|---|---|---|---|---|---|---|---|---|
| 2026-02-17 | 13F | Mercer Global Advisors Inc /adv | 6.673 | 5,17 | 327 | 7,95 | ||||
| 2026-04-14 | 13F | Drive Wealth Management, Llc | 5.773 | 3,59 | 286 | 4,78 | ||||
| 2026-04-13 | 13F | Cyndeo Wealth Partners, LLC | 20.912 | -7,24 | 1.036 | -6,25 | ||||
| 2026-02-13 | 13F | Kane Investment Management, Inc. | 7.699 | 7,95 | 377 | 10,88 | ||||
| 2026-04-15 | 13F | Monument Capital Management | 8.855 | 0,00 | 439 | 1,15 | ||||
| 2026-04-16 | 13F | Consolidated Planning Corp | 0 | -100,00 | 0 | |||||
| 2026-01-16 | 13F | Genesee Capital Advisors, LLC | 36.824 | 5,35 | 1.804 | 8,22 | ||||
| 2026-02-13 | 13F | SRS Capital Advisors, Inc. | 2.712 | 133 | ||||||
| 2026-02-17 | 13F | Royal Bank Of Canada | 577.277 | 46,29 | 28.276 | 50,30 | ||||
| 2026-04-14 | 13F | Nbc Securities, Inc. | 98.272 | 132,73 | 4.866 | 135,30 | ||||
| 2026-02-13 | 13F | Change Path, LLC | 22.804 | 1.117 | ||||||
| 2026-02-06 | 13F | Global Retirement Partners, LLC | 11.327 | 0,22 | 555 | 2,97 | ||||
| 2026-02-12 | 13F | Wagner Wealth Management, Corp | 55.450 | 2.716 | ||||||
| 2026-02-12 | 13F | Principal Securities, Inc. | 0 | -100,00 | 0 | -100,00 | ||||
| 2026-04-17 | 13F | Willner & Heller, Llc | 5.120 | 254 | ||||||
| 2026-02-17 | 13F | Jones Financial Companies Lllp | 45.540 | 137,83 | 2.231 | 148,61 | ||||
| 2026-01-21 | 13F | Flagship Harbor Advisors, Llc | 15 | 1 | ||||||
| 2025-11-12 | 13F | Park Square Financial Group, LLC | 0 | -100,00 | 0 | |||||
| 2026-02-17 | 13F | Gladstone Institutional Advisory LLC | 6.283 | 30,92 | 308 | 34,65 | ||||
| 2026-02-09 | 13F | Key FInancial Inc | 406 | 0,00 | 20 | 0,00 | ||||
| 2026-02-13 | 13F | Citigroup Inc | 16.819 | 3,46 | 824 | 6,19 | ||||
| 2026-02-17 | 13F | Ameriprise Financial Inc | 12.259 | 601 | ||||||
| 2026-02-13 | 13F | Morgan Stanley | 962.626 | 14,04 | 47.152 | 17,17 | ||||
| 2026-02-17 | 13F | Cetera Investment Advisers | 74.414 | 129,15 | 3.645 | 135,40 | ||||
| 2026-04-15 | 13F | Steinberganna Wealth Management | 14.115 | 31,40 | 699 | 32,70 | ||||
| 2026-02-13 | 13F | Wells Fargo & Company/mn | 2.002.892 | 3,11 | 98.107 | 5,94 | ||||
| 2026-02-13 | 13F | Mml Investors Services, Llc | 53.833 | 20,34 | 2.637 | 23,64 | ||||
| 2026-02-13 | 13F | Stifel Financial Corp | 63.752 | 14,48 | 3.123 | 17,63 | ||||
| 2026-04-08 | 13F | Wealth Enhancement Advisory Services, Llc | 317.195 | -40,97 | 15.953 | -41,14 | ||||
| 2026-01-26 | 13F | PFG Investments, LLC | 6.517 | 1,45 | 319 | 4,25 | ||||
| 2026-02-12 | 13F | Commonwealth Equity Services, Llc | 62.474 | 5,38 | 3.060 | 152.900,00 | ||||
| 2026-02-10 | 13F | CIBC World Markets Inc. | 7.441 | -3,88 | 364 | -1,36 | ||||
| 2026-02-17 | 13F | Advisory Services Network, LLC | 14.072 | 38,60 | 689 | 42,36 | ||||
| 2026-04-20 | 13F | RiverTree Advisors, LLC | 20.871 | -23,82 | 1.034 | -23,03 | ||||
| 2026-01-27 | 13F | Bolthouse Investments, LLC | 4.190 | 205 | ||||||
| 2026-02-17 | 13F | Fmr Llc | 814 | 13,21 | 40 | 14,71 | ||||
| 2026-01-22 | 13F | Vista Investment Partners Ii, Llc | 40.898 | 4,77 | 2.003 | 7,63 | ||||
| 2026-02-13 | 13F | Resources Investment Advisors, LLC. | 8.245 | 0,00 | 404 | 2,54 | ||||
| 2026-01-29 | 13F | UBS Group AG | 294.971 | 6,96 | 14.449 | 9,89 | ||||
| 2026-02-17 | 13F | Bank Of America Corp /de/ | 24.338 | -0,87 | 1.192 | 1,88 | ||||
| 2025-11-14 | 13F | Flow Traders U.s. Llc | 0 | -100,00 | 0 | |||||
| 2026-01-29 | 13F | Comerica Bank | 10.621 | 18,60 | 520 | 22,07 | ||||
| 2026-01-27 | 13F | Mainstay Capital Management Llc /adv | 4.927 | 8,17 | 241 | 11,06 | ||||
| 2026-02-17 | 13F | Citadel Advisors Llc | 129.634 | 6.350 | ||||||
| 2026-02-11 | 13F | Janney Montgomery Scott LLC | 23.298 | 5,46 | 1 | 0,00 | ||||
| 2026-04-14 | 13F | Heirloom Wealth Management | 8.197 | 406 | ||||||
| 2026-02-13 | 13F | MorganRosel Wealth Management, LLC | 14.658 | 1,24 | 718 | 3,91 | ||||
| 2026-01-26 | 13F | Cwm, Llc | 8.506 | 22,69 | 0 | |||||
| 2026-01-29 | 13F | Riggs Asset Managment Co. Inc. | 8.265 | 0,00 | 405 | 2,54 | ||||
| 2026-02-17 | 13F | Susquehanna International Group, Llp | 41.740 | 2.045 | ||||||
| 2026-02-17 | 13F | Advisor Group Holdings, Inc. | 43.778 | 14,94 | 2.144 | 21,42 | ||||
| 2026-02-11 | 13F | O'shaughnessy Asset Management, Llc | 8.482 | -44,89 | 415 | -43,38 | ||||
| 2026-04-21 | 13F | Axiom Financial Strategies, LLC | 399.835 | 71,85 | 19.800 | 73,74 | ||||
| 2026-04-21 | 13F | Trueblood Wealth Management, LLC | 19.502 | -5,27 | 966 | -4,27 | ||||
| 2026-04-20 | 13F | Kestra Private Wealth Services, Llc | 43.486 | 2.153 | ||||||
| 2026-02-10 | 13F | Bnp Paribas Arbitrage, Sa | 7.477 | 0,00 | 366 | 2,81 | ||||
| 2026-02-18 | 13F | Garton & Associates Financial Advisors LLC | 836 | 41 | ||||||
| 2026-01-28 | 13F | Geneos Wealth Management Inc. | 3.895 | 728,72 | 191 | 763,64 | ||||
| 2026-02-13 | 13F | Kestra Advisory Services, LLC | 1.982 | 97 | ||||||
| 2026-01-21 | 13F | Capital Investment Advisory Services, LLC | 5.418 | 0,00 | 265 | 2,71 | ||||
| 2026-02-17 | 13F | Quantinno Capital Management LP | 11.354 | 556 | ||||||
| 2026-02-02 | 13F | Del-Sette Capital Management, LLC | 80.991 | 0,77 | 3.967 | 3,55 | ||||
| 2026-04-06 | 13F | Private Client Services, Llc | 4.950 | 0,00 | 245 | 1,24 | ||||
| 2026-02-03 | 13F | International Assets Investment Management, Llc | 294 | 14 | ||||||
| 2026-04-14 | 13F | Prospera Financial Services Inc | 91.519 | 125,30 | 4.532 | 127,80 | ||||
| 2026-02-18 | 13F | GWM Advisors LLC | 29.159 | 11,52 | 1.428 | 14,61 | ||||
| 2026-01-14 | 13F | Spire Wealth Management | 1.637 | -4,66 | 80 | -1,23 | ||||
| 2026-01-27 | 13F | PFG Advisors | 31.625 | 1.549 | ||||||
| 2026-02-04 | 13F | Bensler, LLC | 5.502 | 13,56 | 270 | 16,96 | ||||
| 2026-02-10 | 13F | Thoroughbred Financial Services, Llc | 5.864 | 36,06 | 0 | |||||
| 2026-04-10 | 13F | Affinity Wealth Management Llc | 844.684 | 41.829 | ||||||
| 2026-02-17 | 13F | Wiley Bros.-aintree Capital, Llc | 40.116 | 277,03 | 1.965 | 287,38 | ||||
| 2026-04-07 | 13F | Farther Finance Advisors, LLC | 8.746 | 168,45 | 447 | 180,50 | ||||
| 2026-02-13 | 13F | Gts Securities Llc | 36.309 | 1.779 | ||||||
| 2026-01-15 | 13F | Private Advisory Group LLC | 8.875 | 7,86 | 435 | 10,71 | ||||
| 2026-01-26 | 13F | AE Wealth Management LLC | 367 | -4,92 | 18 | -5,56 | ||||
| 2026-02-04 | 13F | Ameritas Advisory Services, LLC | 0 | -100,00 | 0 | |||||
| 2026-02-17 | 13F | NewSquare Capital LLC | 64.307 | -35,82 | 3.150 | -34,07 | ||||
| 2026-02-13 | 13F | Greenline Wealth Management LLC | 33.143 | 1.623 | ||||||
| 2026-04-21 | 13F | Systelligence, LLC | 335.145 | -9,21 | 16.596 | -8,21 | ||||
| 2026-02-17 | 13F | Glenmede Trust Co Na | 476 | 0,00 | 23 | 27,78 | ||||
| 2026-04-08 | 13F | Wealth Enhancement Trust Services, Inc. | 1.306 | -34,27 | 65 | -34,02 | ||||
| 2026-02-02 | 13F | Benjamin Edwards Inc | 5.158 | 0,39 | 253 | 2,86 | ||||
| 2026-02-17 | 13F | Blueprint Investment Partners LLC | 33.787 | 8,46 | 1.655 | 11,38 | ||||
| 2026-01-29 | 13F | Ashton Thomas Private Wealth, LLC | 0 | -100,00 | 0 | |||||
| 2026-02-13 | 13F | Navis Wealth Advisors, LLC | 11.652 | 571 | ||||||
| 2026-02-12 | 13F | Steward Partners Investment Advisory, Llc | 3.538 | 6,69 | 173 | 9,49 | ||||
| 2025-10-31 | 13F | NWF Advisory Services Inc. | 0 | -100,00 | 0 | |||||
| 2025-11-13 | 13F | Glenmede Investment Management, LP | 476 | 0,00 | 23 | 4,76 | ||||
| 2026-02-17 | 13F | Raymond James Financial Inc | 265.010 | 1,20 | 12.981 | 3,97 | ||||
| 2026-04-16 | 13F | Redstone Wealth Management, Llc | 64.576 | 3.198 | ||||||
| 2026-04-13 | 13F | Creative Financial Designs Inc /adv | 342.692 | 0,46 | 16.970 | 1,56 | ||||
| 2026-02-11 | 13F | Jpmorgan Chase & Co | 31.855 | 1,87 | 1.560 | 4,70 | ||||
| 2026-02-11 | 13F | LPL Financial LLC | 620.114 | 29,14 | 30.375 | 32,68 | ||||
| 2026-02-17 | 13F | Qube Research & Technologies Ltd | 91 | 0,00 | 4 | 0,00 | ||||
| 2026-02-11 | 13F | Flagship Wealth Advisors, Llc | 2.500 | 122 | ||||||
| 2026-01-16 | 13F | Formidable Asset Management, LLC | 8.165 | 389 | ||||||
| 2025-10-30 | 13F | Twin Peaks Wealth Advisors, LLC | 0 | -100,00 | 0 | |||||
| 2026-04-09 | 13F | DHJJ Financial Advisors, Ltd. | 1.564 | 0,00 | 77 | 1,32 | ||||
| 2026-01-22 | 13F | Apollon Wealth Management, LLC | 5.379 | 0,00 | 263 | 2,73 | ||||
| 2026-01-27 | 13F | Financial Management Professionals, Inc. | 0 | -100,00 | 0 | |||||
| 2026-02-12 | 13F | Jane Street Group, Llc | 5.887 | -69,39 | 288 | -68,56 | ||||
| 2026-02-06 | 13F | IFP Advisors, Inc | 0 | -100,00 | 0 | -100,00 | ||||
| 2026-02-17 | 13F | Blair William & Co/il | 600 | -29,41 | 29 | -27,50 | ||||
| 2026-02-17 | 13F | Equitable Holdings, Inc. | 54.203 | 4,46 | 2.655 | 7,36 | ||||
| 2026-02-05 | 13F | Cambridge Investment Research Advisors, Inc. | 43.651 | 14,34 | 2 | 100,00 | ||||
| 2026-01-20 | 13F | Coastal Investment Advisors, Inc. | 40 | 2 | ||||||
| 2026-01-29 | 13F | Sanctuary Advisors, LLC | 16.716 | 60,95 | 819 | 65,25 | ||||
| 2026-02-13 | 13F | Blueprint Financial Advisors LLC | 33.787 | 8,46 | 1.655 | 11,38 | ||||
| 2026-02-10 | 13F | Envestnet Asset Management Inc | 208.940 | 293,80 | 10.234 | 304,67 |