Grundlæggende statistik
| Institutionelle ejere | 107 total, 107 long only, 0 short only, 0 long/short - change of 0,94% MRQ |
| Gennemsnitlig porteføljeallokering | 0.3959 % - change of 4,06% MRQ |
| Institutionelle aktier (lange) | 13.986.745 (ex 13D/G) - change of 3,17MM shares 29,80% MRQ |
| Institutionel værdi (lang) | $ 468.463 USD ($1000) |
Institutionelt ejerskab og aktionærer
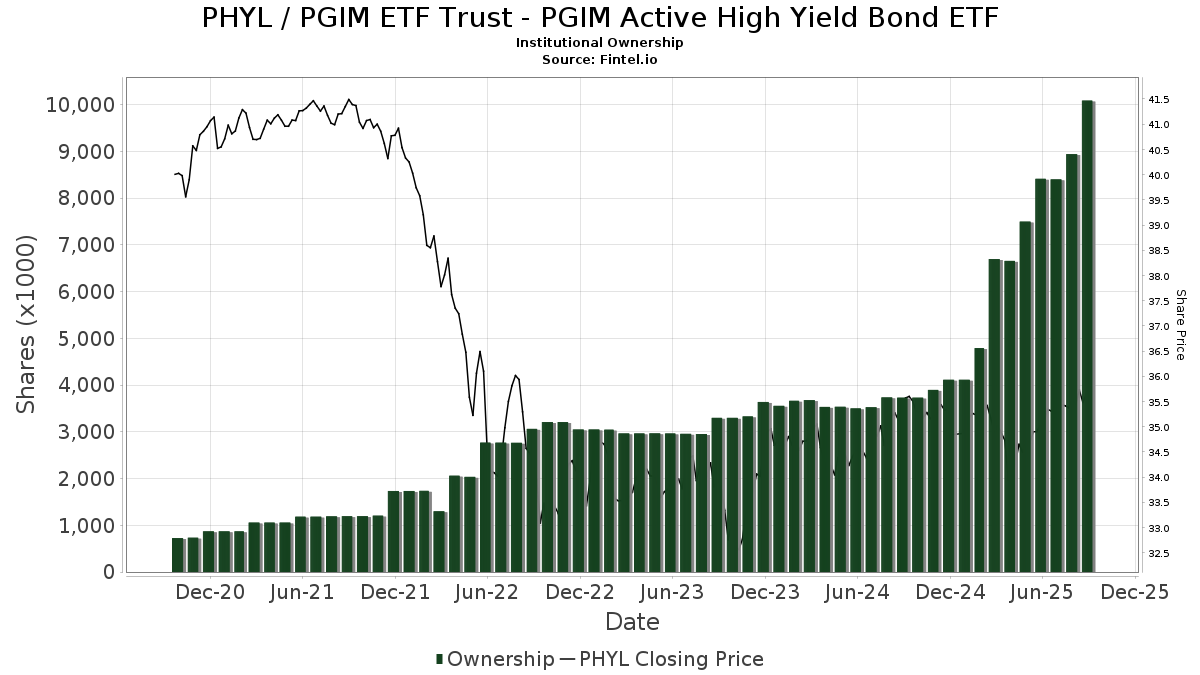
PGIM ETF Trust - PGIM Active High Yield Bond ETF (US:PHYL) har 107 institutionelle ejere og aktionærer, der har indsendt 13D/G- eller 13F-formularer til Securities Exchange Commission (SEC). Disse institutioner har i alt 13,986,745 aktier. Største aktionærer omfatter Prudential Financial Inc, State of New Jersey Common Pension Fund D, Envestnet Asset Management Inc, PCLRX - PGIM INCOME BUILDER FUND Class R, Pnc Financial Services Group, Inc., Thrivent Financial For Lutherans, LPL Financial LLC, Inspire Advisors, LLC, Jpmorgan Chase & Co, and Royal Bank Of Canada .
PGIM ETF Trust - PGIM Active High Yield Bond ETF (ARCA:PHYL) institutionel ejerskabsstruktur viser aktuelle positioner i virksomheden efter institutioner og fonde, samt seneste ændringer i positionsstørrelse. Større aktionærer kan omfatte individuelle investorer, investeringsforeninger, hedgefonde eller institutioner. Skema 13D angiver, at investoren besidder (eller besidder) mere end 5 % af virksomheden og har til hensigt (eller har til hensigt at) aktivt at forfølge en ændring i forretningsstrategi. Skema 13G indikerer en passiv investering på over 5%.
The share price as of February 9, 2026 is 35,59 / share. Previously, on February 10, 2025, the share price was 35,16 / share. This represents an increase of 1,24% over that period.
Fondens stemningsscore
Fund Sentiment Score (fka Ownership Accumulation Score) finder de aktier, der bliver mest købt af fonde. Det er resultatet af en sofistikeret, multi-faktor kvantitativ model, der identificerer virksomheder med de højeste niveauer af institutionel akkumulering. Scoringsmodellen bruger en kombination af den samlede stigning i oplyste ejere, ændringerne i porteføljeallokeringer i disse ejere og andre målinger. Tallet går fra 0 til 100, hvor højere tal indikerer et højere niveau af akkumulering for sine jævnaldrende, og 50 er gennemsnittet.
Opdateringsfrekvens: Dagligt
Se Ownership Explorer, som giver en liste over højest rangerende virksomheder.
AI+ Ask Fintel’s AI assistant about PGIM ETF Trust - PGIM Active High Yield Bond ETF.
Select a question to share a public post with an AI-crafted answer.
Thinking of good questions…
Institutionel Put/Call-forhold
Ud over at indberette standardaktie- og gældsudstedelser skal institutter med mere end 100 mill. aktiver under forvaltning også oplyse deres put- og call-optionsbeholdninger. Da salgsoptioner generelt indikerer negativ stemning, og købsoptioner indikerer positiv stemning, kan vi få en fornemmelse af den overordnede institutionelle stemning ved at plotte forholdet mellem put og kald. Diagrammet til højre viser det historiske put/call-forhold for dette instrument.
Brug af Put/Call Ratio som en indikator for investorernes stemning overvinder en af de vigtigste mangler ved at bruge totalt institutionelt ejerskab, som er, at en betydelig mængde af aktiver under forvaltning investeres passivt for at spore indekser. Passivt forvaltede fonde køber typisk ikke optioner, så indikatoren for put/call-forholdet følger mere nøje følelsen af aktivt forvaltede fonde.
13F og NPORT arkivering
Detaljer om 13F-arkivering er gratis. Detaljer om NP-ansøgninger kræver et premium-medlemskab. Grønne rækker angiver nye positioner. Røde rækker angiver lukkede positioner. Klik på linket ikon for at se den fulde transaktionshistorik.
Opgrader
for at låse premium-data op og eksportere til Excel ![]() .
.
| Fil dato | Kilde | Investor | Type | Gennemsnitlig pris (Øst) |
Aktier | Δ Aktier (%) |
Rapporteret Værdi ($1000) |
Δ Værdi (%) |
Port Alloc (%) |
|
|---|---|---|---|---|---|---|---|---|---|---|
| 2026-02-02 | 13F | Mutual Advisors, LLC | 78.129 | 2.772 | ||||||
| 2026-01-29 | 13F | Veracity Capital LLC | 13.982 | 96,74 | 496 | 95,28 | ||||
| 2025-10-22 | 13F | Advisory Resource Group | 132.647 | 8,00 | 4.742 | 8,81 | ||||
| 2026-01-30 | 13F | State of New Jersey Common Pension Fund D | 1.725.000 | 64,29 | 61.203 | 63,05 | ||||
| 2026-01-05 | 13F | Foguth Wealth Management, LLC. | 170.817 | 6,10 | 6.062 | 6,11 | ||||
| 2026-01-20 | 13F | Stratos Wealth Partners, LTD. | 110.594 | 9,61 | 3.924 | 8,76 | ||||
| 2025-11-14 | 13F | Kestra Advisory Services, LLC | 6.526 | 233 | ||||||
| 2026-01-29 | 13F | Golden State Equity Partners | 19.776 | 702 | ||||||
| 2025-11-05 | 13F | Smartleaf Asset Management LLC | 7.770 | 974,69 | 278 | 1.008,00 | ||||
| 2026-01-30 | 13F | Strategic Blueprint, LLC | 23.287 | 0,27 | 826 | -0,48 | ||||
| 2025-11-12 | 13F | Aptus Capital Advisors, LLC | 28 | 0,00 | 1 | |||||
| 2026-01-23 | 13F | Nbt Bank N A /ny | 35 | -2,78 | 1 | 0,00 | ||||
| 2025-11-14 | 13F | Capital Analysts, Inc. | 209.742 | 641,27 | 7 | 600,00 | ||||
| 2026-01-20 | 13F | Mendota Financial Group, LLC | 8.970 | 91,83 | 318 | 90,42 | ||||
| 2026-01-26 | 13F | AE Wealth Management LLC | 0 | -100,00 | 0 | |||||
| 2026-01-29 | 13F | Ashton Thomas Private Wealth, LLC | 0 | -100,00 | 0 | |||||
| 2025-11-05 | 13F | J.w. Cole Advisors, Inc. | 35.382 | 31,76 | 1.265 | 32,63 | ||||
| 2026-02-06 | 13F | Pnc Financial Services Group, Inc. | 564.884 | 50,16 | 20.042 | 49,02 | ||||
| 2026-01-23 | 13F | Stephenson National Bank & Trust | 0 | -100,00 | 0 | |||||
| 2026-02-06 | 13F | Envestnet Portfolio Solutions, Inc. | 11.507 | 408 | ||||||
| 2025-10-27 | 13F | Hoxton Planning & Management, LLC | 22.287 | -5,13 | 797 | -4,44 | ||||
| 2026-01-12 | 13F | Ffg Retirement Advisors Llc | 31.842 | -0,44 | 1.130 | -1,22 | ||||
| 2026-01-14 | 13F | Petros Family Wealth, LLC | 18.625 | 661 | ||||||
| 2026-01-26 | 13F | United Advisor Group, LLC | 26.175 | 9,92 | 929 | 9,05 | ||||
| 2026-01-23 | 13F | RFG - Bristol Wealth Advisors, LLC | 51.026 | 5,61 | 1.810 | 4,81 | ||||
| 2026-01-16 | 13F | Morris Retirement Advisors, LLC | 35.125 | 1.246 | ||||||
| 2025-11-13 | 13F | Wells Fargo & Company/mn | 245.746 | 23,18 | 8.785 | 24,08 | ||||
| 2025-11-14 | 13F | Morgan Stanley | 3.883 | 134,91 | 139 | 137,93 | ||||
| 2025-11-12 | 13F | JT Stratford LLC | 16.600 | 593 | ||||||
| 2026-01-26 | 13F | Cwm, Llc | 360 | -57,45 | 0 | |||||
| 2026-02-03 | 13F | RFG Advisory, LLC | 223.177 | 145,14 | 7.918 | 143,33 | ||||
| 2025-11-14 | 13F | Equitable Holdings, Inc. | 50.979 | 9,06 | 1.822 | 9,89 | ||||
| 2025-11-13 | 13F | Private Advisor Group, LLC | 8.852 | 316 | ||||||
| 2026-02-06 | 13F | Creative Financial Designs Inc /adv | 1.537 | -17,32 | 55 | -18,18 | ||||
| 2025-11-12 | 13F | Claro Advisors LLC | 17.487 | 5,58 | 625 | 6,47 | ||||
| 2025-08-12 | 13F | Proequities, Inc. | 0 | 0 | ||||||
| 2025-11-12 | 13F | Stifel Financial Corp | 65.285 | 6,33 | 2.334 | 7,07 | ||||
| 2025-11-04 | 13F | Jones Financial Companies Lllp | 75.626 | 130,32 | 2.701 | 132,24 | ||||
| 2025-11-13 | 13F | Prudential Financial Inc | 3.568.139 | 88,19 | 127.561 | 91,37 | ||||
| 2025-09-25 | NP | PCLRX - PGIM INCOME BUILDER FUND Class R | 660.204 | -6,28 | 23.411 | -4,09 | ||||
| 2025-11-14 | 13F | Royal Bank Of Canada | 275.890 | 1.416,21 | 9.863 | 1.424,42 | ||||
| 2026-02-06 | 13F | Global Retirement Partners, LLC | 4.497 | 7,28 | 160 | 6,71 | ||||
| 2025-11-14 | 13F | Hilltop Holdings Inc. | 9.552 | 0,76 | 341 | 1,49 | ||||
| 2025-11-14 | 13F | Adams Wealth Management | 147.771 | -0,68 | 5.283 | 0,04 | ||||
| 2025-08-27 | NP | PGFEX - PGIM Enhanced Retirement Spending Fund Class R6 | 4.826 | 4,80 | 171 | 6,88 | ||||
| 2026-02-05 | 13F | Hicks Capital Management Llc | 16.896 | 41,15 | 599 | 40,28 | ||||
| 2026-01-14 | 13F | InTrack Investment Management Inc | 37.520 | 29,12 | 1.331 | 28,23 | ||||
| 2026-02-09 | 13F | Financial Advisory Corp /ut/ /adv | 39.984 | 28,24 | 1 | 0,00 | ||||
| 2026-02-10 | 13F | Envestnet Asset Management Inc | 1.064.477 | 18,01 | 37.768 | 17,12 | ||||
| 2026-01-06 | 13F | Freedom Financial Partners LLC | 29.686 | 5,28 | 1.053 | 4,46 | ||||
| 2026-02-02 | 13F | One Wealth Advisors, LLC | 0 | -100,00 | 0 | |||||
| 2026-01-26 | 13F | Private Trust Co Na | 6.667 | 9,01 | 237 | 8,26 | ||||
| 2026-02-06 | 13F | EverSource Wealth Advisors, LLC | 90 | -1,10 | 3 | 0,00 | ||||
| 2025-11-17 | 13F | CacheTech Inc. | 157.689 | 5,99 | 5.637 | 6,76 | ||||
| 2025-11-26 | 13F/A | Jpmorgan Chase & Co | 314.520 | 1,78 | 11.244 | 2,53 | ||||
| 2025-11-14 | 13F | Garden State Investment Advisory Services LLC | 9.110 | -4,85 | 326 | -4,13 | ||||
| 2025-10-29 | 13F | American Alpha Advisors, LLC | 148.832 | 2,85 | 5.321 | 3,60 | ||||
| 2025-11-12 | 13F | BlackRock, Inc. | 147 | 3,52 | 5 | 0,00 | ||||
| 2025-11-10 | 13F | Resources Investment Advisors, LLC. | 107.175 | 113,38 | 3.831 | 114,98 | ||||
| 2025-11-14 | 13F | Anchor Investment Management, LLC | 3.045 | 20,74 | 109 | 21,35 | ||||
| 2025-11-14 | 13F | Hughes Financial Services, LLC | 509 | -54,19 | 18 | -53,85 | ||||
| 2026-01-27 | 13F/A | Capital Performance Advisors Llp | 86.113 | 31,53 | 3.055 | 30,56 | ||||
| 2026-02-06 | 13F | Vestmark Advisory Solutions, Inc. | 219.727 | -13,77 | 7.796 | -14,43 | ||||
| 2026-02-09 | 13F | Harbour Investments, Inc. | 381 | -80,50 | 14 | -81,16 | ||||
| 2026-01-12 | 13F | PFW Advisors LLC | 132.465 | 0,48 | 4.700 | -0,28 | ||||
| 2026-01-27 | 13F | PFG Advisors | 0 | -100,00 | 0 | |||||
| 2025-10-27 | 13F | Financial Network Wealth Advisors LLC | 1.677 | 2,13 | 60 | 1,72 | ||||
| 2025-08-28 | NP | Northern Lights Fund Trust - Sierra Tactical Bond Fund Investor Class Shares | 128.300 | -65,12 | 4.553 | -64,45 | ||||
| 2026-02-02 | 13F | Montag A & Associates Inc | 0 | -100,00 | 0 | |||||
| 2025-11-25 | 13F | Alexander Labrunerie & Co., Inc. | 9.296 | -0,30 | 332 | 0,61 | ||||
| 2025-10-08 | 13F | KWB Wealth | 0 | -100,00 | 0 | |||||
| 2026-02-04 | 13F | Bensler, LLC | 6.948 | 9,85 | 247 | 8,85 | ||||
| 2025-11-12 | 13F | Steward Partners Investment Advisory, Llc | 13.470 | 1.931,67 | 482 | 1.991,30 | ||||
| 2025-10-22 | 13F | Commonwealth Equity Services, Llc | 51.738 | 71,23 | 2 | 0,00 | ||||
| 2025-11-19 | 13F | Stance Capital Llc | 1.970 | 70 | ||||||
| 2026-01-15 | 13F | Victory Financial Group, Llc | 25.148 | 78,71 | 892 | 77,34 | ||||
| 2026-02-05 | 13F | Stephens Inc /ar/ | 12.003 | -9,75 | 426 | -10,53 | ||||
| 2025-11-14 | 13F | Raymond James Financial Inc | 71.338 | 46,88 | 2.550 | 48,00 | ||||
| 2026-01-21 | 13F | Sound Income Strategies, LLC | 200 | 0,00 | 7 | 0,00 | ||||
| 2026-01-29 | 13F | Kestra Private Wealth Services, Llc | 9.237 | 328 | ||||||
| 2025-08-12 | 13F | PSI Advisors, LLC | 0 | -100,00 | 0 | |||||
| 2026-02-05 | 13F | Cambridge Investment Research Advisors, Inc. | 102.668 | 4 | ||||||
| 2025-11-14 | 13F | Mml Investors Services, Llc | 248.152 | 8,37 | 8.871 | 110.787,50 | ||||
| 2026-01-28 | 13F | Milestone Asset Management, Llc | 11.402 | -3,06 | 405 | -3,81 | ||||
| 2026-01-23 | 13F | Farther Finance Advisors, LLC | 219 | -17,36 | 8 | -22,22 | ||||
| 2025-11-12 | 13F | LPL Financial LLC | 365.980 | 0,14 | 13.084 | 0,87 | ||||
| 2025-11-14 | 13F | Ameriprise Financial Inc | 51.626 | 1.846 | ||||||
| 2026-01-28 | 13F | Schmidt P J Investment Management Inc | 40.594 | 4,44 | 1.440 | 3,67 | ||||
| 2025-11-14 | 13F | Flow Traders U.s. Llc | 6.790 | -69,24 | 0 | |||||
| 2025-08-27 | NP | PGFCX - PGIM Conservative Retirement Spending Fund Class R6 | 2.994 | 1,42 | 106 | 3,92 | ||||
| 2025-11-14 | 13F | Advisor Group Holdings, Inc. | 49.046 | 6,69 | 1.752 | 7,42 | ||||
| 2026-01-12 | 13F | Sax Wealth Advisors, Llc | 104.016 | 15,79 | 3.690 | 14,92 | ||||
| 2026-01-09 | 13F | Breakwater Capital Group | 115.560 | 73,90 | 4.100 | 72,63 | ||||
| 2026-01-30 | 13F | Ellenbecker Investment Group | 154.374 | 26,92 | 5.477 | 25,97 | ||||
| 2025-08-27 | NP | PGFMX - PGIM Moderate Retirement Spending Fund Class R6 | 3.041 | 1,94 | 108 | 3,88 | ||||
| 2026-01-21 | 13F | MBE Wealth Management, LLC | 20.760 | -1,47 | 737 | -2,26 | ||||
| 2025-11-14 | 13F | Gen-Wealth Partners Inc | 1.861 | -3,32 | 67 | -2,94 | ||||
| 2026-02-05 | 13F | Thrivent Financial For Lutherans | 376.538 | 538,77 | 13 | 550,00 | ||||
| 2025-11-03 | 13F | Townsquare Capital Llc | 0 | -100,00 | 0 | |||||
| 2025-11-12 | 13F | Symphony Financial Services, Inc. | 7.026 | -15,27 | 251 | -14,63 | ||||
| 2026-02-02 | 13F | Truist Financial Corp | 10.360 | 23,17 | 368 | 22,33 | ||||
| 2026-01-12 | 13F | Fjell Capital, LLC | 49.164 | 1,01 | 1.744 | 0,29 | ||||
| 2026-02-09 | 13F | TrustBank | 56.748 | 2.013 | ||||||
| 2026-01-15 | 13F | Wright Fund Managment, LLC | 128.300 | 0,00 | 4.552 | -0,74 | ||||
| 2025-11-13 | 13F | Fmr Llc | 16 | 0,00 | 0 | |||||
| 2026-01-05 | 13F | Park Avenue Securities Llc | 44.760 | 33,27 | 2 | 0,00 | ||||
| 2026-01-20 | 13F | Wall Street Access Asset Management, LLC | 10.891 | 386 | ||||||
| 2026-01-23 | 13F | Gibbs Wealth Management | 45.548 | -6,46 | 1.623 | -6,78 | ||||
| 2025-10-10 | 13F | Signal Advisors Wealth, LLC | 0 | -100,00 | 0 | |||||
| 2025-11-06 | 13F | Integrity Financial Corp /WA | 26.139 | 26,37 | 934 | 27,25 | ||||
| 2026-01-23 | 13F | Fifth Third Securities, Inc. | 132.918 | 17,35 | 4.716 | 16,45 | ||||
| 2025-11-10 | 13F | Alerus Financial Na | 6 | 0,00 | 0 | |||||
| 2026-01-26 | 13F | Austin Wealth Management, LLC | 12.780 | -17,00 | 455 | -17,00 | ||||
| 2025-08-15 | 13F | Semmax Financial Advisors Inc. | 302 | -19,03 | 11 | -16,67 | ||||
| 2026-02-09 | 13F | Integrity Alliance, Llc. | 0 | -100,00 | 0 | |||||
| 2026-01-06 | 13F | First Citizens Financial Corp | 51.036 | 10,20 | 1.811 | 9,37 | ||||
| 2025-10-29 | 13F | Inspire Advisors, LLC | 320.648 | 13,09 | 11.463 | 13,92 | ||||
| 2025-11-13 | 13F | UBS Group AG | 0 | -100,00 | 0 | |||||
| 2025-11-14 | 13F | Jane Street Group, Llc | 0 | -100,00 | 0 | |||||
| 2026-02-09 | 13F | Connecticut Capital Management Group, LLC | 33.980 | 1.206 | ||||||
| 2026-01-14 | 13F | Redhawk Wealth Advisors, Inc. | 0 | -100,00 | 0 | |||||
| 2025-11-12 | 13F | Armis Advisers, LLC | 9.577 | 26,93 | 338 | 27,17 |