Grundlæggende statistik
| Institutionelle ejere | 205 total, 205 long only, 0 short only, 0 long/short - change of 0,49% MRQ |
| Gennemsnitlig porteføljeallokering | 0.0787 % - change of -35,74% MRQ |
| Institutionelle aktier (lange) | 43.211.725 (ex 13D/G) - change of 3,40MM shares 8,53% MRQ |
| Institutionel værdi (lang) | $ 925.583 USD ($1000) |
Institutionelt ejerskab og aktionærer
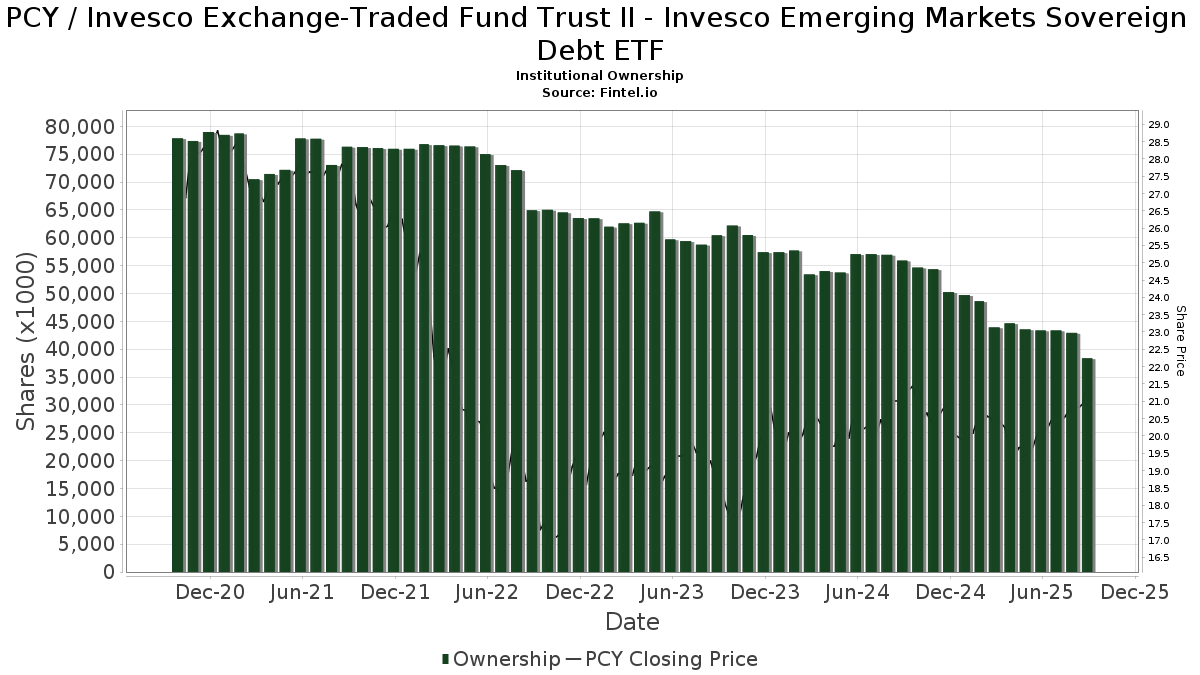
Invesco Exchange-Traded Fund Trust II - Invesco Emerging Markets Sovereign Debt ETF (US:PCY) har 205 institutionelle ejere og aktionærer, der har indsendt 13D/G- eller 13F-formularer til Securities Exchange Commission (SEC). Disse institutioner har i alt 43,211,725 aktier. Største aktionærer omfatter Bank Of America Corp /de/, Annex Advisory Services, LLC, Invesco Ltd., Wells Fargo & Company/mn, Syon Capital Llc, LPL Financial LLC, UBS Group AG, Raymond James Financial Inc, Morgan Stanley, and Vontobel Holding Ltd. .
Invesco Exchange-Traded Fund Trust II - Invesco Emerging Markets Sovereign Debt ETF (ARCA:PCY) institutionel ejerskabsstruktur viser aktuelle positioner i virksomheden efter institutioner og fonde, samt seneste ændringer i positionsstørrelse. Større aktionærer kan omfatte individuelle investorer, investeringsforeninger, hedgefonde eller institutioner. Skema 13D angiver, at investoren besidder (eller besidder) mere end 5 % af virksomheden og har til hensigt (eller har til hensigt at) aktivt at forfølge en ændring i forretningsstrategi. Skema 13G indikerer en passiv investering på over 5%.
The share price as of April 24, 2026 is 21,59 / share. Previously, on April 28, 2025, the share price was 19,87 / share. This represents an increase of 8,66% over that period.
Fondens stemningsscore
Fund Sentiment Score (fka Ownership Accumulation Score) finder de aktier, der bliver mest købt af fonde. Det er resultatet af en sofistikeret, multi-faktor kvantitativ model, der identificerer virksomheder med de højeste niveauer af institutionel akkumulering. Scoringsmodellen bruger en kombination af den samlede stigning i oplyste ejere, ændringerne i porteføljeallokeringer i disse ejere og andre målinger. Tallet går fra 0 til 100, hvor højere tal indikerer et højere niveau af akkumulering for sine jævnaldrende, og 50 er gennemsnittet.
Opdateringsfrekvens: Dagligt
Se Ownership Explorer, som giver en liste over højest rangerende virksomheder.
AI+ Ask Fintel’s AI assistant about Invesco Exchange-Traded Fund Trust II - Invesco Emerging Markets Sovereign Debt ETF.
Select a question to share a public post with an AI-crafted answer.
Thinking of good questions…
Institutionel Put/Call-forhold
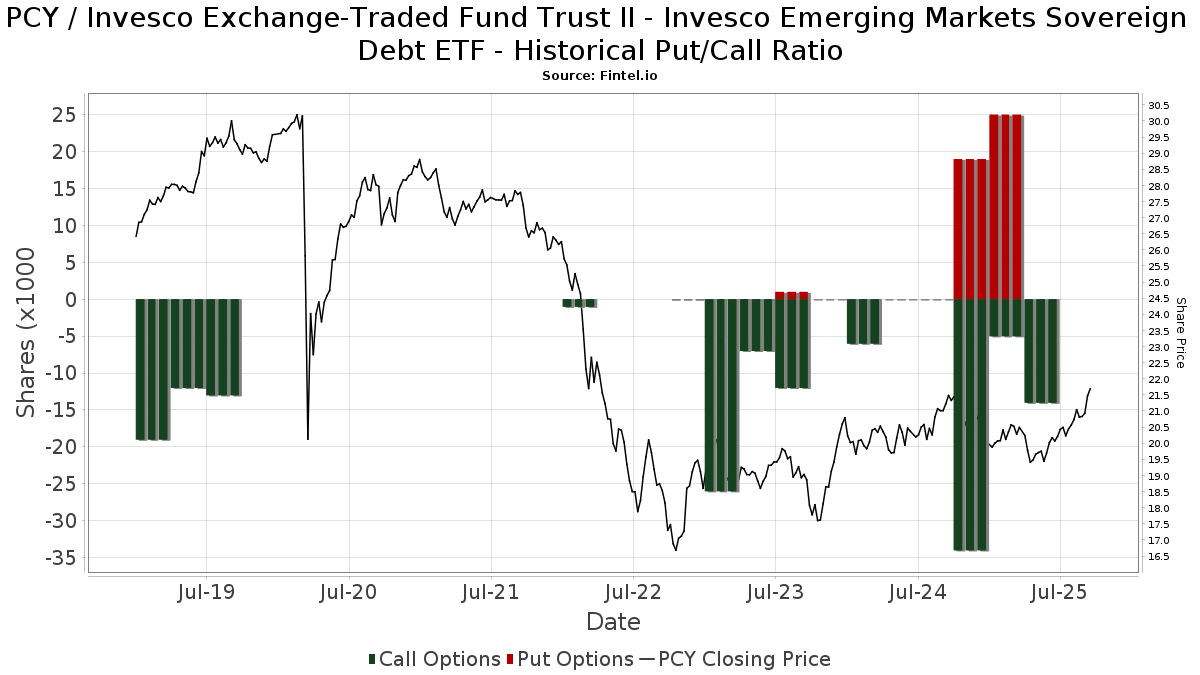
Ud over at indberette standardaktie- og gældsudstedelser skal institutter med mere end 100 mill. aktiver under forvaltning også oplyse deres put- og call-optionsbeholdninger. Da salgsoptioner generelt indikerer negativ stemning, og købsoptioner indikerer positiv stemning, kan vi få en fornemmelse af den overordnede institutionelle stemning ved at plotte forholdet mellem put og kald. Diagrammet til højre viser det historiske put/call-forhold for dette instrument.
Brug af Put/Call Ratio som en indikator for investorernes stemning overvinder en af de vigtigste mangler ved at bruge totalt institutionelt ejerskab, som er, at en betydelig mængde af aktiver under forvaltning investeres passivt for at spore indekser. Passivt forvaltede fonde køber typisk ikke optioner, så indikatoren for put/call-forholdet følger mere nøje følelsen af aktivt forvaltede fonde.
13F og NPORT arkivering
Detaljer om 13F-arkivering er gratis. Detaljer om NP-ansøgninger kræver et premium-medlemskab. Grønne rækker angiver nye positioner. Røde rækker angiver lukkede positioner. Klik på linket ikon for at se den fulde transaktionshistorik.
Opgrader
for at låse premium-data op og eksportere til Excel ![]() .
.
| Fil dato | Kilde | Investor | Type | Gennemsnitlig pris (Øst) |
Aktier | Δ Aktier (%) |
Rapporteret Værdi ($1000) |
Δ Værdi (%) |
Port Alloc (%) |
|
|---|---|---|---|---|---|---|---|---|---|---|
| 2026-02-09 | 13F | Endowment Wealth Management, Inc. | 62.248 | -2,77 | 1.348 | -2,32 | ||||
| 2026-02-17 | 13F | Cape Investment Advisory, Inc. | 1.140 | 25 | ||||||
| 2026-02-17 | 13F | Mercer Global Advisors Inc /adv | 10.852 | 5,54 | 235 | 6,33 | ||||
| 2026-01-28 | 13F | Geneos Wealth Management Inc. | 2.719 | 0,52 | 59 | 0,00 | ||||
| 2026-02-17 | 13F | Royal Bank Of Canada | 83.075 | 19,04 | 1.798 | 19,47 | ||||
| 2026-02-17 | 13F | D. E. Shaw & Co., Inc. | 0 | -100,00 | 0 | |||||
| 2026-03-23 | 13F/A | Barclays Plc | 0 | -100,00 | 0 | |||||
| 2026-04-07 | 13F | CoreCap Advisors, LLC | 1.389 | -81,35 | 29 | -81,99 | ||||
| 2026-01-27 | 13F | Evergreen Capital Management Llc | 273.689 | -3,64 | 5.928 | -3,18 | ||||
| 2026-02-12 | 13F | Betterment LLC | 70.287 | -30,86 | 2 | -50,00 | ||||
| 2026-02-17 | 13F | WFA of San Diego, LLC | 0 | -100,00 | 0 | |||||
| 2026-02-09 | 13F | Delta Asset Management Llc/tn | 598 | 0,00 | 13 | 0,00 | ||||
| 2026-02-13 | 13F | National Bank Of Canada /fi/ | 110.206 | -2,86 | 2.387 | -2,05 | ||||
| 2025-11-14 | 13F/A | NorthRock Partners, LLC | 0 | -100,00 | 0 | |||||
| 2026-04-20 | 13F | Kestra Private Wealth Services, Llc | 9.985 | -13,77 | 209 | -16,80 | ||||
| 2026-04-22 | 13F | Coastal Investment Advisors, Inc. | 1.301 | -9,08 | 27 | -10,00 | ||||
| 2026-02-17 | 13F | Advisory Services Network, LLC | 16.844 | -11,40 | 365 | -11,00 | ||||
| 2026-02-04 | 13F | Colonial River Wealth Management, LLC | 18.519 | 7,65 | 401 | 8,38 | ||||
| 2026-02-05 | 13F | Center for Financial Planning, Inc. | 17 | 0,00 | 0 | |||||
| 2026-01-23 | 13F | Assetmark, Inc | 139 | 90,41 | 3 | 200,00 | ||||
| 2026-02-13 | 13F | Citigroup Inc | 207 | -99,94 | 4 | -99,94 | ||||
| 2026-01-29 | 13F | Concord Wealth Partners | 2.524 | 0,00 | 55 | 0,00 | ||||
| 2026-02-12 | 13F | Wealthspire Advisors, LLC | 22.723 | -4,30 | 492 | -3,72 | ||||
| 2026-02-09 | 13F | Integrity Alliance, Llc. | 0 | -100,00 | 0 | |||||
| 2026-02-17 | 13F | Jones Financial Companies Lllp | 43.389 | 53,00 | 940 | 54,44 | ||||
| 2026-01-28 | 13F | Omega Financial Group, LLC | 88.399 | -2,10 | 1.915 | -1,64 | ||||
| 2026-04-17 | 13F | Murphy & Mullick Capital Management Corp | 7.240 | -0,84 | 151 | -4,43 | ||||
| 2026-02-13 | 13F | Kestra Advisory Services, LLC | 0 | -100,00 | 0 | |||||
| 2025-10-28 | 13F | Wolverine Asset Management Llc | 0 | -100,00 | 0 | |||||
| 2026-02-02 | 13F | Fifth Third Bancorp | 71.015 | -0,58 | 1.538 | -0,06 | ||||
| 2025-11-13 | 13F | Parallel Advisors, LLC | 0 | -100,00 | 0 | |||||
| 2026-02-06 | 13F | Axxcess Wealth Management, Llc | 18.629 | 8,37 | 403 | 8,92 | ||||
| 2026-04-17 | 13F | Worth Asset Management, LLC | 11.909 | -2,90 | 249 | -6,42 | ||||
| 2026-04-20 | 13F | City State Bank | 10.250 | 0,00 | 214 | -3,60 | ||||
| 2026-02-13 | 13F | Vontobel Holding Ltd. | 371.321 | -0,48 | 8.043 | -0,01 | ||||
| 2026-04-20 | 13F | RiverTree Advisors, LLC | 68.855 | 103,30 | 1.439 | 96,32 | ||||
| 2026-02-12 | 13F | BlackRock, Inc. | 343.653 | 7.444 | ||||||
| 2026-02-17 | 13F | IHT Wealth Management, LLC | 11.334 | 5,40 | 245 | 6,06 | ||||
| 2026-04-17 | 13F | Signal Advisors Wealth, LLC | 27.853 | -14,79 | 582 | -17,80 | ||||
| 2026-02-12 | 13F | Proficio Capital Partners LLC | 68.585 | 1.486 | ||||||
| 2026-02-12 | 13F | CIBC Private Wealth Group, LLC | 4.850 | 0,00 | 105 | 0,96 | ||||
| 2025-11-06 | 13F | Ameritas Advisory Services, LLC | 0 | -100,00 | 0 | -100,00 | ||||
| 2026-04-08 | 13F | Sharper & Granite LLC | 95.160 | -3,21 | 1.989 | -6,62 | ||||
| 2026-03-12 | 13F | Vericrest Private Wealth | 0 | -100,00 | 0 | |||||
| 2026-02-17 | 13F | Ameriprise Financial Inc | 325.633 | 3,01 | 7.050 | 3,46 | ||||
| 2026-02-06 | 13F | SGL Investment Advisors, Inc. | 19.880 | 22,75 | 430 | 21,81 | ||||
| 2026-01-14 | 13F | Net Worth Advisory Group | 29.066 | 5,37 | 630 | 5,89 | ||||
| 2026-02-06 | 13F | Wilian Securities, LLC | 31.243 | 677 | ||||||
| 2026-02-13 | 13F | MAI Capital Management | 10.852 | -3,15 | 235 | -2,49 | ||||
| 2026-01-26 | 13F | Keystone Wealth Services, LLC | 19.502 | 422 | ||||||
| 2026-04-13 | 13F | Creative Financial Designs Inc /adv | 90 | 0,00 | 2 | 0,00 | ||||
| 2026-02-09 | 13F | Clear Investment Research, Llc | 0 | -100,00 | 0 | |||||
| 2026-04-07 | 13F | Estate Planners Group, LLC | 31 | 1 | ||||||
| 2025-12-16 | 13F | Emergent Wealth Advisors, LLC | 0 | -100,00 | 0 | -100,00 | ||||
| 2026-02-18 | 13F | First Citizens Bank & Trust Co | 10.500 | 227 | ||||||
| 2026-02-04 | 13F | MONECO Advisors, LLC | 136.931 | 4,07 | 2.966 | 4,55 | ||||
| 2026-02-17 | 13F | Quantinno Capital Management LP | 21.792 | -1,11 | 472 | -0,63 | ||||
| 2026-04-20 | 13F | Friedenthal Financial | 10.128 | 0,98 | 212 | -2,76 | ||||
| 2026-02-09 | 13F | Huntington National Bank | 14 | 16,67 | ||||||
| 2026-02-17 | 13F | Bank Of America Corp /de/ | 22.595.203 | 2,09 | 489.412 | 2,57 | ||||
| 2026-02-13 | 13F | Smartleaf Asset Management LLC | 410 | -58,54 | 9 | -61,90 | ||||
| 2026-04-16 | 13F | First Community Trust Na | 217 | -56,60 | 5 | -60,00 | ||||
| 2026-02-09 | 13F | Harbour Investments, Inc. | 414 | -1,19 | 9 | -11,11 | ||||
| 2025-11-12 | 13F | Us Bancorp \de\ | 0 | -100,00 | 0 | |||||
| 2026-02-17 | 13F | Evergreen Wealth Solutions, LLC | 172.922 | 3.745 | ||||||
| 2025-11-12 | 13F | Ameriflex Group, Inc. | 0 | -100,00 | 0 | |||||
| 2026-02-11 | 13F | O'shaughnessy Asset Management, Llc | 332 | 0,00 | 7 | 0,00 | ||||
| 2026-01-27 | 13F | Duncker Streett & Co Inc | 14.750 | 0,00 | 319 | 0,31 | ||||
| 2026-02-02 | 13F | Advisors Preferred, LLC | 123.309 | -37,59 | 2.675 | -37,45 | ||||
| 2026-02-06 | 13F | HighTower Advisors, LLC | 41.336 | 895 | ||||||
| 2026-04-07 | 13F | Signaturefd, Llc | 38 | 1 | ||||||
| 2026-04-21 | 13F | OneAscent Financial Services LLC | 29.708 | 621 | ||||||
| 2026-02-17 | 13F | National Asset Management, Inc. | 26.872 | -2,72 | 582 | -2,18 | ||||
| 2026-01-21 | 13F | Towercrest Capital Management | 241.373 | -11,04 | 5.228 | -10,63 | ||||
| 2026-01-27 | 13F | Probity Advisors, Inc. | 82.340 | -0,05 | 1.783 | 0,39 | ||||
| 2026-01-29 | 13F | Sanctuary Advisors, LLC | 35.337 | -1,78 | 765 | -1,29 | ||||
| 2026-04-20 | 13F | Sowell Financial Services LLC | 29.407 | -14,09 | 615 | -17,14 | ||||
| 2026-02-17 | 13F | Risk Paradigm Group, LLC | 12.761 | 276 | ||||||
| 2026-01-21 | 13F | Westfuller Advisors, LLC | 209 | 0,00 | 5 | 0,00 | ||||
| 2026-01-28 | 13F | Salomon & Ludwin, LLC | 404 | -0,25 | 9 | 0,00 | ||||
| 2026-02-12 | 13F | RPg Family Wealth Advisory, LLC | 13.339 | -9,58 | 289 | -9,43 | ||||
| 2026-02-09 | 13F | Cypress Capital Management LLC (WY) | 80 | 0,00 | 2 | 0,00 | ||||
| 2026-04-15 | 13F | Seacrest Wealth Management, Llc | 12.061 | -5,13 | 252 | -8,03 | ||||
| 2026-04-07 | 13F | Farther Finance Advisors, LLC | 2.669 | -78,82 | 56 | -79,41 | ||||
| 2026-01-30 | 13F | Sigma Planning Corp | 9.750 | 0,00 | 211 | 0,48 | ||||
| 2026-02-13 | 13F | Aptus Capital Advisors, LLC | 603 | 0,00 | 13 | 0,00 | ||||
| 2026-01-26 | 13F | AE Wealth Management LLC | 1.032 | 38,71 | 22 | 37,50 | ||||
| 2026-04-20 | 13F | Ronald Blue Trust, Inc. | 181 | -25,21 | 4 | -40,00 | ||||
| 2026-02-10 | 13F | Three Bridge Wealth Advisors, LLC | 19.519 | 32,58 | 423 | 33,12 | ||||
| 2026-04-10 | 13F | Quaker Wealth Management, LLC | 0 | -100,00 | 0 | |||||
| 2026-02-12 | 13F | Federated Hermes, Inc. | 114 | 2 | ||||||
| 2025-11-14 | 13F | Susquehanna International Group, Llp | 0 | -100,00 | 0 | -100,00 | ||||
| 2026-04-07 | 13F | Blueline Advisors Llc | 0 | 0 | ||||||
| 2026-02-10 | 13F | Tidemark, LLC | 612 | 0,16 | 13 | 0,00 | ||||
| 2026-04-22 | 13F | Janney Montgomery Scott LLC | 116.108 | 17,75 | 2 | 0,00 | ||||
| 2026-02-17 | 13F | Hilltop Holdings Inc. | 0 | -100,00 | 0 | -100,00 | ||||
| 2026-02-12 | 13F | Hollencrest Capital Management | 37 | 0,00 | 1 | |||||
| 2026-04-08 | 13F | Dynamic Advisor Solutions LLC | 17.063 | 0,39 | 357 | -3,26 | ||||
| 2026-04-17 | 13F | Total Clarity Wealth Management, Inc. | 16.763 | -56,41 | 350 | -57,98 | ||||
| 2026-02-12 | 13F | Steward Partners Investment Advisory, Llc | 18.109 | 1,76 | 392 | 2,35 | ||||
| 2026-02-17 | 13F | Raymond James Financial Inc | 434.396 | -2,62 | 9.409 | -2,16 | ||||
| 2026-04-20 | 13F | MBM Wealth Consultants, LLC | 29 | 1 | ||||||
| 2026-01-16 | 13F | Trust Co Of Vermont | 158 | 3 | ||||||
| 2025-11-14 | 13F | Strategic Wealth Partners, Ltd. | 77 | 0,00 | 2 | 0,00 | ||||
| 2026-02-10 | 13F | Goldman Sachs Group Inc | 178.224 | 726,45 | 3.860 | 731,90 | ||||
| 2026-02-04 | 13F | Boyd Watterson Asset Management Llc/oh | 428 | 147,40 | 9 | 200,00 | ||||
| 2026-02-06 | 13F | Pnc Financial Services Group, Inc. | 5.219 | 29,12 | 113 | 29,89 | ||||
| 2026-02-11 | 13F | LPL Financial LLC | 841.399 | 6,98 | 18.225 | 7,48 | ||||
| 2026-02-12 | 13F | Hrt Financial Lp | 0 | -100,00 | 0 | |||||
| 2026-04-22 | 13F | Spire Wealth Management | 122 | 0,00 | 3 | 0,00 | ||||
| 2026-02-13 | 13F | Ausdal Financial Partners, Inc. | 75.000 | 13,99 | 1.625 | 14,53 | ||||
| 2026-04-20 | 13F | Clune & Associates, Ltd. | 0 | -100,00 | 0 | |||||
| 2026-04-24 | 13F | Wagner Wealth Management, Llc | 40 | 2,56 | 1 | |||||
| 2026-02-11 | 13F | Jpmorgan Chase & Co | 50.560 | -7,78 | 1.095 | -7,28 | ||||
| 2026-02-03 | 13F | International Assets Investment Management, Llc | 368 | 8 | ||||||
| 2026-02-13 | 13F | Ubs Asset Management Americas Inc | 226.667 | 4.910 | ||||||
| 2026-04-16 | 13F | Flywheel Private Wealth LLC | 13.891 | -0,15 | 290 | -3,65 | ||||
| 2026-01-26 | 13F | Wbh Advisory Inc | 25.587 | -0,28 | 554 | 0,18 | ||||
| 2026-02-05 | 13F | Td Private Client Wealth Llc | 363 | 0,00 | 8 | 0,00 | ||||
| 2026-02-17 | 13F | Qube Research & Technologies Ltd | 0 | -100,00 | 0 | |||||
| 2026-02-03 | 13F | Sequoia Financial Advisors, LLC | 18.068 | -3,27 | 391 | -2,74 | ||||
| 2026-02-17 | 13F | Blair William & Co/il | 5.678 | 1,14 | 123 | 0,83 | ||||
| 2026-01-20 | 13F | SOA Wealth Advisors, LLC. | 1.247 | 1,46 | 27 | 3,85 | ||||
| 2026-01-29 | 13F | Concurrent Investment Advisors, LLC | 33.027 | 33,88 | 715 | 34,65 | ||||
| 2026-02-06 | 13F | EverSource Wealth Advisors, LLC | 783 | -28,23 | 17 | -30,43 | ||||
| 2025-11-04 | 13F | Legend Financial Advisors, Inc. | 0 | -100,00 | 0 | |||||
| 2026-02-10 | 13F/A | Northwestern Mutual Wealth Management Co | 20.573 | 64,39 | 446 | 65,43 | ||||
| 2026-02-17 | 13F | Tower Research Capital LLC (TRC) | 0 | -100,00 | 0 | |||||
| 2026-02-19 | 13F | Invesco Ltd. | 2.599.005 | 24,97 | 56.294 | 25,55 | ||||
| 2026-02-17 | 13F | Private Advisor Group, LLC | 32.845 | -15,08 | 711 | -14,65 | ||||
| 2026-02-12 | 13F | Front Row Advisors LLC | 410 | 0,00 | 9 | 0,00 | ||||
| 2026-02-17 | 13F | Man Group plc | 294.583 | -11,57 | 6.381 | -11,17 | ||||
| 2026-04-07 | 13F | Eastern Bank | 53 | 1 | ||||||
| 2026-02-12 | 13F | Principal Securities, Inc. | 29.896 | 7.585,35 | 648 | 7.987,50 | ||||
| 2025-11-10 | 13F | Choate Investment Advisors | 0 | -100,00 | 0 | |||||
| 2026-02-13 | 13F | Toroso Investments, LLC | 44.056 | -5,09 | 954 | -4,60 | ||||
| 2026-04-17 | 13F | Stewardship Advisors, LLC | 19.710 | -4,45 | 412 | -7,85 | ||||
| 2026-02-06 | 13F | Red Wave Investments LLC | 39.818 | -1,66 | 862 | -1,15 | ||||
| 2026-04-22 | 13F | Asset Allocation Strategies LLC | 13.989 | -21,90 | 292 | -24,55 | ||||
| 2025-11-07 | 13F | Ballast, Inc. | 0 | -100,00 | 0 | -100,00 | ||||
| 2026-02-12 | 13F | Bank Of Montreal /can/ | 227.100 | 3.685,00 | 4.919 | 3.712,40 | ||||
| 2026-02-02 | 13F | Truist Financial Corp | 9.662 | -14,76 | 209 | -14,34 | ||||
| 2026-04-02 | 13F | Noble Wealth Management PBC | 500 | 0,00 | 10 | 0,00 | ||||
| 2026-04-21 | 13F | Sequent Planning LLC | 10.474 | 4,65 | 219 | 0,93 | ||||
| 2026-01-30 | 13F | Simplicity Wealth,LLC | 12.363 | 268 | ||||||
| 2026-01-21 | 13F | Flagship Harbor Advisors, Llc | 46 | 1 | ||||||
| 2026-04-08 | 13F | Post Resch Tallon Group Inc. | 10.463 | -1,23 | 220 | -4,37 | ||||
| 2026-02-06 | 13F | Copia Wealth Management | 348 | 8 | ||||||
| 2026-02-17 | 13F | Cetera Investment Advisers | 46.726 | 25,00 | 1.012 | 25,71 | ||||
| 2026-04-08 | 13F | Wealth Enhancement Advisory Services, Llc | 198.206 | -43,96 | 4.174 | -45,55 | ||||
| 2026-02-02 | 13F | Cornerstone Planning Group LLC | 43 | 2,38 | 1 | |||||
| 2026-01-23 | 13F | Westside Investment Management, Inc. | 9 | -95,45 | 0 | -100,00 | ||||
| 2026-02-02 | 13F | CX Institutional | 0 | -100,00 | 0 | |||||
| 2026-04-22 | 13F | Networth Advisors, LLC | 16 | 0,00 | 0 | |||||
| 2026-02-13 | 13F | Stifel Financial Corp | 89.926 | -2,68 | 1.948 | -2,26 | ||||
| 2026-02-17 | 13F | Warren Averett Asset Management, LLC | 341.267 | 3,99 | 7.392 | 4,47 | ||||
| 2026-02-12 | 13F | Commonwealth Equity Services, Llc | 19.534 | -34,29 | 423 | |||||
| 2026-02-12 | 13F | Founders Financial Alliance, LLC | 1.526 | 0,59 | 33 | 3,13 | ||||
| 2026-02-13 | 13F | Mml Investors Services, Llc | 74.685 | 81,24 | 1.618 | 82,09 | ||||
| 2026-01-29 | 13F | UBS Group AG | 715.143 | -0,65 | 15.490 | -0,19 | ||||
| 2025-11-14 | 13F | Citadel Advisors Llc | Call | 0 | -100,00 | 0 | -100,00 | |||
| 2026-01-30 | 13F | Wealthfront Advisers Llc | 215.862 | -39,66 | 4.676 | -39,38 | ||||
| 2026-02-13 | 13F | Wells Fargo & Company/mn | 2.258.988 | -0,83 | 48.930 | -0,37 | ||||
| 2026-04-08 | 13F | Legacy Wealth Asset Management, LLC | 37.818 | 3,22 | 790 | -0,38 | ||||
| 2026-01-26 | 13F | Cwm, Llc | 277 | 24,77 | 0 | |||||
| 2026-02-13 | 13F | Flow Traders U.s. Llc | 37.535 | -50,08 | 1 | -100,00 | ||||
| 2026-04-07 | 13F | City Center Advisors, LLC | 39.247 | 12,54 | 820 | 8,61 | ||||
| 2026-04-16 | 13F | Rockland Trust Co | 17.027 | 2,39 | 356 | -1,39 | ||||
| 2026-02-05 | 13F | Bessemer Group Inc | 228 | 0,00 | 0 | |||||
| 2026-02-17 | 13F | Fmr Llc | 46 | 0,00 | 1 | |||||
| 2026-01-27 | 13F | Mainstay Capital Management Llc /adv | 17.311 | 375 | ||||||
| 2026-02-12 | 13F | Triumph Capital Management | 185 | 0,00 | 4 | 33,33 | ||||
| 2025-10-31 | 13F | Cullen/frost Bankers, Inc. | 0 | -100,00 | 0 | |||||
| 2025-11-12 | 13F | Transce3nd, LLC | 0 | -100,00 | 0 | |||||
| 2026-01-29 | 13F | Comerica Bank | 7.618 | -0,39 | 165 | 0,61 | ||||
| 2026-04-14 | 13F | Thurston, Springer, Miller, Herd & Titak, Inc. | 124 | 0,00 | 3 | 0,00 | ||||
| 2026-02-13 | 13F | Arete Wealth Advisors, LLC | 11.096 | 7,47 | 0 | |||||
| 2026-02-10 | 13F | Verus Capital Partners, Llc | 34.922 | -2,07 | 756 | -1,56 | ||||
| 2026-04-15 | 13F | Register Financial Advisors LLC | 56 | 1 | ||||||
| 2026-04-14 | 13F | SigFig Wealth Management, LLC | 184.022 | 1,22 | 3.846 | -2,76 | ||||
| 2026-04-10 | 13F | Perigon Wealth Management, LLC | 0 | -100,00 | 0 | |||||
| 2026-02-18 | 13F | GWM Advisors LLC | 752 | 0,53 | 16 | 0,00 | ||||
| 2026-04-21 | 13F | Laurel Oak Wealth Management, Llc | 10.083 | 0,00 | 211 | -3,67 | ||||
| 2026-02-11 | 13F | Syon Capital Llc | 1.308.476 | 28.342 | ||||||
| 2026-02-11 | 13F | United Financial Planning Group LLC | 21 | 0 | ||||||
| 2026-02-04 | 13F | Fourth Dimension Wealth, LLC | 553 | -32,23 | 12 | -35,29 | ||||
| 2026-04-07 | 13F | Park Avenue Securities Llc | 0 | -100,00 | 0 | |||||
| 2026-02-10 | 13F | Bnp Paribas Arbitrage, Sa | 4.404 | -94,42 | 95 | -94,42 | ||||
| 2026-02-06 | 13F | Addison Advisors LLC | 0 | -100,00 | 0 | |||||
| 2026-04-17 | 13F | Great Waters Wealth Management | 24.208 | -0,67 | 506 | -4,17 | ||||
| 2026-04-06 | 13F | Rosenberg Matthew Hamilton | 1.351 | -81,54 | 28 | -82,28 | ||||
| 2026-04-24 | 13F | Key FInancial Inc | 292 | -2,67 | 6 | 0,00 | ||||
| 2026-01-23 | 13F | Keener Financial Planning LLC | 0 | -100,00 | 0 | |||||
| 2026-01-23 | 13F | Blue Fin Capital, Inc. | 25.197 | -0,41 | 546 | 0,00 | ||||
| 2026-02-17 | 13F | Citadel Advisors Llc | 63.811 | 159,61 | 1.382 | 161,25 | ||||
| 2026-02-06 | 13F | Global Retirement Partners, LLC | 142 | 0,00 | 3 | 0,00 | ||||
| 2026-02-17 | 13F | Advisor Group Holdings, Inc. | 113.761 | 7,09 | 2.464 | 8,17 | ||||
| 2026-02-14 | 13F | Rockefeller Capital Management L.P. | 27.022 | -0,72 | 586 | -0,17 | ||||
| 2026-04-21 | 13F | Delta Wealth Advisors LLC | 0 | -100,00 | 0 | |||||
| 2026-02-13 | 13F | SRS Capital Advisors, Inc. | 17 | 0,00 | 0 | |||||
| 2026-02-13 | 13F | Pinnacle Wealth Planning Services, Inc. | 9.780 | 212 | ||||||
| 2026-02-11 | 13F | Curio Wealth, Llc | 16 | 0 | ||||||
| 2026-02-17 | 13F | Wiley Bros.-aintree Capital, Llc | 22.468 | 33,82 | 487 | 34,63 | ||||
| 2026-04-17 | 13F | Community Bank & Trust, Waco, Texas | 10.166 | 0 | ||||||
| 2026-02-13 | 13F | Colony Group, LLC | 13.312 | 288 | ||||||
| 2026-02-13 | 13F | OpenArc Corporate Advisory, LLC | 10.196 | 221 | ||||||
| 2025-10-30 | 13F | Twin Peaks Wealth Advisors, LLC | 0 | -100,00 | 0 | |||||
| 2026-04-23 | 13F | Financial & Tax Architects, LLC | 231.834 | -64,07 | 4.845 | -65,33 | ||||
| 2026-02-10 | 13F | Bank of New York Mellon Corp | 28.968 | -2,24 | 627 | -1,72 | ||||
| 2026-02-17 | 13F | Prosperity Consulting Group, LLC | 25.043 | -18,23 | 542 | -17,88 | ||||
| 2026-02-05 | 13F | HighMark Wealth Management LLC | 50 | 2,04 | 1 | 0,00 | ||||
| 2026-02-02 | 13F | Breakwater Investment Management | 2.230 | 0,00 | 48 | 0,00 | ||||
| 2026-04-16 | 13F | Annex Advisory Services, LLC | 4.002.668 | 83.656 | ||||||
| 2026-01-29 | 13F | Simon Quick Advisors, Llc | 78.498 | -0,58 | 1.700 | -0,12 | ||||
| 2026-01-21 | 13F | Alliance Wealth Management Group | 230.465 | -10,31 | 4.992 | -9,89 | ||||
| 2026-02-10 | 13F | Winthrop Capital Management, LLC | 292 | 0,00 | 0 | |||||
| 2025-10-27 | 13F | Kiker Wealth Management, LLC | 0 | -100,00 | 0 | |||||
| 2026-02-13 | 13F | Morgan Stanley | 377.591 | -40,05 | 8.179 | -39,77 | ||||
| 2026-02-17 | 13F | Crabel Capital Management, LLC | 16.680 | -5,00 | 361 | -4,50 | ||||
| 2026-04-07 | 13F | U.S. Capital Wealth Advisors, LLC | 13.744 | 0,00 | 287 | -3,37 | ||||
| 2026-04-23 | 13F | Global Trust Asset Management, LLC | 0 | -100,00 | 0 | |||||
| 2026-02-05 | 13F | Allworth Financial LP | 574 | -43,00 | 12 | -42,86 | ||||
| 2026-01-23 | 13F | Fortress Financial Solutions, LLC | 32.527 | 23,49 | 705 | 24,16 | ||||
| 2026-02-05 | 13F | Bank Julius Baer & Co. Ltd, Zurich | 813 | 0,49 | 18 | 0,00 | ||||
| 2026-02-11 | 13F | Cerity Partners LLC | 69.195 | -3,09 | 1.499 | -2,66 | ||||
| 2026-04-21 | 13F | Wesbanco Bank Inc | 20.000 | 0,00 | 418 | -3,46 | ||||
| 2026-02-05 | 13F | Cambridge Investment Research Advisors, Inc. | 41.651 | 95,00 | 1 | |||||
| 2026-02-13 | 13F | Mariner, LLC | 68.327 | 11,13 | 1.480 | 11,62 | ||||
| 2026-02-20 | 13F | Sunbelt Securities, Inc. | 5 | 0,00 | 0 | |||||
| 2026-04-09 | 13F | C2P Capital Advisory Group, LLC d.b.a. Prosperity Capital Advisors | 23.079 | -7,64 | 482 | -10,91 | ||||
| 2026-01-30 | 13F | Archer Investment Corp | 308 | 0,00 | 7 | 0,00 | ||||
| 2026-04-21 | 13F | Gilpin Wealth Management, Llc | 210 | 0,00 | 4 | 0,00 | ||||
| 2026-04-17 | 13F | RFG Advisory, LLC | 122.268 | -1,98 | 2.555 | -5,41 | ||||
| 2026-04-13 | 13F | IFP Advisors, Inc | 936 | 0,32 | 20 | -5,00 | ||||
| 2026-04-20 | 13F | Auour Investments LLC | 18.363 | 16,57 | 384 | 12,32 | ||||
| 2026-02-09 | 13F | Keating Financial Advisory Services, Inc. | 13.956 | 302 | ||||||
| 2026-01-26 | 13F | Northwest Capital Management Inc | 0 | -100,00 | 0 | |||||
| 2026-04-15 | 13F | Zullo Investment Group, Inc. | 10.247 | -0,01 | 214 | -3,17 | ||||
| 2025-11-12 | 13F | Abacus Wealth Partners, LLC | 0 | -100,00 | 0 | |||||
| 2026-02-12 | 13F | Jane Street Group, Llc | 0 | -100,00 | 0 | |||||
| 2026-02-13 | 13F | First Trust Advisors Lp | 10.270 | 0,57 | 222 | 0,91 | ||||
| 2026-02-05 | 13F | Mission Wealth Management, Lp | 39.457 | -1,68 | 855 | -1,27 | ||||
| 2026-02-10 | 13F | Envestnet Asset Management Inc | 143.548 | 2,62 | 3.109 | 3,12 | ||||
| 2026-01-21 | 13F | Sound Income Strategies, LLC | 59.874 | 797,39 | 1.296 | 805,59 | ||||
| 2026-02-10 | 13F | Operose Advisors LLC | 429 | 9 | ||||||
| 2026-02-04 | 13F | Pensionmark Financial Group, Llc | 72.995 | 11,91 | 1.576 | 12,02 |