Grundlæggende statistik
| Institutionelle ejere | 117 total, 117 long only, 0 short only, 0 long/short - change of -7,87% MRQ |
| Gennemsnitlig porteføljeallokering | 0.0729 % - change of 13,97% MRQ |
| Institutionelle aktier (lange) | 18.968.227 (ex 13D/G) - change of -0,51MM shares -2,62% MRQ |
| Institutionel værdi (lang) | $ 368.843 USD ($1000) |
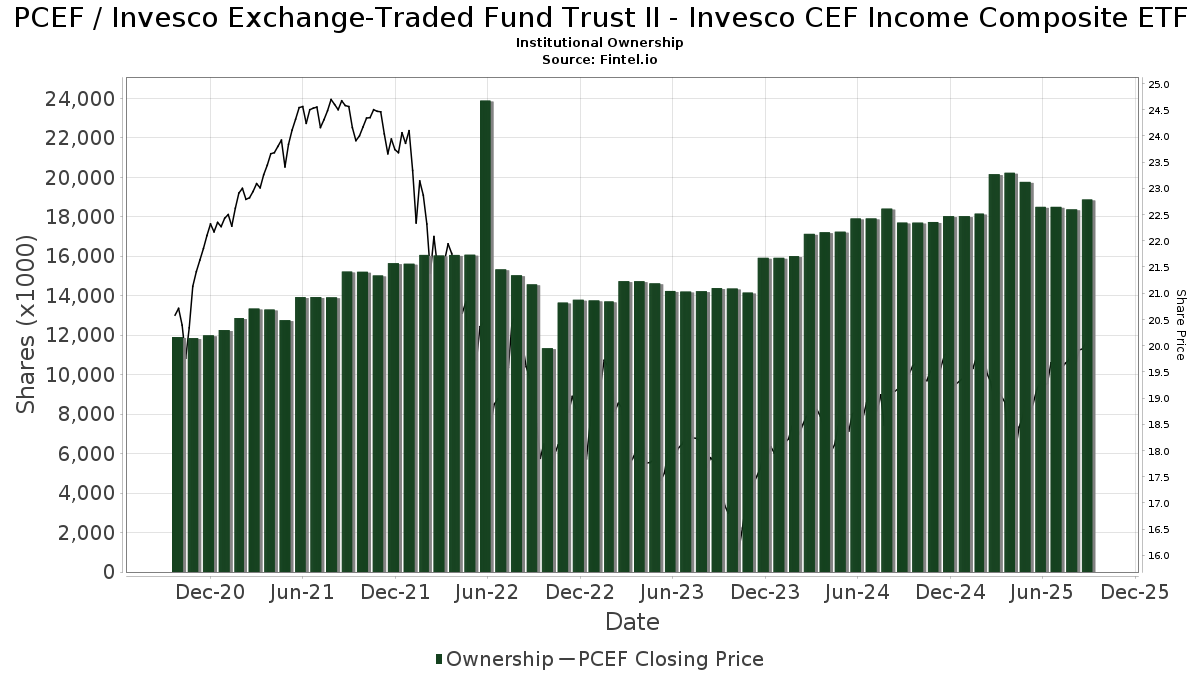
Institutionelt ejerskab og aktionærer
Invesco Exchange-Traded Fund Trust II - Invesco CEF Income Composite ETF (US:PCEF) har 117 institutionelle ejere og aktionærer, der har indsendt 13D/G- eller 13F-formularer til Securities Exchange Commission (SEC). Disse institutioner har i alt 18,968,227 aktier. Største aktionærer omfatter Royal Bank Of Canada, Morgan Stanley, Envestnet Asset Management Inc, Wells Fargo & Company/mn, Raymond James Financial Inc, LPL Financial LLC, Larson Financial Group LLC, Bank Of America Corp /de/, Intrua Financial, LLC, and Cetera Investment Advisers .
Invesco Exchange-Traded Fund Trust II - Invesco CEF Income Composite ETF (ARCA:PCEF) institutionel ejerskabsstruktur viser aktuelle positioner i virksomheden efter institutioner og fonde, samt seneste ændringer i positionsstørrelse. Større aktionærer kan omfatte individuelle investorer, investeringsforeninger, hedgefonde eller institutioner. Skema 13D angiver, at investoren besidder (eller besidder) mere end 5 % af virksomheden og har til hensigt (eller har til hensigt at) aktivt at forfølge en ændring i forretningsstrategi. Skema 13G indikerer en passiv investering på over 5%.
The share price as of March 26, 2026 is 18,65 / share. Previously, on March 27, 2025, the share price was 18,94 / share. This represents a decline of 1,53% over that period.
Fondens stemningsscore
Fund Sentiment Score (fka Ownership Accumulation Score) finder de aktier, der bliver mest købt af fonde. Det er resultatet af en sofistikeret, multi-faktor kvantitativ model, der identificerer virksomheder med de højeste niveauer af institutionel akkumulering. Scoringsmodellen bruger en kombination af den samlede stigning i oplyste ejere, ændringerne i porteføljeallokeringer i disse ejere og andre målinger. Tallet går fra 0 til 100, hvor højere tal indikerer et højere niveau af akkumulering for sine jævnaldrende, og 50 er gennemsnittet.
Opdateringsfrekvens: Dagligt
Se Ownership Explorer, som giver en liste over højest rangerende virksomheder.
AI+ Ask Fintel’s AI assistant about Invesco Exchange-Traded Fund Trust II - Invesco CEF Income Composite ETF.
Select a question to share a public post with an AI-crafted answer.
Thinking of good questions…
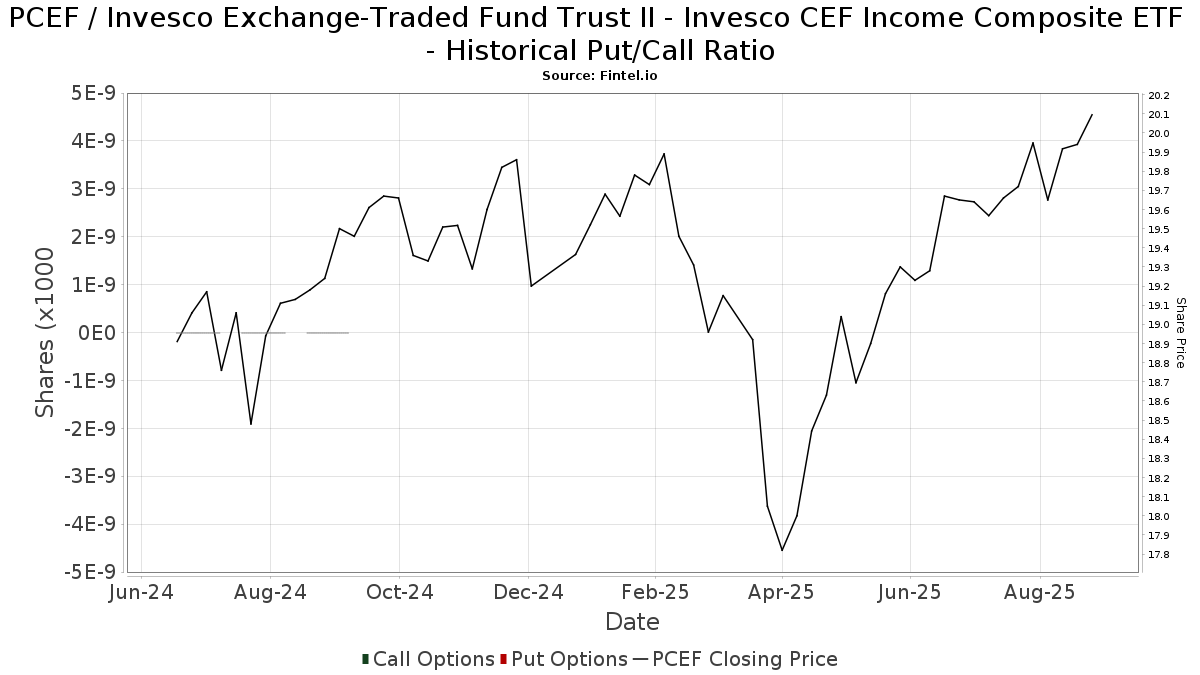
Institutionel Put/Call-forhold
Ud over at indberette standardaktie- og gældsudstedelser skal institutter med mere end 100 mill. aktiver under forvaltning også oplyse deres put- og call-optionsbeholdninger. Da salgsoptioner generelt indikerer negativ stemning, og købsoptioner indikerer positiv stemning, kan vi få en fornemmelse af den overordnede institutionelle stemning ved at plotte forholdet mellem put og kald. Diagrammet til højre viser det historiske put/call-forhold for dette instrument.
Brug af Put/Call Ratio som en indikator for investorernes stemning overvinder en af de vigtigste mangler ved at bruge totalt institutionelt ejerskab, som er, at en betydelig mængde af aktiver under forvaltning investeres passivt for at spore indekser. Passivt forvaltede fonde køber typisk ikke optioner, så indikatoren for put/call-forholdet følger mere nøje følelsen af aktivt forvaltede fonde.
13F og NPORT arkivering
Detaljer om 13F-arkivering er gratis. Detaljer om NP-ansøgninger kræver et premium-medlemskab. Grønne rækker angiver nye positioner. Røde rækker angiver lukkede positioner. Klik på linket ikon for at se den fulde transaktionshistorik.
Opgrader
for at låse premium-data op og eksportere til Excel ![]() .
.
| Fil dato | Kilde | Investor | Type | Gennemsnitlig pris (Øst) |
Aktier | Δ Aktier (%) |
Rapporteret Værdi ($1000) |
Δ Værdi (%) |
Port Alloc (%) |
|
|---|---|---|---|---|---|---|---|---|---|---|
| 2026-02-09 | 13F | Endowment Wealth Management, Inc. | 27.628 | 2,50 | 549 | 2,04 | ||||
| 2026-02-17 | 13F | Private Advisor Group, LLC | 27.990 | 1,00 | 556 | 0,54 | ||||
| 2026-02-05 | 13F | Thrivent Financial For Lutherans | 11.785 | -71,64 | 0 | |||||
| 2026-02-17 | 13F | Creative Planning | 34.793 | -13,77 | 692 | -14,16 | ||||
| 2026-01-13 | 13F | CoreCap Advisors, LLC | 7.016 | -5,37 | 139 | -6,08 | ||||
| 2026-02-06 | 13F | GPS Wealth Strategies Group, LLC | 400 | -93,66 | 8 | -94,40 | ||||
| 2026-02-13 | 13F | Mml Investors Services, Llc | 92.989 | 2,83 | 1.849 | 2,38 | ||||
| 2025-11-07 | 13F | Atticus Wealth Management, Llc | 0 | -100,00 | 0 | |||||
| 2026-02-17 | 13F | WFA of San Diego, LLC | 0 | -100,00 | 0 | |||||
| 2026-02-02 | 13F | Truist Financial Corp | 53.818 | -4,83 | 1.070 | -5,31 | ||||
| 2026-02-18 | 13F | Beacon Pointe Advisors, LLC | 15.094 | 1,31 | 300 | 1,01 | ||||
| 2026-02-06 | 13F | Pnc Financial Services Group, Inc. | 10.205 | -12,29 | 203 | -12,93 | ||||
| 2026-02-10 | 13F | Boxwood Ventures, Inc. | 15.492 | 1,98 | 308 | 1,32 | ||||
| 2026-01-20 | 13F | Toth Financial Advisory Corp | 146 | 0,00 | 3 | 0,00 | ||||
| 2026-02-11 | 13F | Jpmorgan Chase & Co | 135 | -32,50 | 3 | -50,00 | ||||
| 2026-02-13 | 13F | Stifel Financial Corp | 66.894 | 7,53 | 1.330 | 7,00 | ||||
| 2026-02-17 | 13F | Cetera Investment Advisers | 547.607 | -1,58 | 10.886 | -2,03 | ||||
| 2026-01-22 | 13F | Glass Jacobson Investment Advisors llc | 82 | -39,26 | 2 | -50,00 | ||||
| 2026-01-23 | 13F | Farther Finance Advisors, LLC | 5.606 | -14,61 | 111 | -15,27 | ||||
| 2026-02-17 | 13F | Argyle Capital Partners, LLC | 22.839 | -4,89 | 454 | -5,22 | ||||
| 2026-02-06 | 13F | Pathway Financial Advisers, LLC | 0 | -100,00 | 0 | |||||
| 2026-02-12 | 13F | Commonwealth Equity Services, Llc | 415.430 | -6,50 | 8.259 | 103.125,00 | ||||
| 2026-01-26 | 13F | BTS Asset Management, Inc. | 15.153 | 301 | ||||||
| 2026-02-17 | 13F | Palisade Capital Management Llc/nj | 15.704 | 312 | ||||||
| 2026-02-06 | 13F | Hexagon Capital Partners LLC | 12.299 | 0,00 | 245 | -0,41 | ||||
| 2026-01-30 | 13F | Reicon Wealth Advisors, Llc | 13.814 | 275 | ||||||
| 2026-01-12 | 13F | Sax Wealth Advisors, Llc | 12.500 | 0,00 | 248 | -0,40 | ||||
| 2026-01-20 | 13F | Wall Street Access Asset Management, LLC | 812 | 0,00 | 16 | 0,00 | ||||
| 2026-01-23 | 13F | Aspect Partners, LLC | 0 | -100,00 | 0 | |||||
| 2026-02-06 | 13F | Larson Financial Group LLC | 953.156 | 6,80 | 18.949 | 6,32 | ||||
| 2026-02-27 | 13F | Compass Financial Services Inc | 12.897 | 1,54 | 256 | 1,19 | ||||
| 2026-01-29 | 13F | UBS Group AG | 302.632 | -2,77 | 6.016 | -3,20 | ||||
| 2026-02-09 | 13F | Harbour Investments, Inc. | 32.762 | 2,84 | 651 | 2,36 | ||||
| 2026-02-09 | 13F | Prospera Financial Services Inc | 14.254 | 0,53 | 283 | 0,00 | ||||
| 2026-02-13 | 13F | Kestra Advisory Services, LLC | 0 | -100,00 | 0 | |||||
| 2026-02-13 | 13F | Resources Investment Advisors, LLC. | 13.685 | 1,97 | 272 | 1,49 | ||||
| 2026-02-05 | 13F | Intrua Financial, LLC | 583.845 | 10,54 | 11.607 | 10,04 | ||||
| 2026-02-12 | 13F | Summit Financial, LLC | 63.834 | 7,70 | 1.269 | 7,27 | ||||
| 2026-02-17 | 13F | Gladstone Institutional Advisory LLC | 0 | -100,00 | 0 | |||||
| 2025-11-04 | 13F | Jones Financial Companies Lllp | 0 | -100,00 | 0 | -100,00 | ||||
| 2026-01-28 | 13F | Geneos Wealth Management Inc. | 46.001 | -2,33 | 915 | -2,77 | ||||
| 2026-02-05 | 13F | Panoramic Investment Advisors, Llc | 54.905 | 0,96 | 1.092 | 0,46 | ||||
| 2026-02-06 | 13F | Adell Harriman & Carpenter Inc | 172.648 | 18,54 | 3.432 | 18,02 | ||||
| 2026-02-17 | 13F | Advisory Services Network, LLC | 0 | -100,00 | 0 | |||||
| 2025-10-06 | 13F | Von Berge Wealth Management Group, LLC | 0 | -100,00 | 0 | |||||
| 2026-01-28 | 13F | Chicago Partners Investment Group LLC | 26.717 | -3,00 | 536 | -2,90 | ||||
| 2026-02-17 | 13F | Ameriprise Financial Inc | 448.597 | 1,91 | 8.918 | 1,42 | ||||
| 2026-01-29 | 13F | Dumont & Blake Investment Advisors Llc | 131.937 | -3,99 | 3 | -99,93 | ||||
| 2026-02-13 | 13F | Citigroup Inc | 256 | 0,00 | 5 | 0,00 | ||||
| 2026-02-13 | 13F | Wells Fargo & Company/mn | 1.666.675 | -15,43 | 33.133 | -15,81 | ||||
| 2025-10-30 | 13F | Envestnet Portfolio Solutions, Inc. | 0 | -100,00 | 0 | |||||
| 2026-01-30 | 13F | Wagner Wealth Management, Llc | 3.152 | 0,57 | 63 | 0,00 | ||||
| 2026-02-12 | 13F | Brinker Capital Investments, LLC | 32.778 | -22,23 | 652 | -22,59 | ||||
| 2026-01-05 | 13F | GAMMA Investing LLC | 4.353 | 7,48 | 87 | 7,50 | ||||
| 2026-02-12 | 13F | Sykon Capital Llc | 127.602 | -24,83 | 2.537 | -25,19 | ||||
| 2026-01-29 | 13F | Comerica Bank | 20.216 | -7,96 | 402 | -8,45 | ||||
| 2026-02-11 | 13F | Vermillion Wealth Management, Inc. | 1.333 | 0,00 | 26 | 0,00 | ||||
| 2026-02-13 | 13F | Smartleaf Asset Management LLC | 28.864 | -40,70 | 574 | -40,70 | ||||
| 2026-02-17 | 13F | Bank Of America Corp /de/ | 938.150 | -0,08 | 18.650 | -0,53 | ||||
| 2026-02-18 | 13F | GWM Advisors LLC | 0 | -100,00 | 0 | |||||
| 2026-02-17 | 13F | SageView Advisory Group, LLC | 796 | 16 | ||||||
| 2026-03-04 | 13F | SHP Wealth Management | 701 | 14 | ||||||
| 2026-02-17 | 13F | Fmr Llc | 1.703 | 66,96 | 34 | 65,00 | ||||
| 2026-02-09 | 13F | Beck Bode, LLC | 23.844 | -4,56 | 474 | -4,82 | ||||
| 2026-02-04 | 13F | Money Concepts Capital Corp | 11.260 | 3,95 | 224 | 3,24 | ||||
| 2026-02-17 | 13F | Garden State Investment Advisory Services LLC | 18.941 | 0,00 | 377 | -0,53 | ||||
| 2026-01-08 | 13F | Wealth Enhancement Advisory Services, Llc | 417.400 | -1,40 | 8.344 | -2,15 | ||||
| 2026-02-11 | 13F | Janney Montgomery Scott LLC | 25.735 | 0,66 | 1 | |||||
| 2026-01-21 | 13F | Sound Income Strategies, LLC | 60 | 0,00 | 1 | 0,00 | ||||
| 2026-02-02 | 13F | Oppenheimer & Co Inc | 67.629 | -22,24 | 1.344 | -22,58 | ||||
| 2026-02-05 | 13F | 1620 Investment Advisors, Inc. | 489 | 12,41 | 10 | 12,50 | ||||
| 2026-02-06 | 13F | HighTower Advisors, LLC | 92.516 | -6,24 | 1.839 | -6,65 | ||||
| 2026-01-23 | 13F | Assetmark, Inc | 0 | -100,00 | 0 | |||||
| 2026-02-10 | 13F | Bnp Paribas Arbitrage, Sa | 193 | 0,00 | 4 | 0,00 | ||||
| 2026-02-13 | 13F | Goldstone Financial Group, LLC | 52.108 | -1,44 | 1.036 | -1,90 | ||||
| 2026-01-26 | 13F | AE Wealth Management LLC | 859 | -6,12 | 17 | -5,56 | ||||
| 2026-02-13 | 13F | Baird Financial Group, Inc. | 94.051 | -78,85 | 1.870 | -78,95 | ||||
| 2026-01-29 | 13F | Nbc Securities, Inc. | 9.796 | 97,26 | 195 | 95,96 | ||||
| 2026-01-16 | 13F | Marino, Stram & Associates Llc | 46.515 | 0,00 | 925 | -0,43 | ||||
| 2026-01-28 | 13F | Salomon & Ludwin, LLC | 773 | 0,00 | 15 | 0,00 | ||||
| 2026-01-26 | 13F | Cwm, Llc | 27.567 | -3,80 | 1 | |||||
| 2026-02-09 | 13F | Key FInancial Inc | 0 | -100,00 | 0 | |||||
| 2026-01-21 | 13F | Newbridge Financial Services Group, Inc. | 6.991 | 4,48 | 139 | 3,76 | ||||
| 2026-01-12 | 13F | Heartwood Wealth Advisors LLC | 35.000 | 0,00 | 696 | -0,43 | ||||
| 2026-02-17 | 13F | Advisor Group Holdings, Inc. | 142.162 | -21,62 | 2.827 | -21,93 | ||||
| 2026-01-21 | 13F | Capital Investment Advisory Services, LLC | 4.861 | 1,99 | 97 | 1,05 | ||||
| 2026-02-17 | 13F | Citadel Advisors Llc | 20.236 | 402 | ||||||
| 2026-01-26 | 13F | Merit Financial Group, LLC | 119.667 | -31,81 | 2.379 | -32,13 | ||||
| 2026-02-12 | 13F | Johnson Financial Group, Inc. | 12 | 0,00 | 0 | |||||
| 2026-01-07 | 13F | Qp Wealth Management, Llc | 14.827 | -3,02 | 295 | 12,64 | ||||
| 2026-02-14 | 13F | Rockefeller Capital Management L.P. | 92.270 | -10,23 | 1.834 | -10,62 | ||||
| 2026-02-17 | 13F | Wiley Bros.-aintree Capital, Llc | 16.811 | 334 | ||||||
| 2026-02-03 | 13F | Anfield Capital Management, LLC | 3.663 | 0,00 | 73 | -1,37 | ||||
| 2026-02-06 | 13F | Hudson Valley Investment Advisors Inc /adv | 0 | -100,00 | 0 | |||||
| 2026-02-13 | 13F | Aptus Capital Advisors, LLC | 7.068 | -37,47 | 141 | -37,78 | ||||
| 2026-01-21 | 13F | Future Financial Wealth Managment LLC | 46.154 | -19,73 | 915 | -20,30 | ||||
| 2026-02-03 | 13F | Emerald Investment Partners, Llc | 63.163 | 1,20 | 1.243 | -0,32 | ||||
| 2026-02-17 | 13F | Gotham Asset Management, LLC | 36.739 | 89,20 | 730 | 88,63 | ||||
| 2026-02-13 | 13F | Morgan Stanley | 2.499.683 | 11,73 | 49.694 | 11,22 | ||||
| 2026-02-13 | 13F | Quartz Partners, LLC | 12.766 | 0,00 | 254 | -0,39 | ||||
| 2026-02-17 | 13F | Warren Averett Asset Management, LLC | 0 | -100,00 | 0 | |||||
| 2026-02-02 | 13F | CX Institutional | 546 | -68,58 | 0 | |||||
| 2026-02-13 | 13F | Mariner, LLC | 93.976 | -0,21 | 1.868 | -0,64 | ||||
| 2025-11-10 | 13F | Ameritas Investment Partners, Inc. | 0 | -100,00 | 0 | |||||
| 2026-02-17 | 13F | Cdkv Holdings Llc | 275 | 5 | ||||||
| 2026-03-03 | 13F | NWF Advisory Services Inc. | 20.605 | -17,58 | 410 | -18,04 | ||||
| 2026-02-06 | 13F | Global Retirement Partners, LLC | 46 | -99,07 | 1 | -100,00 | ||||
| 2026-02-13 | 13F | Level Four Advisory Services, Llc | 16.044 | 16,54 | 319 | 16,06 | ||||
| 2026-02-05 | 13F | BG Investment Services, Inc. | 0 | -100,00 | 0 | |||||
| 2026-02-05 | 13F | Cambridge Investment Research Advisors, Inc. | 216.270 | 7,11 | 4 | 0,00 | ||||
| 2026-01-15 | 13F | Highline Wealth Partners Llc | 200 | 4 | ||||||
| 2026-02-09 | 13F | Hartland & Co., LLC | 14.949 | -10,36 | 297 | -10,81 | ||||
| 2026-02-03 | 13F | Legacy Wealth Managment, LLC/ID | 0 | -100,00 | 0 | |||||
| 2026-02-17 | 13F | Equitable Holdings, Inc. | 0 | -100,00 | 0 | |||||
| 2026-01-22 | 13F | Buska Wealth Management, LLC | 23.768 | -2,59 | 473 | -3,08 | ||||
| 2026-02-12 | 13F | Principal Securities, Inc. | 0 | -100,00 | 0 | |||||
| 2026-02-12 | 13F | Steward Partners Investment Advisory, Llc | 3.164 | -26,09 | 63 | -27,06 | ||||
| 2026-02-11 | 13F | LPL Financial LLC | 1.101.072 | -0,52 | 21.889 | -0,97 | ||||
| 2026-02-05 | 13F | Allworth Financial LP | 40 | 0,00 | 1 | |||||
| 2026-02-13 | 13F | Pinnacle Wealth Planning Services, Inc. | 17.190 | 0,00 | 342 | -0,58 | ||||
| 2026-02-06 | 13F | Creative Financial Designs Inc /adv | 500 | 10 | ||||||
| 2026-02-04 | 13F | Ameritas Advisory Services, LLC | 0 | -100,00 | 0 | |||||
| 2025-11-13 | 13F | Parallel Advisors, LLC | 0 | -100,00 | 0 | -100,00 | ||||
| 2026-02-05 | 13F | Stephens Inc /ar/ | 103.539 | -5,91 | 2.058 | -6,33 | ||||
| 2026-02-13 | 13F | Glen Eagle Advisors, LLC | 3.405 | 0,00 | 68 | 0,00 | ||||
| 2026-02-03 | 13F | International Assets Investment Management, Llc | 2.886 | 57 | ||||||
| 2026-02-05 | 13F | Cornerstone Wealth Management, LLC | 61.256 | 0,03 | 1.218 | -0,41 | ||||
| 2026-01-14 | 13F | Spire Wealth Management | 147 | 0,00 | 3 | 0,00 | ||||
| 2026-01-21 | 13F | Sowell Financial Services LLC | 28.724 | 0,30 | 571 | 0,00 | ||||
| 2026-01-06 | 13F | Investors Research Corp | 213 | 0,00 | 4 | 0,00 | ||||
| 2026-02-17 | 13F | Qube Research & Technologies Ltd | 57 | 0,00 | 1 | 0,00 | ||||
| 2026-02-17 | 13F | Raymond James Financial Inc | 1.151.762 | -1,77 | 22.897 | -2,21 | ||||
| 2026-01-07 | 13F | Massmutual Trust Co Fsb/adv | 0 | -100,00 | 0 | |||||
| 2026-02-06 | 13F | IFP Advisors, Inc | 751 | -53,64 | 15 | -56,25 | ||||
| 2026-02-17 | 13F | Readystate Asset Management Lp | 0 | -100,00 | 0 | |||||
| 2026-02-17 | 13F | Royal Bank Of Canada | 3.044.256 | 62,39 | 60.520 | 61,67 | ||||
| 2026-02-23 | 13F | Wealth Preservation Advisors, LLC | 500 | 0,00 | 10 | 0,00 | ||||
| 2026-01-09 | 13F | Zrc Wealth Management, Llc | 1.311 | 0,00 | 26 | 0,00 | ||||
| 2026-02-06 | 13F | VSM Wealth Advisory, LLC | 4.669 | 1,65 | 93 | 1,10 | ||||
| 2025-10-07 | 13F | Thurston, Springer, Miller, Herd & Titak, Inc. | 0 | -100,00 | 0 | |||||
| 2026-01-30 | 13F | Us Bancorp \de\ | 2.700 | 0,00 | 54 | 0,00 | ||||
| 2026-02-10 | 13F | Envestnet Asset Management Inc | 1.930.917 | -33,38 | 38.387 | -33,68 | ||||
| 2025-11-19 | 13F | Sunbelt Securities, Inc. | 0 | -100,00 | 0 |