Grundlæggende statistik
| Institutionelle ejere | 95 total, 95 long only, 0 short only, 0 long/short - change of -2,04% MRQ |
| Gennemsnitlig porteføljeallokering | 0.0315 % - change of -12,75% MRQ |
| Institutionelle aktier (lange) | 1.281.226 (ex 13D/G) - change of -0,05MM shares -3,69% MRQ |
| Institutionel værdi (lang) | $ 79.577 USD ($1000) |
Institutionelt ejerskab og aktionærer
Invesco Exchange-Traded Fund Trust - Invesco Biotechnology & Genome ETF (US:PBE) har 95 institutionelle ejere og aktionærer, der har indsendt 13D/G- eller 13F-formularer til Securities Exchange Commission (SEC). Disse institutioner har i alt 1,281,226 aktier. Største aktionærer omfatter Gerber Kawasaki Wealth & Investment Management, Morgan Stanley, LPL Financial LLC, UBS Group AG, Royal Bank Of Canada, Wells Fargo & Company/mn, Bank Of America Corp /de/, Goldman Sachs Group Inc, Commonwealth Equity Services, Llc, and YHB Investment Advisors, Inc. .
Invesco Exchange-Traded Fund Trust - Invesco Biotechnology & Genome ETF (ARCA:PBE) institutionel ejerskabsstruktur viser aktuelle positioner i virksomheden efter institutioner og fonde, samt seneste ændringer i positionsstørrelse. Større aktionærer kan omfatte individuelle investorer, investeringsforeninger, hedgefonde eller institutioner. Skema 13D angiver, at investoren besidder (eller besidder) mere end 5 % af virksomheden og har til hensigt (eller har til hensigt at) aktivt at forfølge en ændring i forretningsstrategi. Skema 13G indikerer en passiv investering på over 5%.
The share price as of September 11, 2025 is 71,44 / share. Previously, on September 12, 2024, the share price was 69,93 / share. This represents an increase of 2,16% over that period.

Fondens stemningsscore
Fund Sentiment Score (fka Ownership Accumulation Score) finder de aktier, der bliver mest købt af fonde. Det er resultatet af en sofistikeret, multi-faktor kvantitativ model, der identificerer virksomheder med de højeste niveauer af institutionel akkumulering. Scoringsmodellen bruger en kombination af den samlede stigning i oplyste ejere, ændringerne i porteføljeallokeringer i disse ejere og andre målinger. Tallet går fra 0 til 100, hvor højere tal indikerer et højere niveau af akkumulering for sine jævnaldrende, og 50 er gennemsnittet.
Opdateringsfrekvens: Dagligt
Se Ownership Explorer, som giver en liste over højest rangerende virksomheder.
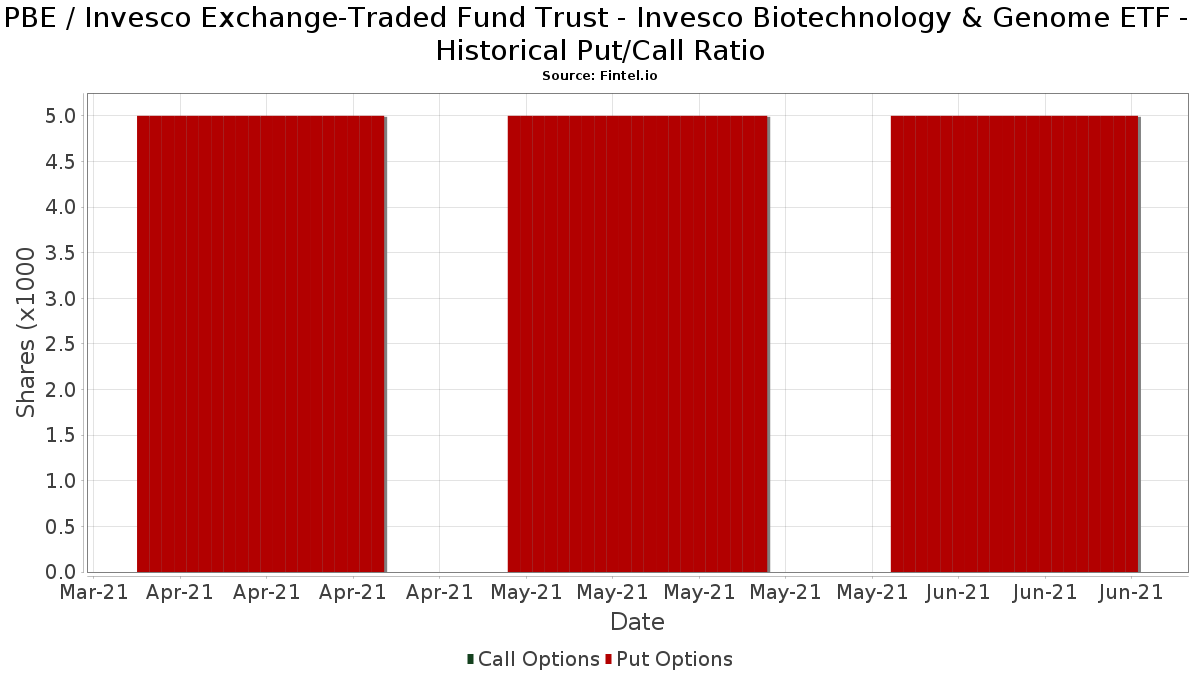
Institutionel Put/Call-forhold
Ud over at indberette standardaktie- og gældsudstedelser skal institutter med mere end 100 mill. aktiver under forvaltning også oplyse deres put- og call-optionsbeholdninger. Da salgsoptioner generelt indikerer negativ stemning, og købsoptioner indikerer positiv stemning, kan vi få en fornemmelse af den overordnede institutionelle stemning ved at plotte forholdet mellem put og kald. Diagrammet til højre viser det historiske put/call-forhold for dette instrument.
Brug af Put/Call Ratio som en indikator for investorernes stemning overvinder en af de vigtigste mangler ved at bruge totalt institutionelt ejerskab, som er, at en betydelig mængde af aktiver under forvaltning investeres passivt for at spore indekser. Passivt forvaltede fonde køber typisk ikke optioner, så indikatoren for put/call-forholdet følger mere nøje følelsen af aktivt forvaltede fonde.
13F og NPORT arkivering
Detaljer om 13F-arkivering er gratis. Detaljer om NP-ansøgninger kræver et premium-medlemskab. Grønne rækker angiver nye positioner. Røde rækker angiver lukkede positioner. Klik på linket ikon for at se den fulde transaktionshistorik.
Opgrader
for at låse premium-data op og eksportere til Excel ![]() .
.
| Fil dato | Kilde | Investor | Type | Gennemsnitlig pris (Øst) |
Aktier | Δ Aktier (%) |
Rapporteret Værdi ($1000) |
Δ Værdi (%) |
Port Alloc (%) |
|
|---|---|---|---|---|---|---|---|---|---|---|
| 2025-08-14 | 13F | Bank Of America Corp /de/ | 58.465 | -11,35 | 3.748 | -10,42 | ||||
| 2025-07-11 | 13F | Farther Finance Advisors, LLC | 8.557 | -0,68 | 549 | 2,62 | ||||
| 2025-08-04 | 13F | Assetmark, Inc | 325 | 0,00 | 21 | 0,00 | ||||
| 2025-07-25 | 13F | Cwm, Llc | 3.431 | 0,03 | 0 | |||||
| 2025-08-12 | 13F | BlackRock, Inc. | 663 | 0,00 | 42 | 0,00 | ||||
| 2025-07-30 | 13F | Pacific Sun Financial Corp | 5.618 | -7,03 | 360 | -6,01 | ||||
| 2025-04-29 | 13F | Strategic Blueprint, LLC | 0 | -100,00 | 0 | |||||
| 2025-08-12 | 13F | Change Path, LLC | 15.333 | -14,34 | 983 | -13,48 | ||||
| 2025-07-17 | 13F | Robbins Farley Llc | 3 | 0,00 | 0 | |||||
| 2025-08-11 | 13F | Blue Bell Private Wealth Management, Llc | 21 | 0,00 | 1 | 0,00 | ||||
| 2025-08-14 | 13F/A | Rockefeller Capital Management L.P. | 10.000 | 0,00 | 641 | 1,10 | ||||
| 2025-08-15 | 13F | Kestra Advisory Services, LLC | 5.970 | -12,97 | 383 | -12,18 | ||||
| 2025-08-08 | 13F | Cetera Investment Advisers | 20.398 | -3,41 | 1.308 | -2,39 | ||||
| 2025-08-07 | 13F | LOM Asset Management Ltd | 300 | 0 | ||||||
| 2025-08-14 | 13F | IHT Wealth Management, LLC | 15.339 | -1,37 | 983 | -0,30 | ||||
| 2025-08-12 | 13F | Steward Partners Investment Advisory, Llc | 825 | 1,73 | 53 | 1,96 | ||||
| 2025-08-14 | 13F | Susquehanna International Group, Llp | 6.498 | 25,98 | 417 | 27,22 | ||||
| 2025-08-11 | 13F | HighTower Advisors, LLC | 6.886 | 0,35 | 441 | 1,38 | ||||
| 2025-08-13 | 13F | VestGen Advisors, LLC | 4.704 | -6,85 | 313 | -2,50 | ||||
| 2025-07-02 | 13F | Capital Market Strategies LLC | 3.627 | -2,68 | 232 | -1,69 | ||||
| 2025-08-04 | 13F | Flagship Harbor Advisors, Llc | 5.100 | 0,00 | 327 | 0,93 | ||||
| 2025-07-11 | 13F | First PREMIER Bank | 670 | 0,00 | 0 | |||||
| 2025-07-10 | 13F | Wealth Enhancement Advisory Services, Llc | 4.751 | -34,40 | 312 | -32,24 | ||||
| 2025-08-13 | 13F | Millstone Evans Group, LLC | 1.684 | 0,00 | 108 | 0,94 | ||||
| 2025-08-15 | 13F | Morgan Stanley | 191.173 | -0,87 | 12.254 | 0,16 | ||||
| 2025-08-14 | 13F | Abbot Financial Management, Inc. | 12.725 | -3,60 | 816 | -2,63 | ||||
| 2025-08-11 | 13F | Banque Cantonale Vaudoise | 530 | 0,00 | 0 | |||||
| 2025-08-13 | 13F | GeoWealth Management, LLC | 2.832 | -5,35 | 182 | -4,23 | ||||
| 2025-04-21 | 13F | Ronald Blue Trust, Inc. | 0 | -100,00 | 0 | -100,00 | ||||
| 2025-07-22 | 13F | Penobscot Investment Management Company, Inc. | 19.450 | 0,00 | 1.247 | 1,05 | ||||
| 2025-07-08 | 13F | Webster Bank, N. A. | 1.670 | 0,00 | 107 | 1,90 | ||||
| 2025-08-12 | 13F | Ameritas Investment Partners, Inc. | 70 | 0,00 | 4 | 0,00 | ||||
| 2025-08-13 | 13F | Northwestern Mutual Wealth Management Co | 3.729 | -2,07 | 239 | -0,83 | ||||
| 2025-07-23 | 13F | Massachusetts Wealth Management | 18.394 | 1,04 | 1.179 | 2,17 | ||||
| 2025-08-13 | 13F | Financial Avengers, Inc. | 200 | 0,00 | 13 | 0,00 | ||||
| 2025-04-01 | 13F | Massmutual Trust Co Fsb/adv | 0 | -100,00 | 0 | |||||
| 2025-07-01 | 13F | Harbor Investment Advisory, Llc | 150 | 0,00 | 10 | 0,00 | ||||
| 2025-08-13 | 13F | Capital Analysts, Inc. | 1.715 | 0,00 | 0 | |||||
| 2025-07-24 | 13F | Blair William & Co/il | 400 | 0,00 | 26 | 0,00 | ||||
| 2025-08-01 | 13F | Envestnet Asset Management Inc | 18.315 | -0,66 | 1.174 | 0,43 | ||||
| 2025-08-14 | 13F | Wells Fargo & Company/mn | 71.729 | -1,21 | 4.598 | -0,20 | ||||
| 2025-07-23 | 13F | Joel Isaacson & Co., LLC | 0 | -100,00 | 0 | |||||
| 2025-08-05 | 13F | Hills Bank & Trust Co | 4.887 | -6,33 | 313 | -5,15 | ||||
| 2025-08-18 | 13F | Hollencrest Capital Management | 516 | 0,00 | 33 | 3,13 | ||||
| 2025-09-04 | 13F/A | Advisor Group Holdings, Inc. | 9.441 | 9,92 | 605 | 11,21 | ||||
| 2025-05-14 | 13F | Mml Investors Services, Llc | 0 | -100,00 | 0 | |||||
| 2025-08-14 | 13F | Royal Bank Of Canada | 71.877 | -4,67 | 4.608 | -3,66 | ||||
| 2025-07-16 | 13F | Dakota Wealth Management | 4.901 | -38,51 | 314 | -37,82 | ||||
| 2025-08-06 | 13F | AE Wealth Management LLC | 600 | 0,00 | 38 | 0,00 | ||||
| 2025-07-08 | 13F | Parallel Advisors, LLC | 87 | 55,36 | 6 | 66,67 | ||||
| 2025-08-25 | 13F/A | Promus Capital, LLC | 282 | 0,00 | 18 | 5,88 | ||||
| 2025-07-18 | 13F | Institute for Wealth Management, LLC. | 20.768 | 0,00 | 1.331 | 1,06 | ||||
| 2025-05-15 | 13F | Pathstone Holdings, LLC | 0 | -100,00 | 0 | |||||
| 2025-08-06 | 13F | Commonwealth Equity Services, Llc | 27.327 | -15,24 | 2 | -50,00 | ||||
| 2025-08-14 | 13F | Comerica Bank | 203 | 0,00 | 13 | 8,33 | ||||
| 2025-08-04 | 13F | Creative Financial Designs Inc /adv | 2.971 | -32,77 | 190 | -32,14 | ||||
| 2025-08-12 | 13F | CIBC Private Wealth Group, LLC | 385 | 0,00 | 25 | 14,29 | ||||
| 2025-07-16 | 13F | Signaturefd, Llc | 213 | 0,00 | 14 | 0,00 | ||||
| 2025-08-14 | 13F | Stifel Financial Corp | 6.974 | -11,13 | 447 | -10,06 | ||||
| 2025-07-15 | 13F | Signet Financial Management, Llc | 4.351 | 3,92 | 279 | 4,91 | ||||
| 2025-08-11 | 13F | Tidemark, LLC | 0 | -100,00 | 0 | -100,00 | ||||
| 2025-08-14 | 13F | UBS Group AG | 75.983 | 3,76 | 4.871 | 4,84 | ||||
| 2025-08-12 | 13F | Global Retirement Partners, LLC | 600 | 0,00 | 38 | -2,56 | ||||
| 2025-08-14 | 13F | GWM Advisors LLC | 541 | 0,74 | 35 | 0,00 | ||||
| 2025-08-14 | 13F | Mariner, LLC | 12.219 | 783 | ||||||
| 2025-08-12 | 13F | Jpmorgan Chase & Co | 501 | -93,56 | 32 | -93,51 | ||||
| 2025-08-08 | 13F | Pnc Financial Services Group, Inc. | 329 | -17,13 | 21 | -16,00 | ||||
| 2025-08-14 | 13F | Fmr Llc | 505 | -15,83 | 32 | -15,79 | ||||
| 2025-07-18 | 13F | Newman Dignan & Sheerar, Inc. | 10.472 | -3,68 | 671 | -2,61 | ||||
| 2025-08-05 | 13F | GPS Wealth Strategies Group, LLC | 605 | 0,17 | 39 | 0,00 | ||||
| 2025-08-12 | 13F | Proequities, Inc. | 0 | 0 | ||||||
| 2025-08-07 | 13F | Beese Fulmer Investment Management, Inc. | 3.400 | 0,00 | 218 | 0,93 | ||||
| 2025-08-14 | 13F | Gerber Kawasaki Wealth & Investment Management | 254.172 | 4,19 | 16.292 | 5,27 | ||||
| 2025-08-06 | 13F | First Horizon Advisors, Inc. | 156 | 0,00 | 10 | 11,11 | ||||
| 2025-07-17 | 13F | Archford Capital Strategies, LLC | 3.669 | -19,22 | 235 | -18,40 | ||||
| 2025-08-05 | 13F | Tsfg, Llc | 200 | 0,00 | 0 | |||||
| 2025-07-25 | 13F | Hemington Wealth Management | 434 | 0,00 | 0 | |||||
| 2025-08-07 | 13F | Allworth Financial LP | 850 | 54 | ||||||
| 2025-08-11 | 13F | Citigroup Inc | 200 | 0,00 | 13 | 0,00 | ||||
| 2025-05-15 | 13F | Citadel Advisors Llc | 0 | -100,00 | 0 | |||||
| 2025-08-14 | 13F | Goldman Sachs Group Inc | 43.188 | 14,69 | 2.768 | 15,91 | ||||
| 2025-08-06 | 13F | North Capital, Inc. | 2 | 0,00 | 0 | |||||
| 2025-08-14 | 13F | Investment House Llc | 7.480 | -6,27 | 479 | -5,34 | ||||
| 2025-08-12 | 13F | Coldstream Capital Management Inc | 0 | -100,00 | 0 | |||||
| 2025-07-30 | 13F | Financial Perspectives, Inc | 350 | 0,00 | 22 | 0,00 | ||||
| 2025-08-11 | 13F | Cornerstone Planning Group LLC | 164 | 0,00 | 11 | 11,11 | ||||
| 2025-05-15 | 13F | Glenmede Trust Co Na | 1.860 | 0,00 | 118 | -4,88 | ||||
| 2025-07-14 | 13F | Painted Porch Advisors LLC | 0 | -100,00 | 0 | -100,00 | ||||
| 2025-08-12 | 13F | LPL Financial LLC | 76.895 | -7,09 | 4.929 | -6,13 | ||||
| 2025-07-24 | 13F | Us Bancorp \de\ | 16.500 | 0,00 | 1.058 | 1,05 | ||||
| 2025-07-28 | 13F | Harbour Investments, Inc. | 702 | -2,23 | 45 | 0,00 | ||||
| 2025-08-14 | 13F | Two Sigma Investments, Lp | 0 | -100,00 | 0 | |||||
| 2025-07-10 | 13F | YHB Investment Advisors, Inc. | 24.256 | -1,02 | 1.555 | 0,00 | ||||
| 2025-08-14 | 13F | Glenmede Investment Management, LP | 1.860 | 119 | ||||||
| 2025-08-12 | 13F | MAI Capital Management | 125 | 0,00 | 8 | 14,29 | ||||
| 2025-07-28 | 13F | Axxcess Wealth Management, Llc | 4.725 | -10,43 | 303 | -9,58 | ||||
| 2025-07-17 | 13F | Oakworth Capital, Inc. | 611 | 0,00 | 39 | 2,63 | ||||
| 2025-07-28 | 13F | RFG Advisory, LLC | 4.684 | 300 | ||||||
| 2025-08-13 | 13F | Baird Financial Group, Inc. | 3.865 | 0,03 | 248 | 0,82 | ||||
| 2025-08-11 | 13F | NewEdge Wealth, LLC | 15.701 | 0,00 | 1.020 | 2,31 | ||||
| 2025-08-14 | 13F | McIlrath & Eck, LLC | 205 | 0,00 | 13 | 0,00 | ||||
| 2025-08-14 | 13F | Raymond James Financial Inc | 7.937 | -12,74 | 509 | -11,96 | ||||
| 2025-07-17 | 13F | Janney Montgomery Scott LLC | 5.080 | -6,34 | 0 | |||||
| 2025-08-13 | 13F | Jones Financial Companies Lllp | 5.384 | 116,57 | 347 | 117,61 | ||||
| 2025-08-05 | 13F | Bank Of Montreal /can/ | 730 | 0,00 | 47 | 0,00 | ||||
| 2025-08-11 | 13F | One Capital Management, LLC | 12.830 | -46,23 | 822 | -45,67 | ||||
| 2025-08-08 | 13F | Creative Planning | 3.223 | -81,47 | 207 | -81,32 | ||||
| 2025-05-16 | 13F | Coppell Advisory Solutions LLC | 0 | -100,00 | 0 | |||||
| 2025-08-05 | 13F | Huntington National Bank | 0 |
Other Listings
| MX:PBE |