Grundlæggende statistik
| Institutionelle ejere | 133 total, 133 long only, 0 short only, 0 long/short - change of -2,19% MRQ |
| Gennemsnitlig porteføljeallokering | 0.0385 % - change of -21,17% MRQ |
| Institutionelle aktier (lange) | 6.485.090 (ex 13D/G) - change of -0,18MM shares -2,69% MRQ |
| Institutionel værdi (lang) | $ 303.982 USD ($1000) |
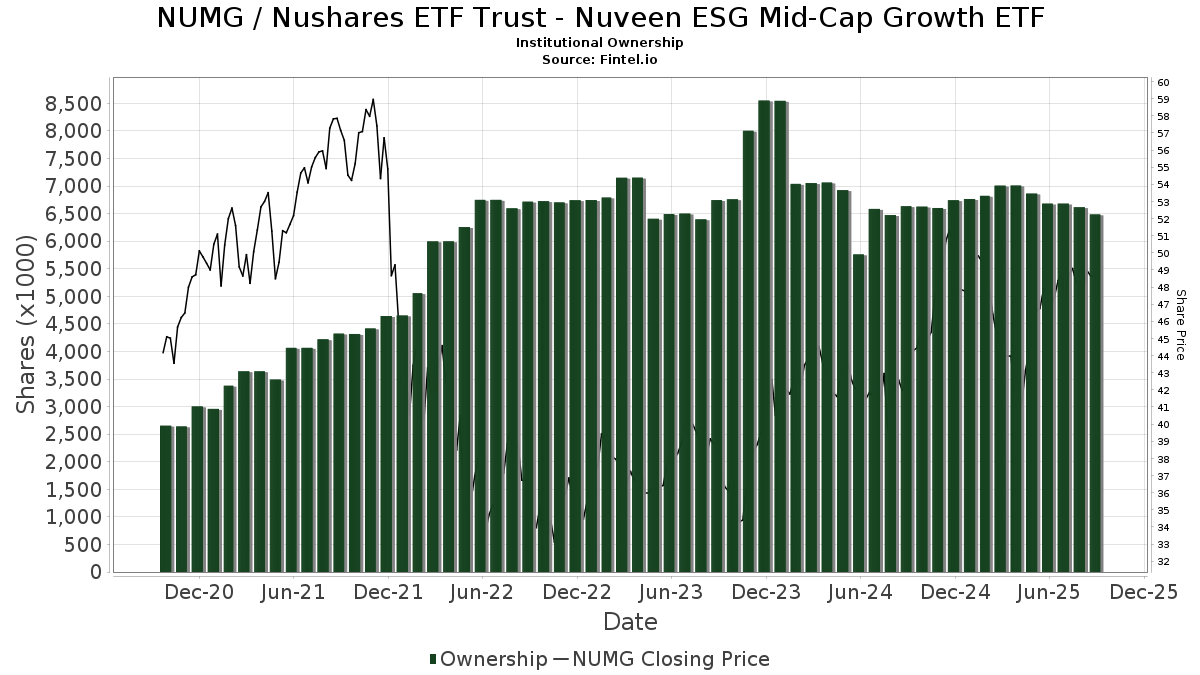
Institutionelt ejerskab og aktionærer
Nushares ETF Trust - Nuveen ESG Mid-Cap Growth ETF (US:NUMG) har 133 institutionelle ejere og aktionærer, der har indsendt 13D/G- eller 13F-formularer til Securities Exchange Commission (SEC). Disse institutioner har i alt 6,485,090 aktier. Største aktionærer omfatter Morgan Stanley, Wells Fargo & Company/mn, Royal Bank Of Canada, Tiaa Trust, National Association, LPL Financial LLC, Bank of New York Mellon Corp, Bank Of America Corp /de/, Ameriprise Financial Inc, UBS Group AG, and AlTi Global, Inc. .
Nushares ETF Trust - Nuveen ESG Mid-Cap Growth ETF (BATS:NUMG) institutionel ejerskabsstruktur viser aktuelle positioner i virksomheden efter institutioner og fonde, samt seneste ændringer i positionsstørrelse. Større aktionærer kan omfatte individuelle investorer, investeringsforeninger, hedgefonde eller institutioner. Skema 13D angiver, at investoren besidder (eller besidder) mere end 5 % af virksomheden og har til hensigt (eller har til hensigt at) aktivt at forfølge en ændring i forretningsstrategi. Skema 13G indikerer en passiv investering på over 5%.
The share price as of September 8, 2025 is 49,20 / share. Previously, on September 9, 2024, the share price was 41,84 / share. This represents an increase of 17,58% over that period.
Fondens stemningsscore
Fund Sentiment Score (fka Ownership Accumulation Score) finder de aktier, der bliver mest købt af fonde. Det er resultatet af en sofistikeret, multi-faktor kvantitativ model, der identificerer virksomheder med de højeste niveauer af institutionel akkumulering. Scoringsmodellen bruger en kombination af den samlede stigning i oplyste ejere, ændringerne i porteføljeallokeringer i disse ejere og andre målinger. Tallet går fra 0 til 100, hvor højere tal indikerer et højere niveau af akkumulering for sine jævnaldrende, og 50 er gennemsnittet.
Opdateringsfrekvens: Dagligt
Se Ownership Explorer, som giver en liste over højest rangerende virksomheder.
Institutionel Put/Call-forhold
Ud over at indberette standardaktie- og gældsudstedelser skal institutter med mere end 100 mill. aktiver under forvaltning også oplyse deres put- og call-optionsbeholdninger. Da salgsoptioner generelt indikerer negativ stemning, og købsoptioner indikerer positiv stemning, kan vi få en fornemmelse af den overordnede institutionelle stemning ved at plotte forholdet mellem put og kald. Diagrammet til højre viser det historiske put/call-forhold for dette instrument.
Brug af Put/Call Ratio som en indikator for investorernes stemning overvinder en af de vigtigste mangler ved at bruge totalt institutionelt ejerskab, som er, at en betydelig mængde af aktiver under forvaltning investeres passivt for at spore indekser. Passivt forvaltede fonde køber typisk ikke optioner, så indikatoren for put/call-forholdet følger mere nøje følelsen af aktivt forvaltede fonde.
13F og NPORT arkivering
Detaljer om 13F-arkivering er gratis. Detaljer om NP-ansøgninger kræver et premium-medlemskab. Grønne rækker angiver nye positioner. Røde rækker angiver lukkede positioner. Klik på linket ikon for at se den fulde transaktionshistorik.
Opgrader
for at låse premium-data op og eksportere til Excel ![]() .
.
| Fil dato | Kilde | Investor | Type | Gennemsnitlig pris (Øst) |
Aktier | Δ Aktier (%) |
Rapporteret Værdi ($1000) |
Δ Værdi (%) |
Port Alloc (%) |
|
|---|---|---|---|---|---|---|---|---|---|---|
| 2025-08-14 | 13F | Comerica Bank | 3.075 | 54,83 | 149 | 74,12 | ||||
| 2025-08-07 | 13F | McClarren Financial Advisors, Inc. | 7.314 | 28,54 | 354 | |||||
| 2025-08-13 | 13F | Millstone Evans Group, LLC | 1.337 | -3,81 | 65 | 8,47 | ||||
| 2025-08-18 | 13F | Front Row Advisors LLC | 505 | 0,00 | 24 | 14,29 | ||||
| 2025-08-08 | 13F | Cetera Investment Advisers | 81.032 | -17,43 | 3.926 | -6,79 | ||||
| 2025-07-18 | 13F | SOA Wealth Advisors, LLC. | 7.723 | -48,77 | 374 | -42,19 | ||||
| 2025-07-18 | 13F | Vicus Capital | 22.267 | 0,18 | 1.079 | 13,12 | ||||
| 2025-08-12 | 13F | LPL Financial LLC | 472.802 | 9,72 | 22.907 | 23,86 | ||||
| 2025-05-05 | 13F | Darden Wealth Group Inc | 0 | -100,00 | 0 | |||||
| 2025-08-08 | 13F | Larson Financial Group LLC | 7.369 | -6,87 | 357 | 5,31 | ||||
| 2025-08-12 | 13F | Proequities, Inc. | 0 | 0 | ||||||
| 2025-07-08 | 13F | Rise Advisors, LLC | 55 | 0,00 | 3 | 0,00 | ||||
| 2025-07-15 | 13F | McAdam, LLC | 4.750 | 230 | ||||||
| 2025-08-06 | 13F | SOUTH STATE Corp | 24 | 0,00 | 1 | 0,00 | ||||
| 2025-08-08 | 13F | ERTS Wealth Advisors, LLC | 0 | -100,00 | 0 | |||||
| 2025-08-11 | 13F | Annis Gardner Whiting Capital Advisors, LLC | 191 | 4,37 | 9 | 28,57 | ||||
| 2025-08-14 | 13F | Bank Of America Corp /de/ | 347.720 | 4,70 | 16.847 | 18,19 | ||||
| 2025-08-13 | 13F | Cerity Partners LLC | 16.031 | 781 | ||||||
| 2025-08-14 | 13F | IHT Wealth Management, LLC | 8.795 | -1,64 | 426 | 11,23 | ||||
| 2025-08-11 | 13F | HighTower Advisors, LLC | 8.981 | -5,12 | 435 | 7,14 | ||||
| 2025-08-07 | 13F | Allworth Financial LP | 1.013 | 0,00 | 49 | 16,67 | ||||
| 2025-08-14 | 13F | UBS Group AG | 224.357 | 8,11 | 10.870 | 22,04 | ||||
| 2025-07-21 | 13F | Empirical Financial Services, LLC d.b.a. Empirical Wealth Management | 6.138 | 17,16 | 297 | 32,59 | ||||
| 2025-07-16 | 13F/A | CX Institutional | 4.751 | -5,90 | 0 | |||||
| 2025-07-16 | 13F | Falcon Wealth Planning | 4.328 | 210 | ||||||
| 2025-05-08 | 13F | Us Financial Advisors, Llc | 14.002 | 4,26 | 601 | -5,66 | ||||
| 2025-08-14 | 13F | CoreCap Advisors, LLC | 340 | 0,00 | 16 | 14,29 | ||||
| 2025-08-12 | 13F | Virtu Financial LLC | 0 | -100,00 | 0 | |||||
| 2025-08-12 | 13F | O'shaughnessy Asset Management, Llc | 2.080 | -67,08 | 101 | -63,10 | ||||
| 2025-08-07 | 13F | PFG Advisors | 4.796 | -1,66 | 232 | 11,00 | ||||
| 2025-08-14 | 13F | Susquehanna International Group, Llp | 0 | -100,00 | 0 | |||||
| 2025-08-13 | 13F | SageView Advisory Group, LLC | 12.050 | 0,00 | 595 | 15,09 | ||||
| 2025-07-29 | 13F | Stratos Wealth Partners, LTD. | 5.030 | 244 | ||||||
| 2025-08-13 | 13F | Jones Financial Companies Lllp | 55.010 | 9,87 | 2.641 | 23,01 | ||||
| 2025-08-05 | 13F | GPS Wealth Strategies Group, LLC | 217 | 0,00 | 11 | 11,11 | ||||
| 2025-05-15 | 13F | Citadel Advisors Llc | 0 | -100,00 | 0 | |||||
| 2025-07-18 | 13F | Truist Financial Corp | 9.481 | 0,43 | 459 | 13,33 | ||||
| 2025-08-15 | 13F | Resources Management Corp /ct/ /adv | 0 | -100,00 | 0 | |||||
| 2025-08-14 | 13F | Abound Financial, Llc | 0 | -100,00 | 0 | |||||
| 2025-07-09 | 13F | Dynamic Advisor Solutions LLC | 22.800 | -19,01 | 1.105 | -8,61 | ||||
| 2025-08-08 | 13F | Pnc Financial Services Group, Inc. | 39.789 | -11,65 | 1.928 | -0,26 | ||||
| 2025-08-14 | 13F | Archetype Wealth Partners | 4.804 | -3,55 | 0 | |||||
| 2025-04-21 | 13F | Nelson, Van Denburg & Campbell Wealth Management Group, LLC | 0 | -100,00 | 0 | |||||
| 2025-08-05 | 13F | Dunhill Financial, LLC | 2.995 | 1,08 | 145 | 14,17 | ||||
| 2025-08-12 | 13F | MAI Capital Management | 409 | 0,00 | 20 | 11,76 | ||||
| 2025-07-30 | 13F | Fingerlakes Wealth Management, Inc. | 8.757 | 19,26 | 424 | 34,60 | ||||
| 2025-08-08 | 13F | Creative Planning | 77.496 | -0,02 | 3.755 | 12,87 | ||||
| 2025-08-14 | 13F | Goldman Sachs Group Inc | 37.521 | 0,68 | 1.818 | 13,63 | ||||
| 2025-07-17 | 13F | Neumann Capital Management, LLC | 11.180 | 0,00 | 542 | 12,94 | ||||
| 2025-05-09 | 13F | Thoroughbred Financial Services, Llc | 0 | -100,00 | 0 | |||||
| 2025-07-15 | 13F | RTD Financial Advisors, Inc. | 16.291 | -22,47 | 789 | -12,43 | ||||
| 2025-07-31 | 13F | Cambridge Investment Research Advisors, Inc. | 13.844 | -5,46 | 1 | |||||
| 2025-08-14 | 13F | Mercer Global Advisors Inc /adv | 11.089 | 108,40 | 537 | 135,53 | ||||
| 2025-04-28 | 13F | Money Design Co.,Ltd. | 0 | -100,00 | 0 | |||||
| 2025-07-08 | 13F | Parallel Advisors, LLC | 418 | 0,00 | 20 | 17,65 | ||||
| 2025-08-14 | 13F | Raymond James Financial Inc | 104.906 | -1,31 | 5.083 | 11,40 | ||||
| 2025-05-09 | 13F | Avalon Trust Co | 0 | -100,00 | 0 | |||||
| 2025-08-05 | 13F | Tiaa Trust, National Association | 498.599 | -17,26 | 24.157 | -6,60 | ||||
| 2025-04-16 | 13F | Sound Stewardship, LLC | 0 | -100,00 | 0 | |||||
| 2025-08-01 | 13F | Motco | 1.248 | 0,00 | 61 | 13,21 | ||||
| 2025-08-07 | 13F | CENTRAL TRUST Co | 10.207 | 19,62 | 495 | 34,97 | ||||
| 2025-08-07 | 13F | LFA - Lugano Financial Advisors SA | 0 | -100,00 | 0 | |||||
| 2025-08-13 | 13F | Beacon Pointe Advisors, LLC | 37.704 | 5,70 | 1.827 | 19,35 | ||||
| 2025-07-25 | 13F | Pandora Wealth, Inc. | 20 | 0,00 | 1 | |||||
| 2025-04-29 | 13F | Financial Network Wealth Management LLC | 15.748 | -50,15 | 1 | -100,00 | ||||
| 2025-08-06 | 13F | Simmons Bank | 8.328 | -2,35 | 403 | 10,11 | ||||
| 2025-07-24 | 13F | Us Bancorp \de\ | 1.523 | 0,00 | 74 | 12,31 | ||||
| 2025-08-12 | 13F | AlphaCore Capital LLC | 0 | -100,00 | 0 | |||||
| 2025-08-13 | 13F | Northwestern Mutual Wealth Management Co | 25.369 | -14,93 | 1.229 | -3,91 | ||||
| 2025-07-28 | 13F | Revolve Wealth Partners, LLC | 24.482 | 3,15 | 1.186 | 16,50 | ||||
| 2025-08-13 | 13F | WCG Wealth Advisors LLC | 26.885 | -3,10 | 1.303 | 9,41 | ||||
| 2025-07-29 | 13F | Aire Advisors, Llc | 5.409 | 0,00 | 262 | 12,93 | ||||
| 2025-04-29 | 13F | Values Added Financial LLC | 0 | -100,00 | 0 | |||||
| 2025-08-14 | 13F | Fmr Llc | 262 | -49,32 | 13 | -45,45 | ||||
| 2025-08-04 | 13F | Creative Financial Designs Inc /adv | 140 | 0,00 | 7 | 0,00 | ||||
| 2025-05-14 | 13F | Retirement Capital Strategies | 0 | -100,00 | 0 | |||||
| 2025-08-05 | 13F | Huntington National Bank | 154 | |||||||
| 2025-08-13 | 13F | Flow Traders U.s. Llc | 13.048 | 1 | ||||||
| 2025-07-07 | 13F | Trust Co | 5.845 | -8,64 | 283 | 3,28 | ||||
| 2025-08-26 | 13F/A | Thrivent Financial For Lutherans | 0 | -100,00 | 0 | |||||
| 2025-07-16 | 13F | Evergreen Private Wealth LLC | 7.297 | -15,45 | 354 | -4,59 | ||||
| 2025-08-19 | 13F | Cape Investment Advisory, Inc. | 179 | 18,54 | 9 | 33,33 | ||||
| 2025-08-13 | 13F | Lido Advisors, LLC | 18.270 | -19,27 | 885 | -8,86 | ||||
| 2025-08-11 | 13F | Cornerstone Planning Group LLC | 3.478 | 0,00 | 167 | 16,78 | ||||
| 2025-07-08 | 13F | Nbc Securities, Inc. | 54 | 0,00 | 0 | |||||
| 2025-08-01 | 13F | Envestnet Asset Management Inc | 57.437 | -0,03 | 2.783 | 12,86 | ||||
| 2025-08-06 | 13F | Golden State Wealth Management, LLC | 6.193 | -2,85 | 300 | 9,89 | ||||
| 2025-08-14 | 13F | Bragg Financial Advisors, Inc | 5.358 | 6,06 | 260 | 19,91 | ||||
| 2025-08-14 | 13F | Ameriprise Financial Inc | 268.035 | 30,74 | 12.995 | 47,32 | ||||
| 2025-08-11 | 13F | Private Advisor Group, LLC | 11.031 | -45,31 | 534 | -38,27 | ||||
| 2025-08-12 | 13F | Wood Tarver Financial Group, LLC | 678 | 0,00 | 0 | -100,00 | ||||
| 2025-08-14 | 13F | GWM Advisors LLC | 15.659 | 6,25 | 759 | 19,94 | ||||
| 2025-08-12 | 13F | Cook Wealth Management Group Llc | 0 | -100,00 | 0 | |||||
| 2025-08-11 | 13F | Aptus Capital Advisors, LLC | 107 | 64,62 | 5 | 150,00 | ||||
| 2025-07-11 | 13F/A | Umb Bank N A/mo | 1.383 | -36,21 | 67 | -27,96 | ||||
| 2025-07-30 | 13F | Whittier Trust Co Of Nevada Inc | 61.491 | -1,51 | 2.979 | 11,24 | ||||
| 2025-08-12 | 13F | Waterloo Capital, L.P. | 0 | -100,00 | 0 | |||||
| 2025-08-14 | 13F | Evergreen Capital Management Llc | 7.165 | 347 | ||||||
| 2025-08-15 | 13F | CI Private Wealth, LLC | 8.265 | 52,63 | 400 | 72,41 | ||||
| 2025-07-31 | 13F | LongView Asset Management LLC | 6.320 | -11,07 | 306 | 0,33 | ||||
| 2025-07-30 | 13F | Whittier Trust Co | 62.623 | -9,29 | 3.034 | 2,43 | ||||
| 2025-08-13 | 13F | Cresset Asset Management, LLC | 6.038 | 0,00 | 293 | 12,74 | ||||
| 2025-07-15 | 13F | Fifth Third Bancorp | 2.760 | 0,00 | 134 | 12,71 | ||||
| 2025-05-14 | 13F | CIBC Private Wealth Group, LLC | 0 | -100,00 | 0 | -100,00 | ||||
| 2025-08-13 | 13F | EverSource Wealth Advisors, LLC | 53 | 0,00 | 3 | 0,00 | ||||
| 2025-09-04 | 13F/A | Advisor Group Holdings, Inc. | 14.699 | -21,56 | 712 | -11,44 | ||||
| 2025-08-14 | 13F | EP Wealth Advisors, Inc. | 2.242 | 109 | ||||||
| 2025-07-25 | 13F | Cwm, Llc | 8.001 | 119,75 | 0 | |||||
| 2025-07-10 | 13F | Wealth Enhancement Advisory Services, Llc | 17.571 | 177,93 | 862 | 218,08 | ||||
| 2025-04-22 | 13F/A | NorthRock Partners, LLC | 0 | -100,00 | 0 | -100,00 | ||||
| 2025-07-31 | 13F | AlTi Global, Inc. | 157.208 | -36,50 | 7.617 | -28,32 | ||||
| 2025-07-22 | 13F | DT Investment Partners, LLC | 110 | -42,11 | 5 | -37,50 | ||||
| 2025-07-08 | 13F | Canandaigua National Bank & Trust Co | 10.244 | 37,10 | 496 | 55,00 | ||||
| 2025-08-12 | 13F | Ameritas Investment Partners, Inc. | 1.628 | 0,00 | 79 | 13,04 | ||||
| 2025-08-07 | 13F | Commerce Bank | 20.034 | -10,36 | 971 | 1,15 | ||||
| 2025-07-15 | 13F | RVW Wealth, LLC | 7.310 | -2,71 | 354 | 9,94 | ||||
| 2025-08-06 | 13F | Commonwealth Equity Services, Llc | 142.475 | 13,38 | 7 | 20,00 | ||||
| 2025-08-14 | 13F | Qube Research & Technologies Ltd | 1.412 | -14,32 | 68 | -2,86 | ||||
| 2025-08-12 | 13F | Coldstream Capital Management Inc | 11.500 | 0,00 | 557 | 12,98 | ||||
| 2025-08-14 | 13F | Atomi Financial Group, Inc. | 4.521 | 219 | ||||||
| 2025-08-14 | 13F | Fiduciary Trust Co | 63.303 | 0,00 | 3.067 | 12,92 | ||||
| 2025-08-14 | 13F | Mml Investors Services, Llc | 5.412 | 12,66 | 0 | |||||
| 2025-07-21 | 13F | Ameritas Advisory Services, LLC | 94.703 | -12,07 | 4.588 | -0,74 | ||||
| 2025-07-21 | 13F | Mirae Asset Global Investments Co., Ltd. | 12.200 | 1,67 | 591 | 14,98 | ||||
| 2025-07-30 | 13F | Crewe Advisors LLC | 306 | 0,00 | 15 | 7,69 | ||||
| 2025-08-06 | 13F | First Horizon Advisors, Inc. | 0 | -100,00 | 0 | |||||
| 2025-08-14 | 13F | Old Mission Capital Llc | 0 | -100,00 | 0 | |||||
| 2025-08-14 | 13F | Wiley Bros.-aintree Capital, Llc | 8.533 | -18,87 | 413 | -8,65 | ||||
| 2025-08-05 | 13F | Bank of New York Mellon Corp | 382.679 | 7,16 | 18.541 | 20,96 | ||||
| 2025-05-09 | 13F | Syntegra Private Wealth Group, LLC | 0 | -100,00 | 0 | |||||
| 2025-07-23 | 13F | High Note Wealth, LLC | 16.775 | -2,60 | 813 | 9,88 | ||||
| 2025-07-25 | 13F | Atria Wealth Solutions, Inc. | 7.745 | -13,36 | 380 | -0,78 | ||||
| 2025-08-12 | 13F | Steward Partners Investment Advisory, Llc | 416 | 0,00 | 20 | 17,65 | ||||
| 2025-07-29 | 13F | Harbor Asset Planning, Inc. | 2.058 | 100 | ||||||
| 2025-08-01 | 13F | Rossby Financial, LCC | 88 | 0,00 | 4 | 33,33 | ||||
| 2025-08-15 | 13F/A | MONECO Advisors, LLC | 0 | -100,00 | 0 | -100,00 | ||||
| 2025-08-14 | 13F | Colony Group, LLC | 7.149 | 9,20 | 346 | 23,57 | ||||
| 2025-07-18 | 13F/A | MJT & Associates Financial Advisory Group, Inc. | 1.071 | -29,63 | 52 | -21,54 | ||||
| 2025-07-24 | 13F | Stonebridge Financial Group, LLC | 0 | -100,00 | 0 | |||||
| 2025-08-14 | 13F | Marshall Investment Management, Llc | 0 | -100,00 | 0 | |||||
| 2025-04-09 | 13F | West Financial Advisors, LLC | 0 | -100,00 | 0 | |||||
| 2025-07-22 | 13F | Merit Financial Group, LLC | 6.276 | 0,00 | 304 | 13,01 | ||||
| 2025-07-11 | 13F | Farther Finance Advisors, LLC | 624 | 0,00 | 30 | 15,38 | ||||
| 2025-07-14 | 13F | AdvisorNet Financial, Inc | 237 | 0,00 | 11 | 10,00 | ||||
| 2025-08-15 | 13F | Morgan Stanley | 1.109.271 | 1,28 | 53.744 | 14,33 | ||||
| 2025-08-14 | 13F | Wells Fargo & Company/mn | 790.108 | 0,39 | 38.281 | 13,33 | ||||
| 2025-08-14 | 13F | Royal Bank Of Canada | 516.582 | -1,50 | 25.029 | 11,19 | ||||
| 2025-08-13 | 13F | IAG Wealth Partners, LLC | 17.412 | -44,78 | 844 | -37,69 | ||||
| 2025-08-15 | 13F | Tower Research Capital LLC (TRC) | 130 | -99,21 | 6 | -99,15 | ||||
| 2025-08-12 | 13F | Global Retirement Partners, LLC | 43 | -52,75 | 2 | -50,00 | ||||
| 2025-07-17 | 13F | Keystone Global Partners, LLC | 0 | -100,00 | 0 | |||||
| 2025-08-06 | 13F | Ipsen Advisor Group LLC | 4.542 | -4,94 | 220 | 7,32 | ||||
| 2025-07-10 | 13F | SK Wealth Management, LLC | 17.370 | -12,56 | 846 | 8,47 | ||||
| 2025-04-25 | 13F | MidAtlantic Capital Management, Inc. | 0 | -100,00 | 0 | |||||
| 2025-08-11 | 13F | Principal Securities, Inc. | 1.175 | 37,43 | 57 | 40,00 | ||||
| 2025-07-24 | 13F | IFP Advisors, Inc | 0 | -100,00 | 0 | |||||
| 2025-07-22 | 13F | Wealthcare Advisory Partners LLC | 4.348 | 211 | ||||||
| 2025-08-12 | 13F | Jpmorgan Chase & Co | 33.939 | -17,96 | 1.644 | -7,38 | ||||
| 2025-08-08 | 13F | Emerald Investment Partners, Llc | 16.299 | -15,02 | 790 | -4,13 | ||||
| 2025-07-24 | 13F | Blair William & Co/il | 913 | -20,95 | 44 | -10,20 | ||||
| 2025-07-24 | 13F | rebel Financial LLC | 22.010 | 1.066 | ||||||
| 2025-08-13 | 13F | Continuum Advisory, LLC | 9.392 | 0,00 | 455 | 12,90 | ||||
| 2025-08-15 | 13F | Urban Financial Advisory Corp | 562 | 0,00 | 27 | 12,50 | ||||
| 2025-07-28 | 13F | Harbour Investments, Inc. | 1.903 | 0,00 | 92 | 13,58 | ||||
| 2025-05-14 | 13F | Jane Street Group, Llc | 0 | -100,00 | 0 | |||||
| 2025-07-18 | 13F | Institute for Wealth Management, LLC. | 11.951 | 39,88 | 579 | 58,20 | ||||
| 2025-07-22 | 13F | Petros Family Wealth, LLC | 8.056 | 390 |