Grundlæggende statistik
| Institutionelle ejere | 45 total, 40 long only, 0 short only, 5 long/short - change of 9,52% MRQ |
| Gennemsnitlig porteføljeallokering | 0.0339 % - change of 55,44% MRQ |
| Institutionelle aktier (lange) | 475.666 (ex 13D/G) - change of -0,08MM shares -14,19% MRQ |
| Institutionel værdi (lang) | $ 32.851 USD ($1000) |
Institutionelt ejerskab og aktionærer
Direxion Shares ETF Trust - Direxion Daily Gold Miners Index Bull 2X Shares (US:NUGT) har 45 institutionelle ejere og aktionærer, der har indsendt 13D/G- eller 13F-formularer til Securities Exchange Commission (SEC). Disse institutioner har i alt 475,666 aktier. Største aktionærer omfatter Susquehanna International Group, Llp, Susquehanna International Group, Llp, Citadel Advisors Llc, Citadel Advisors Llc, Jane Street Group, Llc, Quadrature Capital Ltd, Wolverine Trading, Llc, Wolverine Trading, Llc, Jane Street Group, Llc, and Susquehanna International Group, Llp .
Direxion Shares ETF Trust - Direxion Daily Gold Miners Index Bull 2X Shares (ARCA:NUGT) institutionel ejerskabsstruktur viser aktuelle positioner i virksomheden efter institutioner og fonde, samt seneste ændringer i positionsstørrelse. Større aktionærer kan omfatte individuelle investorer, investeringsforeninger, hedgefonde eller institutioner. Skema 13D angiver, at investoren besidder (eller besidder) mere end 5 % af virksomheden og har til hensigt (eller har til hensigt at) aktivt at forfølge en ændring i forretningsstrategi. Skema 13G indikerer en passiv investering på over 5%.
The share price as of September 9, 2025 is 119,40 / share. Previously, on September 10, 2024, the share price was 43,87 / share. This represents an increase of 172,17% over that period.

Fondens stemningsscore
Fund Sentiment Score (fka Ownership Accumulation Score) finder de aktier, der bliver mest købt af fonde. Det er resultatet af en sofistikeret, multi-faktor kvantitativ model, der identificerer virksomheder med de højeste niveauer af institutionel akkumulering. Scoringsmodellen bruger en kombination af den samlede stigning i oplyste ejere, ændringerne i porteføljeallokeringer i disse ejere og andre målinger. Tallet går fra 0 til 100, hvor højere tal indikerer et højere niveau af akkumulering for sine jævnaldrende, og 50 er gennemsnittet.
Opdateringsfrekvens: Dagligt
Se Ownership Explorer, som giver en liste over højest rangerende virksomheder.
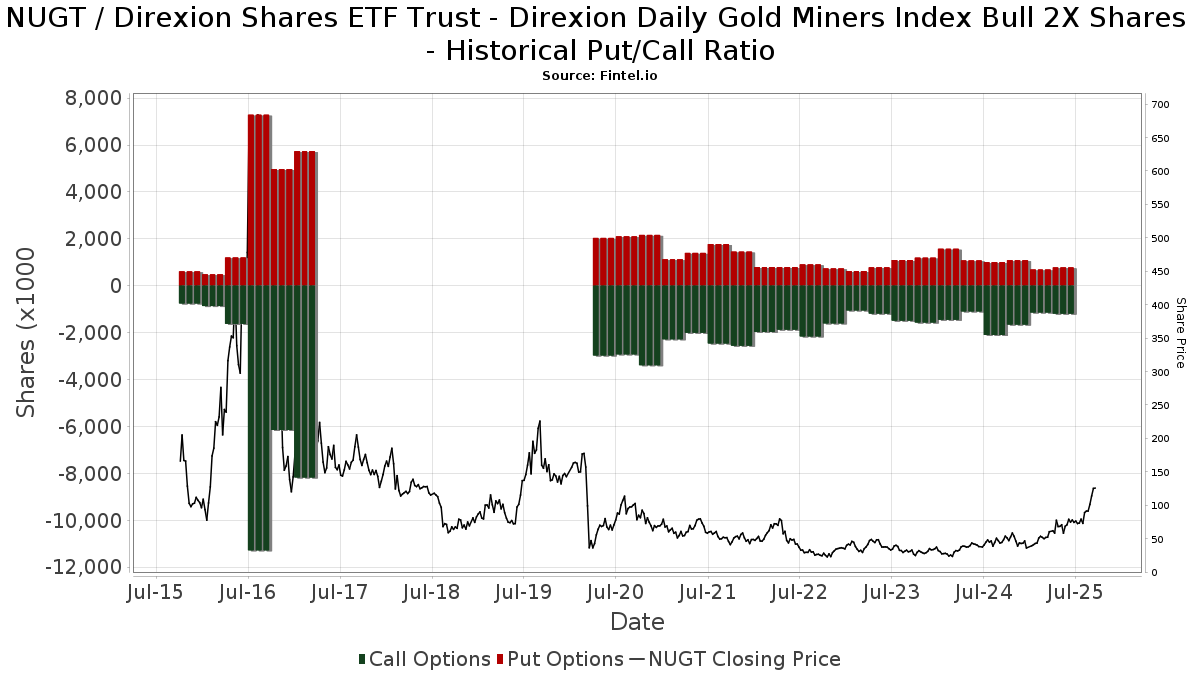
Institutionel Put/Call-forhold
Ud over at indberette standardaktie- og gældsudstedelser skal institutter med mere end 100 mill. aktiver under forvaltning også oplyse deres put- og call-optionsbeholdninger. Da salgsoptioner generelt indikerer negativ stemning, og købsoptioner indikerer positiv stemning, kan vi få en fornemmelse af den overordnede institutionelle stemning ved at plotte forholdet mellem put og kald. Diagrammet til højre viser det historiske put/call-forhold for dette instrument.
Brug af Put/Call Ratio som en indikator for investorernes stemning overvinder en af de vigtigste mangler ved at bruge totalt institutionelt ejerskab, som er, at en betydelig mængde af aktiver under forvaltning investeres passivt for at spore indekser. Passivt forvaltede fonde køber typisk ikke optioner, så indikatoren for put/call-forholdet følger mere nøje følelsen af aktivt forvaltede fonde.
13F og NPORT arkivering
Detaljer om 13F-arkivering er gratis. Detaljer om NP-ansøgninger kræver et premium-medlemskab. Grønne rækker angiver nye positioner. Røde rækker angiver lukkede positioner. Klik på linket ikon for at se den fulde transaktionshistorik.
Opgrader
for at låse premium-data op og eksportere til Excel ![]() .
.
| Fil dato | Kilde | Investor | Type | Gennemsnitlig pris (Øst) |
Aktier | Δ Aktier (%) |
Rapporteret Værdi ($1000) |
Δ Værdi (%) |
Port Alloc (%) |
|
|---|---|---|---|---|---|---|---|---|---|---|
| 2025-08-13 | 13F | Quadrature Capital Ltd | 156.001 | 11.605 | ||||||
| 2025-08-14 | 13F | Harvest Investment Services, LLC | 3.132 | 233 | ||||||
| 2025-04-22 | 13F | PFG Investments, LLC | 0 | -100,00 | 0 | |||||
| 2025-08-06 | 13F | AE Wealth Management LLC | 934 | 0,00 | 69 | 18,97 | ||||
| 2025-08-14 | 13F | UBS Group AG | 1.000 | -80,45 | 74 | -76,66 | ||||
| 2025-05-12 | 13F | Fmr Llc | 0 | -100,00 | 0 | |||||
| 2025-07-16 | 13F | Strategic Investment Solutions, Inc. /IL | 170 | 13 | ||||||
| 2025-08-27 | 13F/A | Squarepoint Ops LLC | Call | 0 | -100,00 | 0 | -100,00 | |||
| 2025-08-14 | 13F | Caption Management, LLC | Call | 0 | -100,00 | 0 | -100,00 | |||
| 2025-08-14 | 13F | Caption Management, LLC | Put | 0 | -100,00 | 0 | -100,00 | |||
| 2025-08-06 | 13F | SOUTH STATE Corp | 0 | -100,00 | 0 | |||||
| 2025-08-14 | 13F | Caption Management, LLC | 600 | 45 | ||||||
| 2025-08-12 | 13F | Jpmorgan Chase & Co | 1.905 | -10,06 | 142 | 7,63 | ||||
| 2025-08-14 | 13F | Two Sigma Securities, Llc | 11.458 | -24,71 | 852 | -9,95 | ||||
| 2025-05-13 | 13F/A | Claudia M.p. Batlle, Crp (r) Llc | 0 | -100,00 | 0 | -100,00 | ||||
| 2025-08-14 | 13F | Federation des caisses Desjardins du Quebec | 355 | -7,79 | 26 | 13,04 | ||||
| 2025-08-14 | 13F | Susquehanna International Group, Llp | 56.280 | -55,62 | 4.184 | -46,89 | ||||
| 2025-08-05 | 13F | Huntington National Bank | 208 | 20,23 | ||||||
| 2025-08-13 | 13F | Northwestern Mutual Wealth Management Co | 148 | -39,09 | 11 | -26,67 | ||||
| 2025-08-12 | 13F | Virtu Financial LLC | 12.091 | -43,94 | 1 | -100,00 | ||||
| 2025-08-08 | 13F | SBI Securities Co., Ltd. | 19.747 | -0,40 | 1.468 | 19,17 | ||||
| 2025-05-15 | 13F | Hrt Financial Lp | 0 | -100,00 | 0 | |||||
| 2025-08-14 | 13F | Bank Of America Corp /de/ | 5 | -90,00 | 0 | -100,00 | ||||
| 2025-08-05 | 13F | Simplex Trading, Llc | 13.508 | 1 | ||||||
| 2025-08-14 | 13F | Optiver Holding B.V. | 0 | -100,00 | 0 | |||||
| 2025-08-19 | 13F | Newbridge Financial Services Group, Inc. | 335 | 0,00 | 25 | 20,00 | ||||
| 2025-08-14 | 13F | Headlands Technologies LLC | 856 | -48,56 | 64 | -38,83 | ||||
| 2025-08-14 | 13F | Raymond James Financial Inc | 950 | 71 | ||||||
| 2025-08-13 | 13F | EverSource Wealth Advisors, LLC | 200 | -52,38 | 15 | -46,15 | ||||
| 2025-08-14 | 13F | Susquehanna International Group, Llp | Call | 643.400 | -0,83 | 47.830 | 18,68 | |||
| 2025-08-14 | 13F | Susquehanna International Group, Llp | Put | 320.300 | -4,76 | 23.811 | 13,98 | |||
| 2025-08-05 | 13F | Carolinas Wealth Consulting Llc | 0 | -100,00 | 0 | -100,00 | ||||
| 2025-08-11 | 13F | HighTower Advisors, LLC | 7.730 | 23,66 | 575 | 47,94 | ||||
| 2025-07-30 | 13F | Insight Advisors, LLC/ PA | 0 | -100,00 | 0 | |||||
| 2025-08-12 | 13F | Boreal Capital Management LLC | 130 | 10 | ||||||
| 2025-08-15 | 13F | Morgan Stanley | 2.652 | -65,37 | 197 | -58,53 | ||||
| 2025-08-18 | 13F | Wolverine Trading, Llc | 10.566 | 747 | ||||||
| 2025-08-18 | 13F | Wolverine Trading, Llc | Call | 115.200 | 8.141 | |||||
| 2025-08-15 | 13F | Tower Research Capital LLC (TRC) | 878 | 473,86 | 65 | 622,22 | ||||
| 2025-05-15 | 13F | Tudor Investment Corp Et Al | 0 | -100,00 | 0 | |||||
| 2025-08-14 | 13F | Jane Street Group, Llc | Put | 54.300 | -31,09 | 4.037 | -17,55 | |||
| 2025-08-14 | 13F | Jane Street Group, Llc | Call | 156.400 | -6,07 | 11.627 | 12,42 | |||
| 2025-08-27 | 13F/A | Squarepoint Ops LLC | 12.195 | 6,16 | 907 | 27,07 | ||||
| 2025-07-24 | 13F | Ronald Blue Trust, Inc. | 10 | 0,00 | 1 | |||||
| 2025-07-30 | 13F | FNY Investment Advisers, LLC | 7.500 | 1 | ||||||
| 2025-08-14 | 13F | Citadel Advisors Llc | Put | 289.600 | 42,31 | 21.529 | 70,30 | |||
| 2025-08-14 | 13F | Gordian Capital Singapore Pte Ltd | 1 | 0 | ||||||
| 2025-08-01 | 13F | Belvedere Trading LLC | 0 | -100,00 | 0 | |||||
| 2025-08-04 | 13F | Savvy Advisors, Inc. | 6.700 | 498 | ||||||
| 2025-07-31 | 13F | 180 Wealth Advisors, Llc | 4.361 | -35,32 | 324 | -22,49 | ||||
| 2025-08-14 | 13F | Citadel Advisors Llc | Call | 269.600 | 16,91 | 20.042 | 39,92 | |||
| 2025-08-14 | 13F | Citadel Advisors Llc | 46.463 | -1,91 | 3.454 | 17,40 | ||||
| 2025-08-18 | 13F | Wolverine Trading, Llc | Put | 97.800 | 6.912 | |||||
| 2025-08-08 | 13F | Gts Securities Llc | 0 | -100,00 | 0 | |||||
| 2025-08-27 | 13F/A | Squarepoint Ops LLC | Put | 18.900 | 0,00 | 1.405 | 19,68 | |||
| 2025-07-15 | 13F | North Star Investment Management Corp. | 202 | 0,00 | 15 | 25,00 | ||||
| 2025-08-14 | 13F | Royal Bank Of Canada | 123 | 0,00 | 9 | 12,50 | ||||
| 2025-08-14 | 13F | Qube Research & Technologies Ltd | 13.314 | 990 | ||||||
| 2025-08-13 | 13F | Jump Financial, LLC | 0 | -100,00 | 0 | |||||
| 2025-09-04 | 13F/A | Advisor Group Holdings, Inc. | 2 | -99,60 | 0 | -100,00 | ||||
| 2025-07-28 | 13F | Kiker Wealth Management, LLC | 0 | -100,00 | 0 | |||||
| 2025-08-14 | 13F | Millennium Management Llc | 4.280 | 318 | ||||||
| 2025-08-19 | 13F | Cape Investment Advisory, Inc. | 2 | 0,00 | 0 | |||||
| 2025-07-28 | 13F | Harbour Investments, Inc. | 4.197 | -36,58 | 312 | -24,09 | ||||
| 2025-08-18 | 13F | Hollencrest Capital Management | 600 | -18,92 | 45 | -2,22 | ||||
| 2025-07-22 | 13F | IMC-Chicago, LLC | 0 | -100,00 | 0 | |||||
| 2025-08-05 | 13F | Bank Of Montreal /can/ | 302 | 3,07 | 22 | 22,22 | ||||
| 2025-08-13 | 13F | Crosspoint Financial, Llc | 3.800 | 282 | ||||||
| 2025-08-12 | 13F | Proequities, Inc. | 0 | 0 | ||||||
| 2025-05-14 | 13F | Caitlin John, LLC | 0 | -100,00 | 0 | |||||
| 2025-05-15 | 13F | Parallax Volatility Advisers, L.P. | Put | 0 | -100,00 | 0 | ||||
| 2025-08-08 | 13F | Beacon Harbor Wealth Advisors, Inc. | 0 | -100,00 | 0 | |||||
| 2025-05-15 | 13F | Parallax Volatility Advisers, L.P. | Call | 0 | -100,00 | 0 | ||||
| 2025-08-05 | 13F | Optivise Advisory Services LLC | 6.192 | -16,46 | 460 | 0,00 | ||||
| 2025-08-14 | 13F | Jane Street Group, Llc | 59.739 | 332,89 | 4.441 | 418,09 | ||||
| 2025-08-13 | 13F | StoneX Group Inc. | 0 | -100,00 | 0 | -100,00 | ||||
| 2025-07-24 | 13F | IFP Advisors, Inc | 150 | 11 | ||||||
| 2025-07-07 | 13F | Thurston, Springer, Miller, Herd & Titak, Inc. | 3.902 | 75,13 | 290 | 110,14 |