Grundlæggende statistik
| Institutionelle ejere | 114 total, 114 long only, 0 short only, 0 long/short - change of -2,56% MRQ |
| Gennemsnitlig porteføljeallokering | 0.1865 % - change of -36,30% MRQ |
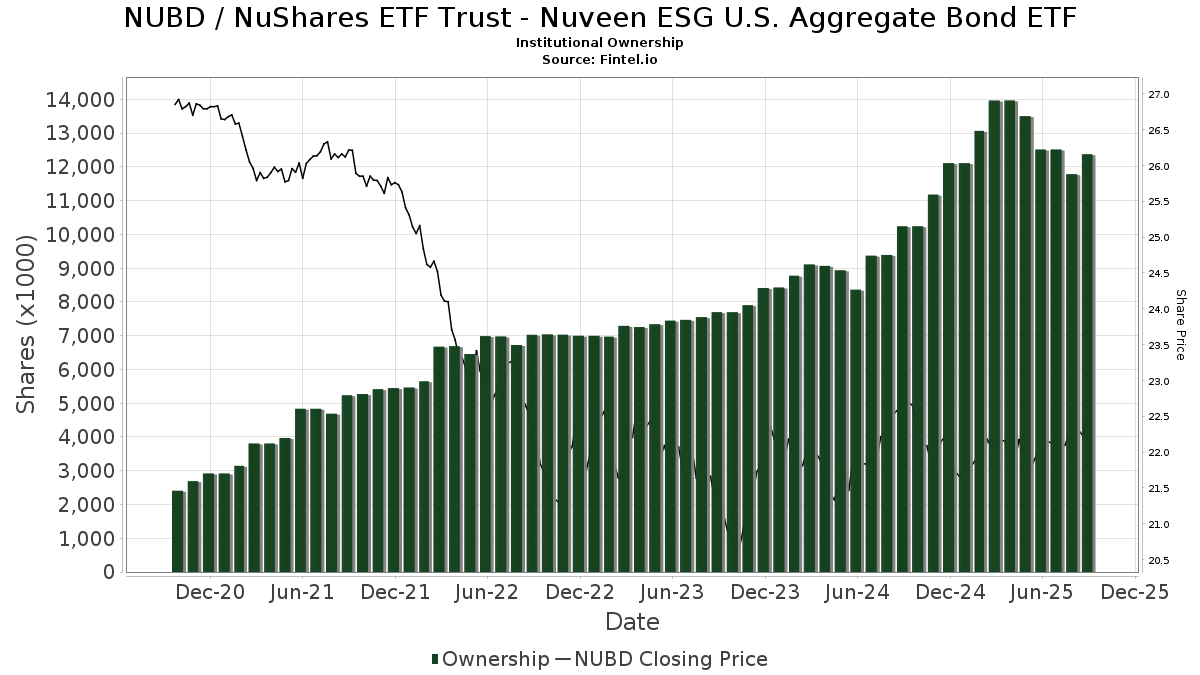
| Institutionelle aktier (lange) | 12.374.117 (ex 13D/G) - change of -0,14MM shares -1,12% MRQ |
| Institutionel værdi (lang) | $ 239.332 USD ($1000) |
Institutionelt ejerskab og aktionærer
NuShares ETF Trust - Nuveen ESG U.S. Aggregate Bond ETF (US:NUBD) har 114 institutionelle ejere og aktionærer, der har indsendt 13D/G- eller 13F-formularer til Securities Exchange Commission (SEC). Disse institutioner har i alt 12,374,117 aktier. Største aktionærer omfatter Morgan Stanley, First Pacific Financial, Cambridge Investment Research Advisors, Inc., Vestmark Advisory Solutions, Inc., Envestnet Portfolio Solutions, Inc., Bank of New York Mellon Corp, Envestnet Asset Management Inc, LPL Financial LLC, WCG Wealth Advisors LLC, and Garrett Investment Advisors LLC .
NuShares ETF Trust - Nuveen ESG U.S. Aggregate Bond ETF (ARCA:NUBD) institutionel ejerskabsstruktur viser aktuelle positioner i virksomheden efter institutioner og fonde, samt seneste ændringer i positionsstørrelse. Større aktionærer kan omfatte individuelle investorer, investeringsforeninger, hedgefonde eller institutioner. Skema 13D angiver, at investoren besidder (eller besidder) mere end 5 % af virksomheden og har til hensigt (eller har til hensigt at) aktivt at forfølge en ændring i forretningsstrategi. Skema 13G indikerer en passiv investering på over 5%.
The share price as of September 8, 2025 is 22,50 / share. Previously, on September 9, 2024, the share price was 22,72 / share. This represents a decline of 0,97% over that period.
Fondens stemningsscore
Fund Sentiment Score (fka Ownership Accumulation Score) finder de aktier, der bliver mest købt af fonde. Det er resultatet af en sofistikeret, multi-faktor kvantitativ model, der identificerer virksomheder med de højeste niveauer af institutionel akkumulering. Scoringsmodellen bruger en kombination af den samlede stigning i oplyste ejere, ændringerne i porteføljeallokeringer i disse ejere og andre målinger. Tallet går fra 0 til 100, hvor højere tal indikerer et højere niveau af akkumulering for sine jævnaldrende, og 50 er gennemsnittet.
Opdateringsfrekvens: Dagligt
Se Ownership Explorer, som giver en liste over højest rangerende virksomheder.
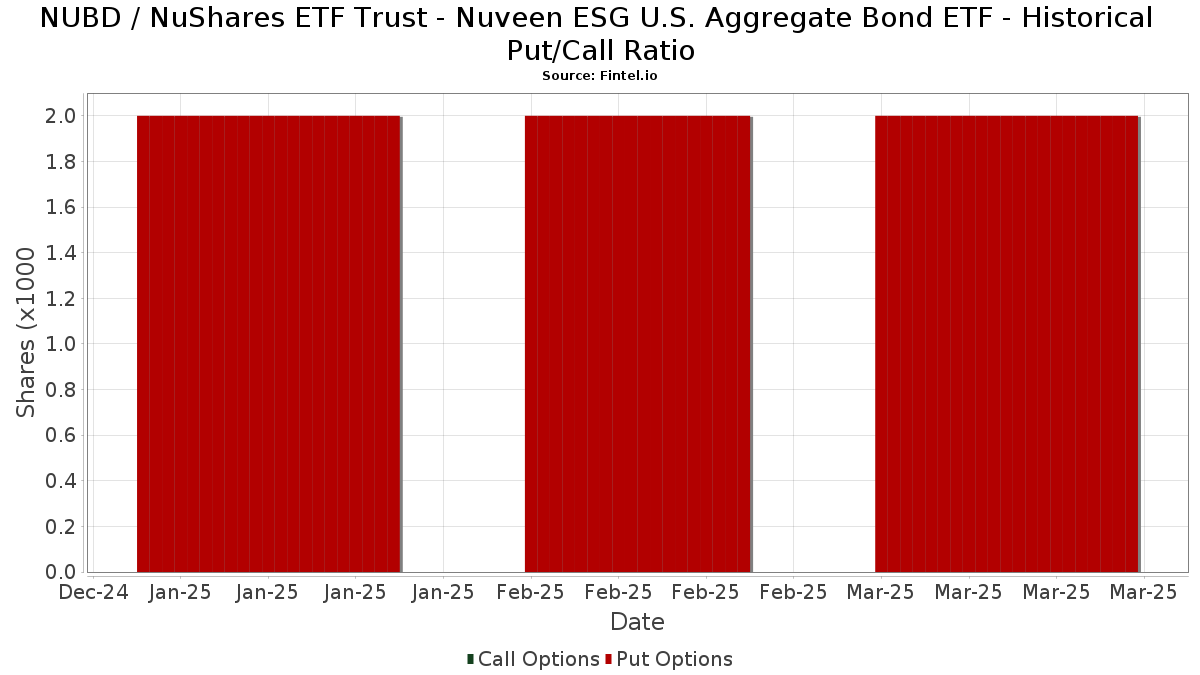
Institutionel Put/Call-forhold
Ud over at indberette standardaktie- og gældsudstedelser skal institutter med mere end 100 mill. aktiver under forvaltning også oplyse deres put- og call-optionsbeholdninger. Da salgsoptioner generelt indikerer negativ stemning, og købsoptioner indikerer positiv stemning, kan vi få en fornemmelse af den overordnede institutionelle stemning ved at plotte forholdet mellem put og kald. Diagrammet til højre viser det historiske put/call-forhold for dette instrument.
Brug af Put/Call Ratio som en indikator for investorernes stemning overvinder en af de vigtigste mangler ved at bruge totalt institutionelt ejerskab, som er, at en betydelig mængde af aktiver under forvaltning investeres passivt for at spore indekser. Passivt forvaltede fonde køber typisk ikke optioner, så indikatoren for put/call-forholdet følger mere nøje følelsen af aktivt forvaltede fonde.
13F og NPORT arkivering
Detaljer om 13F-arkivering er gratis. Detaljer om NP-ansøgninger kræver et premium-medlemskab. Grønne rækker angiver nye positioner. Røde rækker angiver lukkede positioner. Klik på linket ikon for at se den fulde transaktionshistorik.
Opgrader
for at låse premium-data op og eksportere til Excel ![]() .
.
| Fil dato | Kilde | Investor | Type | Gennemsnitlig pris (Øst) |
Aktier | Δ Aktier (%) |
Rapporteret Værdi ($1000) |
Δ Værdi (%) |
Port Alloc (%) |
|
|---|---|---|---|---|---|---|---|---|---|---|
| 2025-07-29 | 13F | Novare Capital Management Llc | 12.072 | 269 | ||||||
| 2025-08-13 | 13F | Millstone Evans Group, LLC | 4.389 | 0,00 | 98 | 0,00 | ||||
| 2025-05-08 | 13F | Natixis Advisors, L.p. | 0 | -100,00 | 0 | |||||
| 2025-08-12 | 13F | Integrated Advisors Network LLC | 14.999 | -36,68 | 334 | -36,57 | ||||
| 2025-08-15 | 13F | Morgan Stanley | 1.498.260 | 7,07 | 33.351 | 7,43 | ||||
| 2025-08-07 | 13F | Allworth Financial LP | 37.012 | -4,84 | 824 | -3,74 | ||||
| 2025-08-12 | 13F | LPL Financial LLC | 481.528 | 6,12 | 10.719 | 6,48 | ||||
| 2025-08-12 | 13F | Proequities, Inc. | 0 | 0 | ||||||
| 2025-07-25 | 13F | Natural Investments, Llc | 20.485 | -19,52 | 0 | |||||
| 2025-08-14 | 13F | Mml Investors Services, Llc | 0 | -100,00 | 0 | |||||
| 2025-07-10 | 13F | Charter Oak Capital Management, LLC | 242.692 | -1,49 | 5.402 | -1,15 | ||||
| 2025-07-23 | 13F | Tcfg Wealth Management, Llc | 9.680 | 215 | ||||||
| 2025-08-14 | 13F | Comerica Bank | 2.440 | 0,99 | 54 | 1,89 | ||||
| 2025-08-01 | 13F | Rossby Financial, LCC | 7.147 | -28,91 | 159 | -28,05 | ||||
| 2025-08-11 | 13F | HighTower Advisors, LLC | 69.481 | -2,20 | 1.547 | -1,90 | ||||
| 2025-08-14 | 13F | IHT Wealth Management, LLC | 14.652 | 0,00 | 326 | 0,31 | ||||
| 2025-07-22 | 13F | Stanich Group LLC | 0 | -100,00 | 0 | |||||
| 2025-08-14 | 13F | UBS Group AG | 81.022 | 0,70 | 1.804 | 1,01 | ||||
| 2025-08-13 | 13F | EverSource Wealth Advisors, LLC | 415 | 0,00 | 9 | 0,00 | ||||
| 2025-07-18 | 13F | First Pacific Financial | 1.054.279 | 0,65 | 23.468 | 0,99 | ||||
| 2025-07-31 | 13F | Silver Oak Advisory Group, Inc. | 118.862 | -0,61 | 3 | 0,00 | ||||
| 2025-07-31 | 13F | Orion Capital Management LLC | 408 | 0,00 | 9 | 0,00 | ||||
| 2025-08-14 | 13F | Bank Of America Corp /de/ | 267.188 | -38,65 | 5.948 | -38,45 | ||||
| 2025-08-14 | 13F | Gerber Kawasaki Wealth & Investment Management | 15.044 | -11,87 | 335 | -11,64 | ||||
| 2025-07-29 | 13F | Stratos Wealth Partners, LTD. | 9.635 | -24,67 | 214 | -24,38 | ||||
| 2025-07-15 | 13F | Garrett Investment Advisors LLC | 317.556 | -0,43 | 7.069 | -0,10 | ||||
| 2025-08-12 | 13F | MAI Capital Management | 613 | 0,00 | 14 | 0,00 | ||||
| 2025-08-08 | 13F | Creative Planning | 13.280 | 0,00 | 296 | 0,34 | ||||
| 2025-08-13 | 13F | SageView Advisory Group, LLC | 36.085 | -2,73 | 795 | -3,28 | ||||
| 2025-07-17 | 13F | Nelson, Van Denburg & Campbell Wealth Management Group, LLC | 10.920 | 1,01 | 243 | 1,67 | ||||
| 2025-08-11 | 13F | Tidemark, LLC | 1.925 | 0,00 | 43 | 0,00 | ||||
| 2025-05-15 | 13F | Diversified Enterprises, LLC | 0 | -100,00 | 0 | |||||
| 2025-07-15 | 13F | Legacy Financial Group LLC | 31.370 | -6,79 | 698 | -6,43 | ||||
| 2025-08-05 | 13F | Mission Wealth Management, Lp | 21.861 | -33,11 | 487 | -32,97 | ||||
| 2025-07-25 | 13F | Envestnet Portfolio Solutions, Inc. | 741.144 | 0,99 | 16.498 | 1,33 | ||||
| 2025-08-14 | 13F | Susquehanna International Group, Llp | 58.361 | 1.299 | ||||||
| 2025-07-23 | 13F | Litman Gregory Asset Management LLC | 55.194 | 0,26 | 1.229 | 0,57 | ||||
| 2025-07-17 | 13F | BayBridge Capital Group, LLC | 30.567 | 13,53 | 680 | 13,90 | ||||
| 2025-08-12 | 13F | Global Retirement Partners, LLC | 4.355 | 0,39 | 97 | 2,13 | ||||
| 2025-08-14 | 13F | Raymond James Financial Inc | 21.370 | -48,93 | 476 | -48,81 | ||||
| 2025-08-14 | 13F | Jane Street Group, Llc | 89.631 | -22,17 | 1.995 | -21,89 | ||||
| 2025-07-11 | 13F | Colorado Capital Management, Inc. | 163.741 | -7,18 | 4 | 0,00 | ||||
| 2025-07-11 | 13F | Westfuller Advisors, LLC | 307.916 | 1,00 | 6.854 | 1,35 | ||||
| 2025-07-24 | 13F | Us Bancorp \de\ | 42.947 | -15,29 | 956 | -15,04 | ||||
| 2025-07-31 | 13F | Cambridge Investment Research Advisors, Inc. | 851.115 | -2,71 | 19 | -5,26 | ||||
| 2025-08-13 | 13F | WCG Wealth Advisors LLC | 369.935 | 18,11 | 8.235 | 18,51 | ||||
| 2025-07-17 | 13F | LexAurum Advisors, LLC | 15.721 | 0,92 | 350 | 1,16 | ||||
| 2025-07-22 | 13F | Miracle Mile Advisors, LLC | 258.840 | -0,29 | 5.762 | 0,05 | ||||
| 2025-08-11 | 13F | Covestor Ltd | 795 | -1,36 | 0 | |||||
| 2025-08-14 | 13F | Mariner, LLC | 34.524 | -1,80 | 769 | -1,41 | ||||
| 2025-07-24 | 13F | Etesian Wealth Advisors, Inc. | 13.867 | 34,67 | 309 | 35,09 | ||||
| 2025-08-06 | 13F | Vestmark Advisory Solutions, Inc. | 799.770 | 130,71 | 17.803 | 131,50 | ||||
| 2025-07-18 | 13F | Lockerman Financial Group, Inc. | 24.561 | -8,27 | 547 | -7,93 | ||||
| 2025-05-12 | 13F | Independent Advisor Alliance | 0 | -100,00 | 0 | |||||
| 2025-07-08 | 13F | Parallel Advisors, LLC | 9.450 | 210 | ||||||
| 2025-08-07 | 13F | Sound View Wealth Advisors Group, LLC | 20.133 | 7,58 | 448 | 7,95 | ||||
| 2025-07-31 | 13F | Wealthfront Advisers Llc | 42.143 | -4,02 | 938 | -3,70 | ||||
| 2025-08-11 | 13F | Private Advisor Group, LLC | 81.611 | -2,49 | 1.817 | -2,16 | ||||
| 2025-08-01 | 13F | Envestnet Asset Management Inc | 540.378 | -4,53 | 12.029 | -4,21 | ||||
| 2025-08-04 | 13F | Quaker Wealth Management, LLC | 2.695 | 60 | ||||||
| 2025-07-31 | 13F | Brinker Capital Investments, LLC | 0 | -100,00 | 0 | -100,00 | ||||
| 2025-08-08 | 13F | Cetera Investment Advisers | 14.036 | 23,72 | 312 | 24,30 | ||||
| 2025-08-11 | 13F | Retirement Capital Strategies | 108.626 | 20,87 | 2.418 | 21,32 | ||||
| 2025-08-14 | 13F | Fmr Llc | 2.158 | -28,26 | 48 | -27,27 | ||||
| 2025-08-08 | 13F | Financial Gravity Companies, Inc. | 3.674 | -10,35 | 82 | -8,99 | ||||
| 2025-04-29 | 13F | Financial Network Wealth Management LLC | 110.776 | -23,22 | 2 | -33,33 | ||||
| 2025-07-28 | 13F | Axxcess Wealth Management, Llc | 48.113 | -2,60 | 1.071 | -2,28 | ||||
| 2025-08-06 | 13F | Walkner Condon Financial Advisors LLC | 21.072 | 0,00 | 469 | 0,43 | ||||
| 2025-07-11 | 13F/A | Umb Bank N A/mo | 84.741 | -1,64 | 1.886 | -1,31 | ||||
| 2025-08-04 | 13F | Assetmark, Inc | 148.439 | 0,51 | 3.304 | 0,85 | ||||
| 2025-07-31 | 13F | LongView Asset Management LLC | 15.214 | -31,88 | 339 | -31,72 | ||||
| 2025-08-11 | 13F | Avantax Planning Partners, Inc. | 22.952 | -30,03 | 511 | -29,85 | ||||
| 2025-08-14 | 13F/A | Rockefeller Capital Management L.P. | 30.755 | 36,60 | 685 | 37,07 | ||||
| 2025-07-29 | 13F | Kelman-Lazarov, Inc. | 30.060 | -0,09 | 669 | 0,30 | ||||
| 2025-05-14 | 13F | Atomi Financial Group, Inc. | 0 | -100,00 | 0 | |||||
| 2025-07-25 | 13F | Midwest Capital Advisors, LLC | 0 | -100,00 | 0 | |||||
| 2025-07-09 | 13F | Lifelong Wealth Advisors, Inc. | 19.098 | 3,09 | 425 | 3,66 | ||||
| 2025-08-11 | 13F | Citigroup Inc | 42.524 | 197,37 | 947 | 198,42 | ||||
| 2025-08-04 | 13F | WNY Asset Management, LLC | 13.117 | -7,65 | 292 | -7,62 | ||||
| 2025-08-05 | 13F | Bank of New York Mellon Corp | 549.543 | 13,68 | 12.233 | 14,06 | ||||
| 2025-08-13 | 13F | Flow Traders U.s. Llc | 0 | -100,00 | 0 | |||||
| 2025-07-10 | 13F | Wealth Enhancement Advisory Services, Llc | 31.356 | -9,52 | 692 | -9,90 | ||||
| 2025-07-25 | 13F | Cwm, Llc | 7.633 | 45,17 | 0 | |||||
| 2025-08-12 | 13F | Ameritas Investment Partners, Inc. | 7.628 | -0,37 | 170 | 0,00 | ||||
| 2025-07-23 | 13F | Proffitt & Goodson Inc | 407 | -6,86 | 9 | 0,00 | ||||
| 2025-08-04 | 13F | Creative Financial Designs Inc /adv | 273 | 0,00 | 6 | 0,00 | ||||
| 2025-09-04 | 13F/A | Advisor Group Holdings, Inc. | 46.796 | 2.736,12 | 1.041 | 2.788,89 | ||||
| 2025-08-04 | 13F | Atria Investments Llc | 39.800 | 886 | ||||||
| 2025-08-12 | 13F | Coldstream Capital Management Inc | 48.367 | 1.077 | ||||||
| 2025-04-23 | 13F | Keudell/Morrison Wealth Management | 0 | -100,00 | 0 | |||||
| 2025-08-07 | 13F | Mayport, Llc | 94.104 | 0,00 | 2.095 | 0,34 | ||||
| 2025-05-02 | 13F | Cable Hill Partners, LLC | 48.367 | 2,26 | 1.073 | 4,08 | ||||
| 2025-05-15 | 13F | Hrt Financial Lp | 0 | -100,00 | 0 | |||||
| 2025-07-22 | 13F | Simplicity Wealth,LLC | 0 | -100,00 | 0 | |||||
| 2025-08-04 | 13F | Quaker Wealth Management, LLC | Put | 0 | -100,00 | 0 | -100,00 | |||
| 2025-08-06 | 13F | Commonwealth Equity Services, Llc | 107.443 | -29,87 | 2 | -33,33 | ||||
| 2025-07-29 | 13F | Stordahl Capital Management, Inc. | 9.920 | -4,07 | 221 | -3,93 | ||||
| 2025-07-29 | 13F | Private Trust Co Na | 2.162 | 30,01 | 48 | 33,33 | ||||
| 2025-08-14 | 13F | Citadel Advisors Llc | 74.988 | -48,65 | 1.669 | -48,47 | ||||
| 2025-07-09 | 13F | Bank of New Hampshire | 780 | 0,00 | 17 | 0,00 | ||||
| 2025-07-30 | 13F | D.a. Davidson & Co. | 33.556 | 34,82 | 747 | 35,14 | ||||
| 2025-07-28 | 13F | Harbour Investments, Inc. | 8.444 | 0,00 | 188 | 0,00 | ||||
| 2025-07-23 | 13F | SGL Investment Advisors, Inc. | 10.718 | 8,44 | 236 | 8,80 | ||||
| 2025-08-01 | 13F | Koss-Olinger Consulting, LLC | 275.279 | -27,91 | 6.128 | -27,67 | ||||
| 2025-07-09 | 13F | Sandbox Financial Partners, LLC | 17.354 | -6,70 | 386 | -6,31 | ||||
| 2025-08-15 | 13F | Captrust Financial Advisors | 0 | -100,00 | 0 | |||||
| 2025-07-16 | 13F | Perigon Wealth Management, LLC | 91.391 | 9,94 | 2.034 | 10,30 | ||||
| 2025-07-25 | 13F | Evolution Advisers, Inc. | 116.036 | 0,00 | 3 | 0,00 | ||||
| 2025-07-29 | 13F | TFC Financial Management | 1.111 | 0,00 | 25 | 0,00 | ||||
| 2025-08-14 | 13F | Wells Fargo & Company/mn | 105.514 | -4,14 | 2.349 | -3,81 | ||||
| 2025-08-08 | 13F | Smithfield Trust Co | 151 | 0,00 | 0 | |||||
| 2025-08-13 | 13F | IAG Wealth Partners, LLC | 5.016 | 51,27 | 112 | 52,05 | ||||
| 2025-08-12 | 13F | Gitterman Wealth Management, LLC | 34.221 | -1,39 | 762 | -1,04 | ||||
| 2025-08-14 | 13F | Colony Group, LLC | 309.097 | 39,63 | 6.881 | 40,09 | ||||
| 2025-04-17 | 13F | Stewardship Advisors, LLC | 0 | -100,00 | 0 | |||||
| 2025-07-22 | 13F | Wealthcare Advisory Partners LLC | 22.362 | -3,51 | 498 | -3,31 | ||||
| 2025-07-14 | 13F | Ai Financial Services Llc | 49.631 | 11,82 | 1.105 | 12,20 | ||||
| 2025-07-18 | 13F/A | MJT & Associates Financial Advisory Group, Inc. | 3.323 | -22,20 | 74 | -22,34 | ||||
| 2025-08-12 | 13F | Jpmorgan Chase & Co | 33.924 | 0,20 | 755 | 0,53 | ||||
| 2025-08-14 | 13F | Royal Bank Of Canada | 146.539 | 6,27 | 3.262 | 6,64 | ||||
| 2025-04-30 | 13F | Sofos Investments, Inc. | 4.098 | -54,99 | 91 | -54,55 | ||||
| 2025-08-13 | 13F | Baird Financial Group, Inc. | 9.602 | 1,02 | 214 | 1,43 | ||||
| 2025-07-18 | 13F | Cantor Fitzgerald Investment Adviser L.p. | 35.492 | -13,02 | 790 | -12,71 | ||||
| 2025-08-14 | 13F | City National Bank Of Florida /msd | 0 | -100,00 | 0 | |||||
| 2025-08-08 | 13F | Emerald Investment Partners, Llc | 248 | 0,00 | 6 | 0,00 | ||||
| 2025-08-07 | 13F | Resources Investment Advisors, LLC. | 29.751 | -11,68 | 662 | -11,38 | ||||
| 2025-08-05 | 13F | Cherry Tree Wealth Management, LLC | 14.825 | -15,65 | 330 | -15,17 | ||||
| 2025-08-11 | 13F | Aptus Capital Advisors, LLC | 436 | 0,00 | 10 | 0,00 | ||||
| 2025-07-02 | 13F | Boston Standard Wealth Management, LLC | 119.617 | 36,14 | 2.663 | 38,91 | ||||
| 2025-07-09 | 13F | Aaron Wealth Advisors LLC | 12.003 | 0,00 | 267 | 0,38 | ||||
| 2025-07-14 | 13F | Park Avenue Securities Llc | 123.392 | -6,34 | 3 | 0,00 |