Grundlæggende statistik
| Institutionelle ejere | 101 total, 101 long only, 0 short only, 0 long/short - change of 4,12% MRQ |
| Gennemsnitlig porteføljeallokering | 0.7589 % - change of 24,43% MRQ |
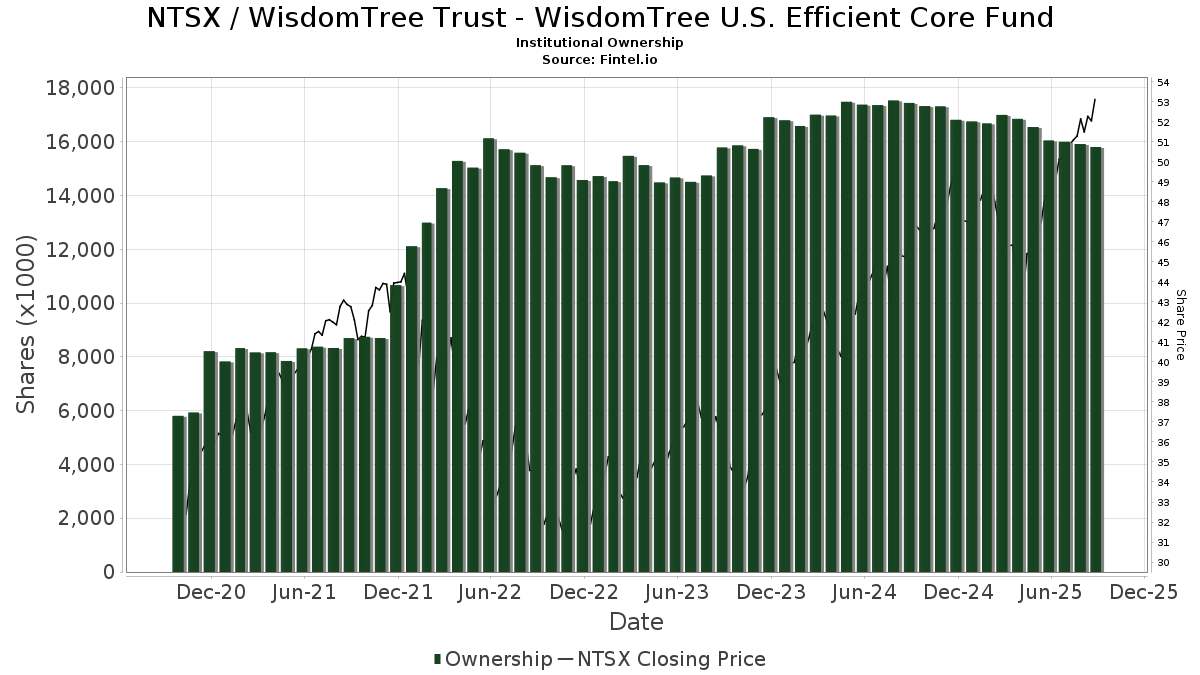
| Institutionelle aktier (lange) | 14.676.326 (ex 13D/G) - change of -0,10MM shares -0,68% MRQ |
| Institutionel værdi (lang) | $ 722.893 USD ($1000) |
Institutionelt ejerskab og aktionærer
WisdomTree Trust - WisdomTree U.S. Efficient Core Fund (US:NTSX) har 101 institutionelle ejere og aktionærer, der har indsendt 13D/G- eller 13F-formularer til Securities Exchange Commission (SEC). Disse institutioner har i alt 14,676,326 aktier. Største aktionærer omfatter Halbert Hargrove Global Advisors, Llc, Cwm, Llc, Wealthcare Advisory Partners LLC, HNDL - Strategy Shares Nasdaq 7 HANDL(TM) Index ETF, Resources Investment Advisors, LLC., Rational Advisors Llc, Cetera Investment Advisers, Professional Financial Advisors, LLC, Wealth Enhancement Advisory Services, Llc, and WJ Interests, LLC .
WisdomTree Trust - WisdomTree U.S. Efficient Core Fund (ARCA:NTSX) institutionel ejerskabsstruktur viser aktuelle positioner i virksomheden efter institutioner og fonde, samt seneste ændringer i positionsstørrelse. Større aktionærer kan omfatte individuelle investorer, investeringsforeninger, hedgefonde eller institutioner. Skema 13D angiver, at investoren besidder (eller besidder) mere end 5 % af virksomheden og har til hensigt (eller har til hensigt at) aktivt at forfølge en ændring i forretningsstrategi. Skema 13G indikerer en passiv investering på over 5%.
The share price as of March 4, 2026 is 55,05 / share. Previously, on March 5, 2025, the share price was 47,05 / share. This represents an increase of 17,00% over that period.
Fondens stemningsscore
Fund Sentiment Score (fka Ownership Accumulation Score) finder de aktier, der bliver mest købt af fonde. Det er resultatet af en sofistikeret, multi-faktor kvantitativ model, der identificerer virksomheder med de højeste niveauer af institutionel akkumulering. Scoringsmodellen bruger en kombination af den samlede stigning i oplyste ejere, ændringerne i porteføljeallokeringer i disse ejere og andre målinger. Tallet går fra 0 til 100, hvor højere tal indikerer et højere niveau af akkumulering for sine jævnaldrende, og 50 er gennemsnittet.
Opdateringsfrekvens: Dagligt
Se Ownership Explorer, som giver en liste over højest rangerende virksomheder.
AI+ Ask Fintel’s AI assistant about WisdomTree Trust - WisdomTree U.S. Efficient Core Fund.
Select a question to share a public post with an AI-crafted answer.
Thinking of good questions…
Institutionel Put/Call-forhold
Ud over at indberette standardaktie- og gældsudstedelser skal institutter med mere end 100 mill. aktiver under forvaltning også oplyse deres put- og call-optionsbeholdninger. Da salgsoptioner generelt indikerer negativ stemning, og købsoptioner indikerer positiv stemning, kan vi få en fornemmelse af den overordnede institutionelle stemning ved at plotte forholdet mellem put og kald. Diagrammet til højre viser det historiske put/call-forhold for dette instrument.
Brug af Put/Call Ratio som en indikator for investorernes stemning overvinder en af de vigtigste mangler ved at bruge totalt institutionelt ejerskab, som er, at en betydelig mængde af aktiver under forvaltning investeres passivt for at spore indekser. Passivt forvaltede fonde køber typisk ikke optioner, så indikatoren for put/call-forholdet følger mere nøje følelsen af aktivt forvaltede fonde.
13F og NPORT arkivering
Detaljer om 13F-arkivering er gratis. Detaljer om NP-ansøgninger kræver et premium-medlemskab. Grønne rækker angiver nye positioner. Røde rækker angiver lukkede positioner. Klik på linket ikon for at se den fulde transaktionshistorik.
Opgrader
for at låse premium-data op og eksportere til Excel ![]() .
.
| Fil dato | Kilde | Investor | Type | Gennemsnitlig pris (Øst) |
Aktier | Δ Aktier (%) |
Rapporteret Værdi ($1000) |
Δ Værdi (%) |
Port Alloc (%) |
|
|---|---|---|---|---|---|---|---|---|---|---|
| 2026-02-09 | 13F | Hartland & Co., LLC | 3.714 | 0,00 | 204 | 1,50 | ||||
| 2026-02-18 | 13F | Sierra Capital LLC | 21.439 | 0,00 | 1 | 0,00 | ||||
| 2026-02-09 | 13F | Harbour Investments, Inc. | 7.123 | 6,17 | 390 | 8,03 | ||||
| 2026-01-26 | 13F | Cwm, Llc | 1.378.802 | 0,80 | 76 | 2,74 | ||||
| 2026-01-29 | 13F | UBS Group AG | 328 | 18 | ||||||
| 2026-01-12 | 13F | Traynor Capital Management, Inc. | 3.887 | 0,00 | 213 | 1,91 | ||||
| 2026-02-14 | 13F | Rockefeller Capital Management L.P. | 17.669 | 0,30 | 968 | 2,00 | ||||
| 2026-01-13 | 13F | CoreCap Advisors, LLC | 1.333 | 0,00 | 73 | 2,82 | ||||
| 2026-02-17 | 13F | Susquehanna International Group, Llp | 7.381 | 405 | ||||||
| 2025-11-14 | 13F | Raymond James Financial Inc | 0 | -100,00 | 0 | |||||
| 2026-02-17 | 13F | Quantinno Capital Management LP | 10.450 | 103,70 | 573 | 107,25 | ||||
| 2026-01-21 | 13F | Flagship Harbor Advisors, Llc | 4.015 | 0,00 | 220 | 1,85 | ||||
| 2025-11-06 | 13F | Financial Advocates Investment Management | 0 | -100,00 | 0 | |||||
| 2026-02-20 | 13F | Sunbelt Securities, Inc. | 14.709 | -4,68 | 806 | -3,12 | ||||
| 2026-02-11 | 13F | J.w. Cole Advisors, Inc. | 6.916 | 0,26 | 379 | 2,16 | ||||
| 2026-02-17 | 13F | Royal Bank Of Canada | 5.240 | 15,75 | 287 | 17,62 | ||||
| 2025-11-14 | 13F | Jane Street Group, Llc | 0 | -100,00 | 0 | |||||
| 2026-02-11 | 13F | O'shaughnessy Asset Management, Llc | 1.684 | 163,54 | 92 | 170,59 | ||||
| 2025-09-26 | NP | HNDL - Strategy Shares Nasdaq 7 HANDL(TM) Index ETF | 744.876 | -18,59 | 37.869 | -8,82 | ||||
| 2026-01-02 | 13F | Insight Wealth Strategies, LLC | 36.578 | 9,02 | 2.005 | 10,78 | ||||
| 2026-02-17 | 13F | Private Advisor Group, LLC | 80.575 | -0,27 | 4.416 | 1,38 | ||||
| 2026-02-13 | 13F | Mariner, LLC | 13.475 | 739 | ||||||
| 2026-02-13 | 13F | Golden State Wealth Management, LLC | 27.491 | 3,19 | 1.507 | 4,87 | ||||
| 2026-01-08 | 13F | Wedmont Private Capital | 10.054 | 0,00 | 558 | 2,39 | ||||
| 2026-02-26 | 13F | 46 Peaks LLC | 428.515 | 23.487 | ||||||
| 2025-11-12 | 13F | Simplex Trading, Llc | 0 | -100,00 | 0 | |||||
| 2026-01-07 | 13F | Innova Wealth Partners | 23.030 | 0,97 | 1.262 | 2,69 | ||||
| 2026-02-17 | 13F | Herold Advisors, Inc. | 25.000 | -3,85 | 1.370 | -2,21 | ||||
| 2026-02-03 | 13F | Morton Capital Management LLC/CA | 32.964 | 0,30 | 1.807 | 1,92 | ||||
| 2026-02-13 | 13F | Kayne Anderson Rudnick Investment Management Llc | 38 | 0,00 | 2 | 0,00 | ||||
| 2026-02-12 | 13F | TopTier Wealth Management, LLC | 4.836 | 265 | ||||||
| 2026-01-08 | 13F | Fermata Advisors, LLC | 123.765 | -1,14 | 6.784 | 0,49 | ||||
| 2026-01-26 | 13F | AE Wealth Management LLC | 8.297 | 32,77 | 455 | 35,12 | ||||
| 2026-02-17 | 13F | Perennial Investment Advisors, LLC | 161.290 | 22,85 | 8.840 | 24,88 | ||||
| 2025-11-12 | 13F | Tounjian Advisory Partners, Llc | 0 | -100,00 | 0 | |||||
| 2026-01-15 | 13F | Professional Financial Advisors, LLC | 488.331 | -1,03 | 26.765 | 0,61 | ||||
| 2026-01-26 | 13F | United Advisor Group, LLC | 12.415 | 3,47 | 680 | 5,10 | ||||
| 2026-02-10 | 13F/A | Northwestern Mutual Wealth Management Co | 1.715 | 95,55 | 94 | 97,87 | ||||
| 2026-01-29 | 13F | Bravias Capital Group, LLC | 104.845 | 9,10 | 5.747 | 10,91 | ||||
| 2026-02-13 | 13F | Wright Wealth Llc | 23.367 | 1.281 | ||||||
| 2025-11-12 | 13F | Transce3nd, LLC | 0 | -100,00 | 0 | |||||
| 2025-11-21 | 13F/A | CIBC Bancorp USA Inc. | 65.913 | 3.554 | ||||||
| 2026-01-14 | 13F | Accurate Wealth Management, LLC | 21.973 | -3,69 | 1.224 | -0,49 | ||||
| 2026-01-16 | 13F | Perigon Wealth Management, LLC | 4.465 | -4,59 | 245 | -3,17 | ||||
| 2026-02-02 | 13F | Chapman Financial Group, Llc | 1.000 | 55 | ||||||
| 2026-02-05 | 13F | Western Wealth Management, LLC | 11.008 | -9,50 | 603 | -7,94 | ||||
| 2026-02-05 | 13F | ORBA Wealth Advisors, L.L.C. | 20.568 | -11,83 | 1.127 | -10,34 | ||||
| 2026-02-17 | 13F | IHT Wealth Management, LLC | 11.896 | 661 | ||||||
| 2026-01-21 | 13F | Leading Edge Financial Planning LLC | 37.547 | 6,09 | 2.058 | 7,81 | ||||
| 2026-01-30 | 13F | Strategic Blueprint, LLC | 4.045 | 222 | ||||||
| 2025-11-14 | 13F | WealthTrak Capital Management LLC | 0 | -100,00 | 0 | |||||
| 2026-02-17 | 13F | Cambria Investment Management, L.P. | 5.179 | 0,00 | 284 | 1,43 | ||||
| 2026-02-06 | 13F | Covestor Ltd | 82 | 0,00 | 0 | |||||
| 2026-02-13 | 13F | Integrated Wealth Concepts LLC | 0 | -100,00 | 0 | |||||
| 2026-01-08 | 13F | Wealth Enhancement Advisory Services, Llc | 477.701 | -0,42 | 26.575 | 2,38 | ||||
| 2026-01-23 | 13F | Halbert Hargrove Global Advisors, Llc | 5.441.149 | -0,70 | 298.229 | 0,94 | ||||
| 2026-02-10 | 13F | REAP Financial Group, LLC | 16.495 | -2,97 | 904 | -1,31 | ||||
| 2026-01-14 | 13F | ACT Advisors, LLC. | 16.108 | -2,96 | 883 | -1,45 | ||||
| 2026-02-06 | 13F | Magnolia Private Wealth, LLC | 4.170 | 0,00 | 229 | 1,79 | ||||
| 2026-02-17 | 13F | Captrust Financial Advisors | 5.697 | 0,00 | 312 | 1,63 | ||||
| 2026-02-06 | 13F | IFP Advisors, Inc | 404 | 0,00 | 22 | 4,76 | ||||
| 2026-01-29 | 13F | Kestra Private Wealth Services, Llc | 4.087 | 0,25 | 224 | 2,28 | ||||
| 2025-11-12 | 13F | Armis Advisers, LLC | 0 | -100,00 | 0 | |||||
| 2026-02-17 | 13F | Old Mission Capital Llc | 0 | -100,00 | 0 | |||||
| 2026-01-16 | 13F | RHS Financial, LLC | 52.410 | -2,57 | 2.873 | -0,97 | ||||
| 2026-02-03 | 13F | Costello Asset Management, INC | 900 | 0,00 | 49 | 2,08 | ||||
| 2026-02-12 | 13F | Commonwealth Equity Services, Llc | 51.035 | -1,68 | 2.797 | 139.750,00 | ||||
| 2026-02-09 | 13F | Wiser Advisor Group LLC | 19 | 0,00 | 1 | 0,00 | ||||
| 2026-02-19 | 13F | CI Private Wealth, LLC | 13.900 | 5,30 | 762 | 7,03 | ||||
| 2026-02-05 | 13F | Cambridge Investment Research Advisors, Inc. | 21.334 | -0,37 | 1 | 0,00 | ||||
| 2025-11-05 | 13F | Envestnet Asset Management Inc | 0 | -100,00 | 0 | |||||
| 2025-11-14 | 13F | Strategic Wealth Partners, Ltd. | 4.767 | 257 | ||||||
| 2026-01-28 | 13F | Geneos Wealth Management Inc. | 0 | -100,00 | 0 | |||||
| 2026-02-02 | 13F | Astra Wealth Partners LLC | 7.800 | 0,00 | 428 | 1,67 | ||||
| 2026-02-10 | 13F | Rational Advisors Llc | 646.098 | -9,47 | 35.413 | -7,98 | ||||
| 2026-02-13 | 13F | Smartleaf Asset Management LLC | 1.355 | 0,00 | 75 | 4,17 | ||||
| 2026-01-26 | 13F | Private Trust Co Na | 3.851 | -19,33 | 211 | -17,90 | ||||
| 2025-11-12 | 13F | Ameriflex Group, Inc. | 0 | -100,00 | 0 | |||||
| 2026-02-11 | 13F | Hilton Head Capital Partners, LLC | 564 | 31 | ||||||
| 2025-11-13 | 13F | Wells Fargo & Company/mn | 0 | -100,00 | 0 | |||||
| 2026-02-17 | 13F | Aqr Capital Management Llc | 243.247 | -1,24 | 13.332 | 0,39 | ||||
| 2026-01-26 | 13F | Merit Financial Group, LLC | 12.773 | 0,30 | 700 | 2,04 | ||||
| 2026-02-05 | 13F | WealthPlan Investment Management, LLC | 18.318 | 1,08 | 1.004 | 2,76 | ||||
| 2026-02-13 | 13F | Ausdal Financial Partners, Inc. | 27.702 | -3,15 | 1.518 | -1,56 | ||||
| 2026-02-10 | 13F | IFG Advisory, LLC | 4.028 | 221 | ||||||
| 2026-02-17 | 13F | Advisor Group Holdings, Inc. | 68.222 | -78,77 | 3.739 | -77,67 | ||||
| 2026-01-16 | 13F | Oregon Pacific Wealth Management, LLC | 15.034 | -5,68 | 824 | -4,07 | ||||
| 2026-01-26 | 13F | WJ Interests, LLC | 463.805 | -6,69 | 25.421 | -5,15 | ||||
| 2026-02-17 | 13F | McCartney Wealth Management LLC | 4.551 | 249 | ||||||
| 2026-02-12 | 13F | Cibc World Markets Corp | 64.467 | -6,31 | 3.533 | 2,58 | ||||
| 2026-03-03 | 13F | NWF Advisory Services Inc. | 0 | -100,00 | 0 | |||||
| 2026-02-04 | 13F | Frontier Asset Management, LLC | 8.927 | 489 | ||||||
| 2026-02-11 | 13F | Howard Bailey Securities, Llc | 24.077 | -86,92 | 1.320 | -86,71 | ||||
| 2026-02-13 | 13F | Kestra Advisory Services, LLC | 0 | -100,00 | 0 | |||||
| 2026-01-16 | 13F | Crewe Advisors LLC | 227 | 0,00 | 12 | 0,00 | ||||
| 2026-01-23 | 13F | Farther Finance Advisors, LLC | 2.594 | 90,18 | 142 | 94,52 | ||||
| 2026-02-17 | 13F | Cetera Investment Advisers | 561.943 | 0,72 | 30.800 | 2,38 | ||||
| 2026-02-17 | 13F | Cardiff Park Advisors, Llc | 4.042 | 0,00 | 222 | 1,84 | ||||
| 2026-02-17 | 13F | Mercer Global Advisors Inc /adv | 8.030 | 0,00 | 440 | 1,85 | ||||
| 2026-02-11 | 13F | LPL Financial LLC | 335.030 | 4,56 | 18.363 | 6,28 | ||||
| 2026-02-11 | 13F | Jpmorgan Chase & Co | 49.400 | 256,99 | 2.708 | 262,87 | ||||
| 2026-01-23 | 13F | Avion Wealth | 9.783 | 0,00 | 1 | |||||
| 2026-02-12 | 13F | CIBC Private Wealth Group, LLC | 0 | -100,00 | 0 | |||||
| 2026-02-13 | 13F | Morgan Stanley | 79.596 | 14,27 | 4.363 | 16,17 | ||||
| 2026-01-27 | 13F | Belpointe Asset Management LLC | 20.066 | -0,50 | 1.100 | 1,10 | ||||
| 2026-02-17 | 13F | Fmr Llc | 88 | 2.100,00 | 5 | |||||
| 2026-02-18 | 13F | GWM Advisors LLC | 0 | -100,00 | 0 | |||||
| 2026-02-05 | 13F | Ndwm Llc | 12.309 | -0,32 | 675 | 1,35 | ||||
| 2026-02-09 | 13F | Frazier Financial Advisors, LLC | 70 | 0,00 | 4 | 0,00 | ||||
| 2026-02-11 | 13F | Janney Montgomery Scott LLC | 9.132 | 0,00 | 1 | |||||
| 2026-02-06 | 13F | Global Retirement Partners, LLC | 1.352 | 0,22 | 74 | 2,78 | ||||
| 2026-02-10 | 13F | Bnp Paribas Arbitrage, Sa | 184.138 | -2,10 | 10.093 | -0,48 | ||||
| 2026-02-13 | 13F | Resources Investment Advisors, LLC. | 702.670 | -0,18 | 38.513 | 1,46 | ||||
| 2026-01-14 | 13F | Wealthcare Advisory Partners LLC | 932.701 | -0,92 | 51.121 | 0,72 | ||||
| 2026-02-11 | 13F | Empowered Funds, LLC | 5.179 | 0,00 | 284 | 1,43 | ||||
| 2026-02-13 | 13F | SYM FINANCIAL Corp | 472 | 0,21 | 26 | 0,00 | ||||
| 2026-01-13 | 13F | Team Financial Group, LLC | 3.998 | 7,88 | 219 | 10,05 | ||||
| 2025-11-14 | 13F | Toronto Dominion Bank | 0 | -100,00 | 0 | |||||
| 2026-02-24 | 13F | Barnes Wealth Management Group, Inc | 8.065 | 12,78 | 442 | 14,81 | ||||
| 2026-02-10 | 13F | Evolution Wealth Management Inc. | 623 | 562,77 | 34 | 580,00 |