Grundlæggende statistik
| Institutionelle ejere | 90 total, 90 long only, 0 short only, 0 long/short - change of -13,46% MRQ |
| Gennemsnitlig porteføljeallokering | 0.0736 % - change of 11,18% MRQ |
| Institutionelle aktier (lange) | 7.398.170 (ex 13D/G) - change of 0,06MM shares 0,86% MRQ |
| Institutionel værdi (lang) | $ 179.527 USD ($1000) |
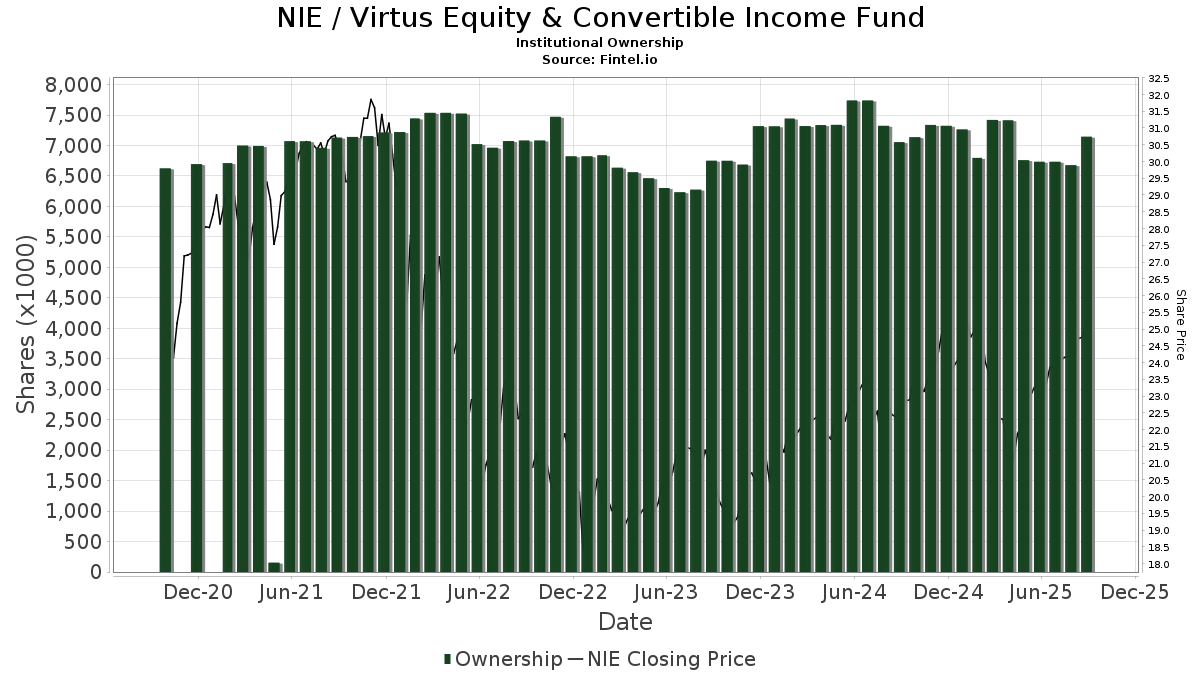
Institutionelt ejerskab og aktionærer
Virtus Equity & Convertible Income Fund (US:NIE) har 90 institutionelle ejere og aktionærer, der har indsendt 13D/G- eller 13F-formularer til Securities Exchange Commission (SEC). Disse institutioner har i alt 7,398,170 aktier. Største aktionærer omfatter Wells Fargo & Company/mn, Advisors Asset Management, Inc., Royal Bank Of Canada, Morgan Stanley, Guggenheim Capital Llc, Raymond James Financial Inc, Wealth Enhancement Advisory Services, Llc, Saba Capital Management, L.P., LPL Financial LLC, and Schwarz Dygos Wheeler Investment Advisors Llc .
Virtus Equity & Convertible Income Fund (NYSE:NIE) institutionel ejerskabsstruktur viser aktuelle positioner i virksomheden efter institutioner og fonde, samt seneste ændringer i positionsstørrelse. Større aktionærer kan omfatte individuelle investorer, investeringsforeninger, hedgefonde eller institutioner. Skema 13D angiver, at investoren besidder (eller besidder) mere end 5 % af virksomheden og har til hensigt (eller har til hensigt at) aktivt at forfølge en ændring i forretningsstrategi. Skema 13G indikerer en passiv investering på over 5%.
The share price as of April 2, 2026 is 23,57 / share. Previously, on April 3, 2025, the share price was 21,45 / share. This represents an increase of 9,88% over that period.
Fondens stemningsscore
Fund Sentiment Score (fka Ownership Accumulation Score) finder de aktier, der bliver mest købt af fonde. Det er resultatet af en sofistikeret, multi-faktor kvantitativ model, der identificerer virksomheder med de højeste niveauer af institutionel akkumulering. Scoringsmodellen bruger en kombination af den samlede stigning i oplyste ejere, ændringerne i porteføljeallokeringer i disse ejere og andre målinger. Tallet går fra 0 til 100, hvor højere tal indikerer et højere niveau af akkumulering for sine jævnaldrende, og 50 er gennemsnittet.
Opdateringsfrekvens: Dagligt
Se Ownership Explorer, som giver en liste over højest rangerende virksomheder.
AI+ Ask Fintel’s AI assistant about Virtus Equity & Convertible Income Fund.
Select a question to share a public post with an AI-crafted answer.
Thinking of good questions…
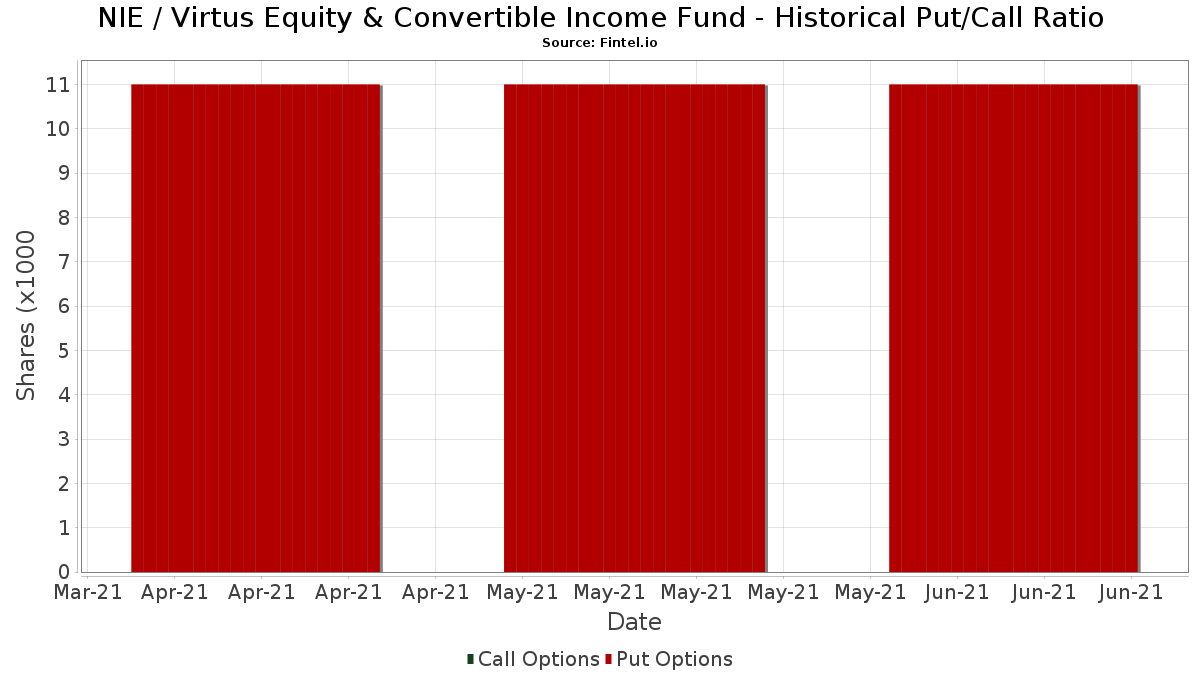
Institutionel Put/Call-forhold
Ud over at indberette standardaktie- og gældsudstedelser skal institutter med mere end 100 mill. aktiver under forvaltning også oplyse deres put- og call-optionsbeholdninger. Da salgsoptioner generelt indikerer negativ stemning, og købsoptioner indikerer positiv stemning, kan vi få en fornemmelse af den overordnede institutionelle stemning ved at plotte forholdet mellem put og kald. Diagrammet til højre viser det historiske put/call-forhold for dette instrument.
Brug af Put/Call Ratio som en indikator for investorernes stemning overvinder en af de vigtigste mangler ved at bruge totalt institutionelt ejerskab, som er, at en betydelig mængde af aktiver under forvaltning investeres passivt for at spore indekser. Passivt forvaltede fonde køber typisk ikke optioner, så indikatoren for put/call-forholdet følger mere nøje følelsen af aktivt forvaltede fonde.
13F og NPORT arkivering
Detaljer om 13F-arkivering er gratis. Detaljer om NP-ansøgninger kræver et premium-medlemskab. Grønne rækker angiver nye positioner. Røde rækker angiver lukkede positioner. Klik på linket ikon for at se den fulde transaktionshistorik.
Opgrader
for at låse premium-data op og eksportere til Excel ![]() .
.
| Fil dato | Kilde | Investor | Type | Gennemsnitlig pris (Øst) |
Aktier | Δ Aktier (%) |
Rapporteret Værdi ($1000) |
Δ Værdi (%) |
Port Alloc (%) |
|
|---|---|---|---|---|---|---|---|---|---|---|
| 2026-02-02 | 13F | Truist Financial Corp | 21.570 | 0,00 | 538 | -0,74 | ||||
| 2026-02-17 | 13F | Saba Capital Management, L.P. | 298.200 | 7.431 | ||||||
| 2026-01-28 | 13F | PMG Family Office LLC | 29.524 | -1,69 | 736 | -2,52 | ||||
| 2025-11-14 | 13F | Walleye Capital LLC | 0 | -100,00 | 0 | |||||
| 2026-02-03 | 13F | International Assets Investment Management, Llc | 12.535 | 0,00 | 312 | 4,70 | ||||
| 2026-02-06 | 13F | Prevail Innovative Wealth Advisors, Llc | 0 | -100,00 | 0 | |||||
| 2026-02-17 | 13F | Aqr Capital Management Llc | 14.452 | 0,00 | 360 | -0,55 | ||||
| 2026-01-14 | 13F | Eastern Bank | 1.298 | 0,00 | 32 | 0,00 | ||||
| 2026-02-13 | 13F | Level Four Advisory Services, Llc | 25.768 | 8,23 | 642 | 7,54 | ||||
| 2026-01-29 | 13F | D.a. Davidson & Co. | 79.938 | 13,47 | 1.992 | 12,61 | ||||
| 2026-02-10 | 13F | Envestnet Asset Management Inc | 20.430 | 7,68 | 509 | 6,93 | ||||
| 2026-02-17 | 13F | Wiley Bros.-aintree Capital, Llc | 51.997 | 119,75 | 1.296 | 118,01 | ||||
| 2026-02-13 | 13F | Stifel Financial Corp | 43.780 | -44,58 | 1.091 | -45,03 | ||||
| 2026-02-13 | 13F | Integrated Wealth Concepts LLC | 46.303 | -16,44 | 1.154 | -17,11 | ||||
| 2025-12-16 | 13F | Garde Capital, Inc. | 0 | -100,00 | 0 | |||||
| 2026-02-04 | 13F | Tsfg, Llc | 0 | -100,00 | 0 | |||||
| 2026-02-05 | 13F | Thrivent Financial For Lutherans | 35.850 | 0,00 | 1 | |||||
| 2026-01-08 | 13F | Wealth Enhancement Advisory Services, Llc | 401.952 | 1,50 | 10.165 | 1,18 | ||||
| 2026-01-09 | 13F | Silverlake Wealth Management Llc | 8.163 | 0,00 | 203 | -0,49 | ||||
| 2026-02-11 | 13F | J.w. Cole Advisors, Inc. | 0 | -100,00 | 0 | |||||
| 2026-02-10 | 13F | Rothschild Investment Llc | 28.991 | 0,00 | 722 | -0,69 | ||||
| 2026-01-26 | 13F | Cwm, Llc | 3.334 | 0,21 | 0 | |||||
| 2026-02-04 | 13F | Pensionmark Financial Group, Llc | 105.586 | 8,75 | 2.545 | 4,43 | ||||
| 2026-02-17 | 13F | Cetera Investment Advisers | 24.948 | 12,98 | 622 | 12,09 | ||||
| 2026-02-17 | 13F | Bank Of America Corp /de/ | 120.126 | -5,01 | 2.994 | -5,73 | ||||
| 2026-02-12 | 13F | Steward Partners Investment Advisory, Llc | 31.254 | -3,23 | 779 | -3,95 | ||||
| 2026-02-05 | 13F | Allworth Financial LP | 31.250 | -8,33 | 779 | -9,01 | ||||
| 2026-02-11 | 13F | Janney Montgomery Scott LLC | 14.047 | -8,15 | 0 | |||||
| 2026-02-17 | 13F | Guggenheim Capital Llc | 479.040 | 13,95 | 11.938 | 13,09 | ||||
| 2026-02-05 | 13F | Cornerstone Wealth Management, LLC | 26.412 | 3,47 | 658 | 2,81 | ||||
| 2026-01-14 | 13F | Centurion Wealth Management LLC | 21.509 | 0,00 | 536 | -0,74 | ||||
| 2026-01-13 | 13F | CoreCap Advisors, LLC | 1.300 | 0,00 | 32 | 0,00 | ||||
| 2026-01-23 | 13F | Farther Finance Advisors, LLC | 950 | 0,00 | 24 | 0,00 | ||||
| 2026-02-13 | 13F | Kestra Advisory Services, LLC | 0 | -100,00 | 0 | |||||
| 2026-02-13 | 13F | Landscape Capital Management, L.l.c. | 8.263 | -52,72 | 206 | -53,20 | ||||
| 2026-01-12 | 13F | David J Yvars Group | 21.136 | 20,63 | 527 | 19,82 | ||||
| 2026-02-12 | 13F | Smh Capital Advisors Inc | 10.689 | 0,00 | 266 | -3,97 | ||||
| 2026-02-09 | 13F | Schwarz Dygos Wheeler Investment Advisors Llc | 216.008 | 1,08 | 5.383 | 0,30 | ||||
| 2026-01-21 | 13F | Westfuller Advisors, LLC | 2.149 | 1,99 | 55 | 3,85 | ||||
| 2026-02-17 | 13F/A | Kovack Advisors, Inc. | 10.141 | 253 | ||||||
| 2026-02-17 | 13F | Evolve Private Wealth, Llc | 79.712 | 2.028 | ||||||
| 2026-02-13 | 13F | Brick & Kyle, Associates | 16.476 | -2,19 | 0 | |||||
| 2026-01-15 | 13F | OxenFree Capital LLC | 56.643 | 0,99 | 1.412 | -1,40 | ||||
| 2026-02-13 | 13F | Wells Fargo & Company/mn | 961.982 | -6,39 | 23.973 | -7,10 | ||||
| 2026-02-02 | 13F | Oppenheimer & Co Inc | 8.190 | 0,82 | 204 | 0,49 | ||||
| 2026-01-29 | 13F | Calamos Advisors LLC | 42.188 | 159,89 | 1.051 | 158,23 | ||||
| 2026-02-13 | 13F | Bay Colony Advisory Group, Inc d/b/a Bay Colony Advisors | 0 | -100,00 | 0 | -100,00 | ||||
| 2026-01-23 | 13F | Valley National Advisers Inc | 166 | 0,00 | 0 | |||||
| 2026-01-30 | 13F | Us Bancorp \de\ | 4.135 | 0,00 | 103 | 0,00 | ||||
| 2026-01-12 | 13F | Stolper Co | 32.642 | 2,25 | 1 | |||||
| 2026-01-27 | 13F | Institute for Wealth Management, LLC. | 14.633 | -1,08 | 365 | -1,89 | ||||
| 2026-02-17 | 13F | Css Llc/il | 16.668 | 0,91 | 415 | 0,24 | ||||
| 2026-01-14 | 13F | Hennion & Walsh Asset Management, Inc. | 16.804 | -47,18 | 419 | -47,62 | ||||
| 2026-01-15 | 13F | Allspring Global Investments Holdings, LLC | 67.182 | 25,89 | 1.674 | 25,02 | ||||
| 2026-01-29 | 13F | UBS Group AG | 139.661 | -17,81 | 3.480 | -18,42 | ||||
| 2026-02-17 | 13F | Fmr Llc | 31 | 0,00 | 1 | |||||
| 2026-01-13 | 13F | Capital Investment Advisors, LLC | 55.732 | -7,09 | 1.389 | -7,84 | ||||
| 2026-02-17 | 13F | Advisory Services Network, LLC | 0 | -100,00 | 0 | |||||
| 2026-02-09 | 13F | Blue Bell Private Wealth Management, Llc | 6.655 | 338,12 | 166 | 334,21 | ||||
| 2025-11-14 | 13F | Wetherby Asset Management Inc | 15.663 | 0,00 | 393 | 5,08 | ||||
| 2026-01-12 | 13F | DAVENPORT & Co LLC | 9.246 | 0,00 | 230 | -0,86 | ||||
| 2026-01-30 | 13F | Joel Isaacson & Co., LLC | 10.000 | 0,00 | 249 | -0,80 | ||||
| 2026-01-29 | 13F | Comerica Bank | 8.094 | 0,57 | 202 | -0,50 | ||||
| 2025-11-12 | 13F | Creekmur Asset Management LLC | 2 | 0,00 | 0 | |||||
| 2026-01-14 | 13F | Wolff Wiese Magana Llc | 4.248 | 0,00 | 106 | -0,94 | ||||
| 2026-02-02 | 13F | Wolverine Asset Management Llc | 113.752 | -31,26 | 2.835 | -31,79 | ||||
| 2026-01-15 | 13F | Highline Wealth Partners Llc | 371 | 67,87 | 9 | 80,00 | ||||
| 2026-01-29 | 13F | Sanctuary Advisors, LLC | 11.850 | 0,00 | 295 | -0,67 | ||||
| 2025-10-23 | 13F | Spire Wealth Management | 0 | -100,00 | 0 | |||||
| 2026-02-14 | 13F | Rockefeller Capital Management L.P. | 4.569 | 0,00 | 114 | -0,88 | ||||
| 2026-02-09 | 13F | Harbour Investments, Inc. | 2.048 | 0,00 | 51 | 0,00 | ||||
| 2026-01-29 | 13F | Huntleigh Advisors, Inc. | 9.379 | 1,79 | 234 | 0,87 | ||||
| 2026-02-17 | 13F | Logan Stone Capital, LLC | 11.369 | 283 | ||||||
| 2026-02-13 | 13F | MAI Capital Management | 2.912 | 1,96 | 73 | 1,41 | ||||
| 2026-02-09 | 13F | Prospera Financial Services Inc | 27.865 | -0,91 | 694 | -1,70 | ||||
| 2026-02-19 | 13F | Invesco Ltd. | 112.000 | 5,02 | 2.791 | 4,26 | ||||
| 2026-02-11 | 13F | LPL Financial LLC | 269.945 | 26,70 | 6.727 | 25,76 | ||||
| 2026-02-03 | 13F | Strengthening Families & Communities, LLC | 183 | 2,23 | 5 | 0,00 | ||||
| 2026-02-06 | 13F | Keystone Financial Group | 48.613 | -1,46 | 1.211 | -2,18 | ||||
| 2026-02-12 | 13F | Hollencrest Capital Management | 0 | -100,00 | 0 | |||||
| 2026-02-17 | 13F | Raymond James Financial Inc | 460.963 | -1,09 | 11.487 | -1,84 | ||||
| 2026-02-13 | 13F | Cornerstone Advisors, LLC | 108.972 | -51,35 | 2.716 | -51,72 | ||||
| 2026-02-13 | 13F | Morgan Stanley | 533.775 | -0,70 | 13.302 | -1,45 | ||||
| 2026-02-18 | 13F | GWM Advisors LLC | 7.262 | 1,58 | 181 | 0,56 | ||||
| 2026-02-09 | 13F | Global Assets Advisory, LLC | 10.000 | 0,00 | 249 | -0,80 | ||||
| 2026-01-26 | 13F | Shaker Financial Services, LLC | 67.522 | -35,92 | 1.725 | -34,78 | ||||
| 2026-01-23 | 13F | Westside Investment Management, Inc. | 350 | 0,00 | 9 | 0,00 | ||||
| 2026-02-17 | 13F | Royal Bank Of Canada | 571.160 | 1,98 | 14.234 | 1,21 | ||||
| 2026-02-12 | 13F | Wedbush Securities Inc | 12.522 | 31,62 | 0 | |||||
| 2026-02-05 | 13F | Cambridge Investment Research Advisors, Inc. | 83.545 | 0,44 | 2 | 0,00 | ||||
| 2025-11-14 | 13F | Northwestern Mutual Wealth Management Co | 0 | -100,00 | 0 | |||||
| 2026-02-17 | 13F | Readystate Asset Management Lp | 41.520 | 90,31 | 1.035 | 89,03 | ||||
| 2026-02-12 | 13F | Principal Securities, Inc. | 0 | -100,00 | 0 | -100,00 | ||||
| 2026-02-17 | 13F | Advisor Group Holdings, Inc. | 90.270 | -2,17 | 2.250 | -2,17 | ||||
| 2026-02-11 | 13F | Jpmorgan Chase & Co | 358 | -10,95 | 9 | -20,00 | ||||
| 2026-01-21 | 13F | Future Financial Wealth Managment LLC | 0 | -100,00 | 0 | |||||
| 2026-02-12 | 13F | Commonwealth Equity Services, Llc | 35.900 | 26,31 | 895 | |||||
| 2026-02-17 | 13F | North Capital, Inc. | 0 | -100,00 | 0 | |||||
| 2026-02-06 | 13F | Pnc Financial Services Group, Inc. | 3.004 | 0,00 | 75 | -1,33 | ||||
| 2026-02-12 | 13F | Advisors Asset Management, Inc. | 863.318 | 0,35 | 21.514 | -0,41 | ||||
| 2026-01-26 | 13F | PFG Investments, LLC | 14.965 | 0,31 | 373 | -0,53 | ||||
| 2026-01-12 | 13F | Daymark Wealth Partners, Llc | 9.661 | 0,00 | 241 | -0,83 | ||||
| 2026-02-13 | 13F | Baird Financial Group, Inc. | 18.478 | -1,55 | 460 | -2,34 | ||||
| 2026-02-17 | 13F | Ameriprise Financial Inc | 34.123 | -15,07 | 850 | -15,67 |