Grundlæggende statistik
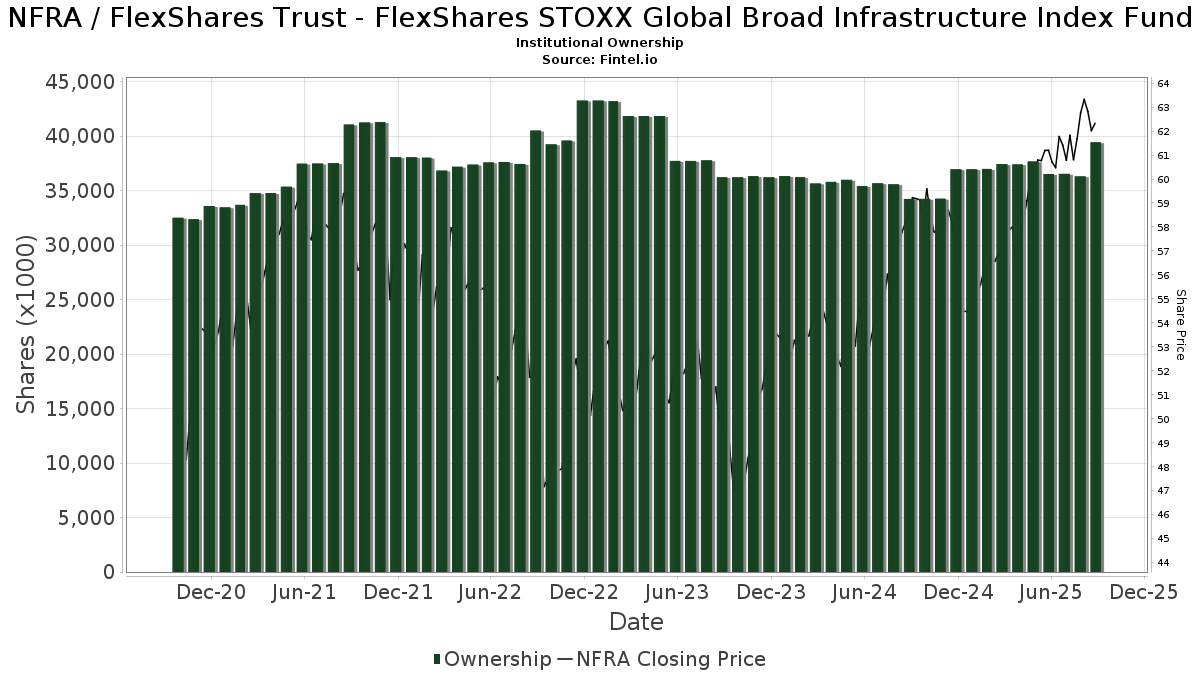
| Institutionelle ejere | 121 total, 121 long only, 0 short only, 0 long/short - change of -3,94% MRQ |
| Gennemsnitlig porteføljeallokering | 0.3162 % - change of -54,70% MRQ |
| Institutionelle aktier (lange) | 42.671.022 (ex 13D/G) - change of 0,68MM shares 1,63% MRQ |
| Institutionel værdi (lang) | $ 2.584.597 USD ($1000) |
Institutionelt ejerskab og aktionærer
FlexShares Trust - FlexShares STOXX Global Broad Infrastructure Index Fund (US:NFRA) har 121 institutionelle ejere og aktionærer, der har indsendt 13D/G- eller 13F-formularer til Securities Exchange Commission (SEC). Disse institutioner har i alt 42,671,022 aktier. Største aktionærer omfatter Northern Trust Corp, Capstone Financial Advisors, Inc., Alaska Permanent Capital Management, APCM Wealth Management for Individuals, Camden Capital, LLC, Envestnet Asset Management Inc, Morgan Stanley, United Bank, Bank Of America Corp /de/, and Cornerstone National Bank & Trust Co .
FlexShares Trust - FlexShares STOXX Global Broad Infrastructure Index Fund (ARCA:NFRA) institutionel ejerskabsstruktur viser aktuelle positioner i virksomheden efter institutioner og fonde, samt seneste ændringer i positionsstørrelse. Større aktionærer kan omfatte individuelle investorer, investeringsforeninger, hedgefonde eller institutioner. Skema 13D angiver, at investoren besidder (eller besidder) mere end 5 % af virksomheden og har til hensigt (eller har til hensigt at) aktivt at forfølge en ændring i forretningsstrategi. Skema 13G indikerer en passiv investering på over 5%.
The share price as of May 1, 2026 is 66,10 / share. Previously, on May 5, 2025, the share price was 59,76 / share. This represents an increase of 10,60% over that period.
Fondens stemningsscore
Fund Sentiment Score (fka Ownership Accumulation Score) finder de aktier, der bliver mest købt af fonde. Det er resultatet af en sofistikeret, multi-faktor kvantitativ model, der identificerer virksomheder med de højeste niveauer af institutionel akkumulering. Scoringsmodellen bruger en kombination af den samlede stigning i oplyste ejere, ændringerne i porteføljeallokeringer i disse ejere og andre målinger. Tallet går fra 0 til 100, hvor højere tal indikerer et højere niveau af akkumulering for sine jævnaldrende, og 50 er gennemsnittet.
Opdateringsfrekvens: Dagligt
Se Ownership Explorer, som giver en liste over højest rangerende virksomheder.
AI+ Ask Fintel’s AI assistant about FlexShares Trust - FlexShares STOXX Global Broad Infrastructure Index Fund.
Select a question to share a public post with an AI-crafted answer.
Thinking of good questions…
Institutionel Put/Call-forhold
Ud over at indberette standardaktie- og gældsudstedelser skal institutter med mere end 100 mill. aktiver under forvaltning også oplyse deres put- og call-optionsbeholdninger. Da salgsoptioner generelt indikerer negativ stemning, og købsoptioner indikerer positiv stemning, kan vi få en fornemmelse af den overordnede institutionelle stemning ved at plotte forholdet mellem put og kald. Diagrammet til højre viser det historiske put/call-forhold for dette instrument.
Brug af Put/Call Ratio som en indikator for investorernes stemning overvinder en af de vigtigste mangler ved at bruge totalt institutionelt ejerskab, som er, at en betydelig mængde af aktiver under forvaltning investeres passivt for at spore indekser. Passivt forvaltede fonde køber typisk ikke optioner, så indikatoren for put/call-forholdet følger mere nøje følelsen af aktivt forvaltede fonde.
13F og NPORT arkivering
Detaljer om 13F-arkivering er gratis. Detaljer om NP-ansøgninger kræver et premium-medlemskab. Grønne rækker angiver nye positioner. Røde rækker angiver lukkede positioner. Klik på linket ikon for at se den fulde transaktionshistorik.
Opgrader
for at låse premium-data op og eksportere til Excel ![]() .
.
| Fil dato | Kilde | Investor | Type | Gennemsnitlig pris (Øst) |
Aktier | Δ Aktier (%) |
Rapporteret Værdi ($1000) |
Δ Værdi (%) |
Port Alloc (%) |
|
|---|---|---|---|---|---|---|---|---|---|---|
| 2026-02-05 | 13F | Pinnacle Financial Group, LLC / IL | 0 | -100,00 | 0 | |||||
| 2026-02-10 | 13F | DiMeo Schneider & Associates, L.L.C. | 16.821 | 0,00 | 1.018 | -3,88 | ||||
| 2026-02-17 | 13F | Creative Planning | 0 | -100,00 | 0 | |||||
| 2026-04-28 | 13F | Golden State Wealth Management, LLC | 509 | 0,00 | 33 | 6,67 | ||||
| 2026-05-01 | 13F | Fifth Third Bancorp | 2.666 | 170 | ||||||
| 2026-02-11 | 13F | Cerity Partners LLC | 36.822 | 9,84 | 2.228 | 5,64 | ||||
| 2026-02-17 | 13F | Northern Trust Corp | 35.667.675 | 1,81 | 2.158.251 | -2,09 | ||||
| 2026-02-17 | 13F | Redwood Park Advisors LLC | 2.496 | -11,36 | 151 | -14,69 | ||||
| 2026-02-17 | 13F | Polar Asset Management Partners Inc. | 0 | -100,00 | 0 | -100,00 | ||||
| 2025-11-14 | 13F | Skopos Labs, Inc. | 0 | -100,00 | 0 | |||||
| 2026-02-09 | 13F | Endowment Wealth Management, Inc. | 10.553 | 9,35 | 639 | 5,11 | ||||
| 2026-02-06 | 13F | GPS Wealth Strategies Group, LLC | 0 | -100,00 | 0 | |||||
| 2026-04-24 | 13F | Key FInancial Inc | 741 | 0,00 | 47 | 6,82 | ||||
| 2026-02-05 | 13F | Allworth Financial LP | 369 | 0,00 | 22 | -4,35 | ||||
| 2026-04-07 | 13F | Boltwood Capital Management | 83.619 | 1,62 | 5.347 | 7,39 | ||||
| 2025-11-10 | 13F | MAI Capital Management | 0 | -100,00 | 0 | |||||
| 2026-02-12 | 13F | CIBC Private Wealth Group, LLC | 1.459 | 0,00 | 88 | -3,30 | ||||
| 2026-02-06 | 13F | Larson Financial Group LLC | 119 | 0,00 | 7 | 0,00 | ||||
| 2026-04-21 | 13F | Cambient Family Office, Llc | 1.053 | -22,12 | 67 | -17,28 | ||||
| 2026-02-17 | 13F | North Capital, Inc. | 0 | -100,00 | 0 | |||||
| 2026-02-12 | 13F | Commonwealth Equity Services, Llc | 15.628 | 4,63 | 946 | |||||
| 2026-01-29 | 13F | UBS Group AG | 11.229 | -78,84 | 679 | -79,66 | ||||
| 2026-02-06 | 13F | Pnc Financial Services Group, Inc. | 4.949 | 0,00 | 299 | -3,86 | ||||
| 2026-02-06 | 13F | Global Retirement Partners, LLC | 405 | 24 | ||||||
| 2026-02-17 | 13F | Wealth Watch Advisors, INC | 52 | 3 | ||||||
| 2026-04-28 | 13F | Altfest L J & Co Inc | 23.639 | 0,78 | 1.512 | 6,48 | ||||
| 2026-02-09 | 13F | Hartland & Co., LLC | 6.136 | 0,00 | 371 | -3,89 | ||||
| 2026-02-13 | 13F | Stifel Financial Corp | 9.794 | 593 | ||||||
| 2026-02-17 | 13F | Bank Of America Corp /de/ | 130.063 | 12,89 | 7.870 | 8,57 | ||||
| 2025-11-10 | 13F | Avalon Trust Co | 0 | -100,00 | 0 | |||||
| 2026-02-13 | 13F | Entrewealth, Llc | 37.386 | 3,27 | 2.384 | 4,70 | ||||
| 2026-02-11 | 13F | CNB Bank | 725 | 0,00 | 44 | -4,44 | ||||
| 2026-02-17 | 13F | Advisor Group Holdings, Inc. | 3.795 | -2,72 | 230 | -6,53 | ||||
| 2026-02-13 | 13F | Missouri Trust & Investment Co | 52.638 | 13,82 | 3.185 | 9,49 | ||||
| 2026-02-13 | 13F | Parkside Financial Bank & Trust | 406 | 0,00 | 25 | -4,00 | ||||
| 2026-02-10 | 13F | SCS Capital Management LLC | 12.603 | 0,00 | 763 | -3,79 | ||||
| 2026-02-19 | 13F | CI Private Wealth, LLC | 3.958 | 239 | ||||||
| 2026-05-01 | 13F | Gables Capital Management Inc. | 1.001 | 0,00 | 64 | 6,67 | ||||
| 2026-02-10 | 13F | Bank of New York Mellon Corp | 0 | -100,00 | 0 | |||||
| 2026-02-17 | 13F | Wealth Architects, LLC | 51.452 | -5,51 | 3.113 | -9,14 | ||||
| 2026-04-06 | 13F | CX Institutional | 79.723 | -56,29 | 5 | -54,55 | ||||
| 2026-01-29 | 13F | Concurrent Investment Advisors, LLC | 11.992 | 14,30 | 726 | 9,85 | ||||
| 2026-04-23 | 13F | Granite Harbor Advisors, Inc. | 3.226 | 206 | ||||||
| 2026-02-12 | 13F | Trace Wealth Advisors, LLC | 4.421 | -28,54 | 268 | -31,36 | ||||
| 2026-02-04 | 13F | Brio Consultants, LLC | 41.218 | 3,94 | 2.494 | -0,04 | ||||
| 2026-02-17 | 13F | Raymond James Financial Inc | 17.997 | 40,08 | 1.089 | 34,65 | ||||
| 2026-02-17 | 13F | NorthRock Partners, LLC | 9.879 | 0,00 | 598 | -3,86 | ||||
| 2026-02-17 | 13F | Susquehanna International Group, Llp | 15.112 | 80,87 | 914 | 74,10 | ||||
| 2026-04-15 | 13F | Perkins Coie Trust Co | 502 | 0,00 | 32 | 6,67 | ||||
| 2026-04-30 | 13F | Independence Bank of Kentucky | 3.405 | 0,00 | 218 | 5,34 | ||||
| 2026-02-12 | 13F | Rossby Financial, LCC | 11.797 | 714 | ||||||
| 2026-02-17 | 13F | Jones Financial Companies Lllp | 715 | 65,51 | 43 | 59,26 | ||||
| 2026-04-16 | 13F | Security National Bank | 350 | 0,00 | 22 | 4,76 | ||||
| 2026-02-09 | 13F | Harbour Investments, Inc. | 463 | 0,00 | 28 | -3,45 | ||||
| 2026-01-30 | 13F | BancorpSouth Bank | 0 | -100,00 | 0 | |||||
| 2026-02-09 | 13F | Huntington National Bank | 268 | -3,60 | ||||||
| 2026-02-13 | 13F | Aviso Financial Inc. | 0 | -100,00 | 0 | |||||
| 2026-02-12 | 13F | Douglass Winthrop Advisors, LLC | 0 | -100,00 | 0 | -100,00 | ||||
| 2025-11-07 | 13F | Beacon Capital Management, LLC | 0 | -100,00 | 0 | |||||
| 2026-02-17 | 13F | Ancora Advisors, LLC | 204 | 12 | ||||||
| 2026-02-09 | 13F | Valued Retirements, Inc. | 9.623 | -7,62 | 582 | -9,63 | ||||
| 2026-02-12 | 13F | Steward Partners Investment Advisory, Llc | 0 | -100,00 | 0 | |||||
| 2026-02-11 | 13F | Jpmorgan Chase & Co | 1.100 | 31,74 | 67 | 26,92 | ||||
| 2026-04-13 | 13F | Mather Group, Llc. | 1.065 | 68 | ||||||
| 2026-02-09 | 13F | Texas Capital Bank Wealth Management Services Inc | 3.474 | 0,00 | 210 | -3,67 | ||||
| 2026-02-13 | 13F | Wells Fargo & Company/mn | 7.019 | 96,45 | 425 | 89,29 | ||||
| 2026-02-17 | 13F | Capstone Financial Advisors, Inc. | 2.290.009 | 6,34 | 138.568 | 2,26 | ||||
| 2026-02-17 | 13F | Advisory Services Network, LLC | 0 | -100,00 | 0 | |||||
| 2026-02-13 | 13F | Umb Bank N A/mo | 5.221 | -63,71 | 316 | -65,19 | ||||
| 2025-11-14 | 13F | Eqis Capital Management, Inc. | 0 | -100,00 | 0 | |||||
| 2026-01-23 | 13F | Rsm Us Wealth Management Llc | 5.515 | -11,02 | 335 | -14,14 | ||||
| 2026-02-17 | 13F | Qube Research & Technologies Ltd | 0 | -100,00 | 0 | |||||
| 2026-02-02 | 13F | Cornerstone Planning Group LLC | 124 | 129,63 | 8 | 133,33 | ||||
| 2026-02-13 | 13F | Mml Investors Services, Llc | 61.788 | 9,75 | 3.739 | 5,53 | ||||
| 2026-02-11 | 13F | LPL Financial LLC | 25.458 | -3,45 | 1.540 | -7,17 | ||||
| 2026-01-30 | 13F | Urban Wealth Management, LLC | 0 | -100,00 | 0 | -100,00 | ||||
| 2026-02-10 | 13F | Arcadia Investment Management Corp/mi | 0 | -100,00 | 0 | |||||
| 2026-02-17 | 13F | Cetera Investment Advisers | 11.796 | 4,36 | 714 | 0,28 | ||||
| 2026-04-22 | 13F | Caldwell Trust Co | 1.126 | 0,00 | 72 | 5,88 | ||||
| 2026-02-12 | 13F | Menora Mivtachim Holdings Ltd. | 3.837 | 232 | ||||||
| 2026-04-13 | 13F | IFP Advisors, Inc | 427 | 0,00 | 27 | 8,00 | ||||
| 2026-04-06 | 13F | Highline Wealth Partners Llc | 3.078 | 197 | ||||||
| 2026-04-24 | 13F | Alaska Permanent Capital Management | 1.337.142 | 22,44 | 84.748 | 28,51 | ||||
| 2026-01-26 | 13F | Cwm, Llc | 78 | 110,81 | 0 | |||||
| 2026-04-08 | 13F | Grove Bank & Trust | 11.915 | -9,91 | 762 | -4,87 | ||||
| 2026-04-28 | 13F | Quent Capital, LLC | 65 | 0,00 | 4 | 33,33 | ||||
| 2026-04-14 | 13F | Austin Wealth Management, LLC | 103.055 | -28,91 | 6.624 | -24,28 | ||||
| 2026-02-12 | 13F | Bank Of Montreal /can/ | 2.009 | 8,24 | 122 | 4,31 | ||||
| 2026-04-20 | 13F | First PREMIER Bank | 3.666 | 0,00 | 0 | |||||
| 2026-01-29 | 13F | Simon Quick Advisors, Llc | 14.652 | 39,65 | 887 | 34,24 | ||||
| 2026-01-28 | 13F | REDW Wealth LLC | 7.199 | 0,00 | 436 | -3,76 | ||||
| 2026-04-14 | 13F | Seven Mile Advisory | 4.210 | 0,00 | 269 | 5,91 | ||||
| 2026-01-23 | 13F | Transcend Wealth Collective, Llc | 14.896 | 7,99 | 901 | 3,92 | ||||
| 2026-04-14 | 13F | Plancorp, LLC | 3.430 | 0,00 | 224 | 7,73 | ||||
| 2026-04-22 | 13F | Harbor Asset Planning, Inc. | 596 | 0,34 | 38 | 8,57 | ||||
| 2026-04-28 | 13F | Nbt Bank N A /ny | 113.705 | -3,44 | 7.271 | 2,08 | ||||
| 2026-04-30 | 13F | Private Trust Co Na | 0 | -100,00 | 0 | |||||
| 2026-04-13 | 13F | Creative Financial Designs Inc /adv | 117 | 515,79 | 7 | 600,00 | ||||
| 2026-04-30 | 13F | BRYN MAWR TRUST Co | 358 | 0,00 | 23 | 4,76 | ||||
| 2025-11-14 | 13F | Financial Network Wealth Management LLC | 0 | -100,00 | 0 | |||||
| 2026-04-17 | 13F | Stephenson National Bank & Trust | 63.688 | 8,48 | 4.073 | 14,64 | ||||
| 2026-02-05 | 13F | Bessemer Group Inc | 29.657 | 15,05 | 2 | 0,00 | ||||
| 2026-04-28 | 13F | Whittier Trust Co Of Nevada Inc | 0 | -100,00 | 0 | |||||
| 2026-02-10 | 13F/A | Northwestern Mutual Wealth Management Co | 2.877 | -10,68 | 174 | -13,86 | ||||
| 2026-02-17 | 13F | Royal Bank Of Canada | 3.402 | 11,69 | 207 | 8,38 | ||||
| 2026-02-18 | 13F | Hanlon Investment Management, Inc. | 9.227 | -8,27 | 558 | -11,71 | ||||
| 2026-01-23 | 13F | Assetmark, Inc | 2.876 | 174 | ||||||
| 2026-02-13 | 13F | Flow Traders U.s. Llc | 0 | -100,00 | 0 | |||||
| 2026-02-09 | 13F | Fft Wealth Management Llc | 4.243 | 0,00 | 257 | -3,76 | ||||
| 2026-04-28 | 13F | Flagship Harbor Advisors, Llc | 0 | -100,00 | 0 | |||||
| 2026-04-07 | 13F | CoreCap Advisors, LLC | 1.568 | -7,11 | 100 | -1,96 | ||||
| 2026-04-20 | 13F | Ronald Blue Trust, Inc. | 38 | 0,00 | 2 | 0,00 | ||||
| 2026-04-28 | 13F | Whittier Trust Co | 9.523 | 0,00 | 612 | 5,88 | ||||
| 2026-01-30 | 13F | Us Bancorp \de\ | 1.698 | 0,00 | 103 | -3,77 | ||||
| 2026-02-10 | 13F | Rothschild Investment Llc | 261 | 4,40 | 16 | 0,00 | ||||
| 2026-02-17 | 13F | Marquette Associates, Inc. | 166 | -11,70 | 10 | -9,09 | ||||
| 2026-01-28 | 13F | Chicago Partners Investment Group LLC | 20.254 | -2,53 | 1.231 | -6,95 | ||||
| 2026-02-10 | 13F | Envestnet Asset Management Inc | 260.140 | 4,85 | 15.741 | 0,83 | ||||
| 2026-02-12 | 13F | Jane Street Group, Llc | 0 | -100,00 | 0 | |||||
| 2026-04-08 | 13F | Wealth Enhancement Advisory Services, Llc | 39.310 | -33,90 | 2.522 | -30,18 | ||||
| 2026-02-17 | 13F | Blair William & Co/il | 1.010 | 129,02 | 61 | 125,93 | ||||
| 2026-02-13 | 13F | Morgan Stanley | 243.545 | -7,78 | 14.737 | -11,31 | ||||
| 2026-02-12 | 13F | Principal Securities, Inc. | 0 | -100,00 | 0 | |||||
| 2026-02-13 | 13F | Citigroup Inc | 7.728 | 468 | ||||||
| 2026-04-28 | 13F | ORBA Wealth Advisors, L.L.C. | 4.700 | -1,88 | 301 | 3,81 | ||||
| 2026-02-06 | 13F | HighTower Advisors, LLC | 0 | -100,00 | 0 | |||||
| 2026-02-17 | 13F | Citadel Advisors Llc | 0 | -100,00 | 0 | |||||
| 2026-04-14 | 13F | Cornerstone National Bank & Trust Co | 117.596 | -4,48 | 7.519 | 0,94 | ||||
| 2026-02-17 | 13F | Old Mission Capital Llc | 4.167 | 252 | ||||||
| 2026-04-07 | 13F | Farther Finance Advisors, LLC | 1.422 | 945,59 | 91 | 1.025,00 | ||||
| 2026-02-03 | 13F | Bokf, Na | 6.984 | -2,66 | 423 | -6,43 | ||||
| 2025-11-12 | 13F | Creekmur Asset Management LLC | 0 | -100,00 | 0 | |||||
| 2026-04-16 | 13F | Capital Advisors, Ltd. LLC | 4.201 | 0,00 | 0 | |||||
| 2026-04-24 | 13F | APCM Wealth Management for Individuals | 811.403 | 8,64 | 51.889 | 14,81 | ||||
| 2026-01-29 | 13F | Comerica Bank | 850 | -56,48 | 51 | -58,20 | ||||
| 2026-02-13 | 13F | Resources Investment Advisors, LLC. | 11.068 | -5,63 | 670 | -9,23 | ||||
| 2026-05-01 | 13F | United Bank | 183.778 | 8,42 | 11.753 | 14,58 | ||||
| 2026-02-11 | 13F | Dorsey & Whitney Trust CO LLC | 36.227 | 10,00 | 2.192 | 5,79 | ||||
| 2026-02-17 | 13F | GeoWealth Management, LLC | 476 | -10,02 | 29 | -15,15 | ||||
| 2026-01-30 | 13F | Camden Capital, LLC | 271.415 | 0,00 | 16.423 | -3,83 | ||||
| 2026-04-16 | 13F | Park National Corp /oh/ | 45.470 | -36,31 | 2.908 | -32,69 | ||||
| 2026-02-17 | 13F | Fmr Llc | 2.580 | 1,30 | 156 | -2,50 | ||||
| 2026-04-20 | 13F | Naples Global Advisors, Llc | 6.000 | 0,00 | 384 | 5,51 | ||||
| 2026-04-15 | 13F | Activest Wealth Management | 71 | 0,00 | 5 | 0,00 | ||||
| 2026-04-20 | 13F | Jfs Wealth Advisors, Llc | 736 | -10,57 | 47 | -4,08 | ||||
| 2026-04-30 | 13F | Kestra Advisory Services, LLC | 7.715 | 405,57 | 493 | 435,87 | ||||
| 2026-04-13 | 13F | Clayton Financial Group LLC | 125 | 0,00 | 8 | 0,00 | ||||
| 2026-02-14 | 13F | Rockefeller Capital Management L.P. | 3.099 | 0,00 | 188 | -3,61 | ||||
| 2026-01-26 | 13F | AE Wealth Management LLC | 65 | 0,00 | 4 | -25,00 | ||||
| 2026-04-08 | 13F | Wealth Enhancement Trust Services, Inc. | 342 | 0,00 | 22 | 5,00 | ||||
| 2026-02-13 | 13F | Smartleaf Asset Management LLC | 9.803 | -37,97 | 595 | -39,90 |