Grundlæggende statistik
| Institutionelle ejere | 128 total, 128 long only, 0 short only, 0 long/short - change of -3,76% MRQ |
| Gennemsnitlig porteføljeallokering | 0.0863 % - change of -22,08% MRQ |
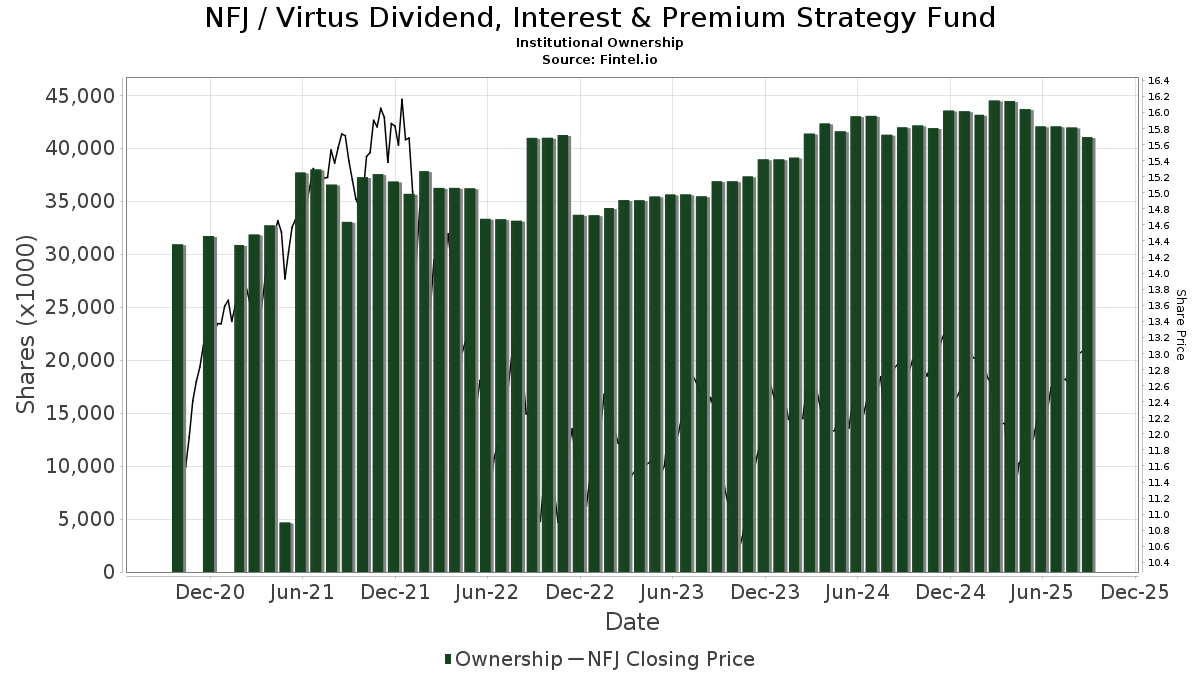
| Institutionelle aktier (lange) | 37.401.740 (ex 13D/G) - change of -2,32MM shares -5,84% MRQ |
| Institutionel værdi (lang) | $ 471.859 USD ($1000) |
Institutionelt ejerskab og aktionærer
Virtus Dividend, Interest & Premium Strategy Fund (US:NFJ) har 128 institutionelle ejere og aktionærer, der har indsendt 13D/G- eller 13F-formularer til Securities Exchange Commission (SEC). Disse institutioner har i alt 37,401,740 aktier. Største aktionærer omfatter Morgan Stanley, Saba Capital Management, L.P., Bank Of America Corp /de/, Allspring Global Investments Holdings, LLC, Stifel Financial Corp, Invesco Ltd., Advisors Asset Management, Inc., Colony Group, LLC, LPL Financial LLC, and Guggenheim Capital Llc .
Virtus Dividend, Interest & Premium Strategy Fund (NYSE:NFJ) institutionel ejerskabsstruktur viser aktuelle positioner i virksomheden efter institutioner og fonde, samt seneste ændringer i positionsstørrelse. Større aktionærer kan omfatte individuelle investorer, investeringsforeninger, hedgefonde eller institutioner. Skema 13D angiver, at investoren besidder (eller besidder) mere end 5 % af virksomheden og har til hensigt (eller har til hensigt at) aktivt at forfølge en ændring i forretningsstrategi. Skema 13G indikerer en passiv investering på over 5%.
The share price as of March 20, 2026 is 12,35 / share. Previously, on March 24, 2025, the share price was 12,20 / share. This represents an increase of 1,23% over that period.
Fondens stemningsscore
Fund Sentiment Score (fka Ownership Accumulation Score) finder de aktier, der bliver mest købt af fonde. Det er resultatet af en sofistikeret, multi-faktor kvantitativ model, der identificerer virksomheder med de højeste niveauer af institutionel akkumulering. Scoringsmodellen bruger en kombination af den samlede stigning i oplyste ejere, ændringerne i porteføljeallokeringer i disse ejere og andre målinger. Tallet går fra 0 til 100, hvor højere tal indikerer et højere niveau af akkumulering for sine jævnaldrende, og 50 er gennemsnittet.
Opdateringsfrekvens: Dagligt
Se Ownership Explorer, som giver en liste over højest rangerende virksomheder.
AI+ Ask Fintel’s AI assistant about Virtus Dividend, Interest & Premium Strategy Fund.
Select a question to share a public post with an AI-crafted answer.
Thinking of good questions…
Institutionel Put/Call-forhold
Ud over at indberette standardaktie- og gældsudstedelser skal institutter med mere end 100 mill. aktiver under forvaltning også oplyse deres put- og call-optionsbeholdninger. Da salgsoptioner generelt indikerer negativ stemning, og købsoptioner indikerer positiv stemning, kan vi få en fornemmelse af den overordnede institutionelle stemning ved at plotte forholdet mellem put og kald. Diagrammet til højre viser det historiske put/call-forhold for dette instrument.
Brug af Put/Call Ratio som en indikator for investorernes stemning overvinder en af de vigtigste mangler ved at bruge totalt institutionelt ejerskab, som er, at en betydelig mængde af aktiver under forvaltning investeres passivt for at spore indekser. Passivt forvaltede fonde køber typisk ikke optioner, så indikatoren for put/call-forholdet følger mere nøje følelsen af aktivt forvaltede fonde.
13D/G-arkivering
Vi præsenterer 13D/G ansøgninger separat fra 13F ansøgninger på grund af den forskellige behandling af SEC. 13D/G-ansøgninger kan indgives af grupper af investorer (med én ledende), hvorimod 13F-ansøgninger ikke kan. Dette resulterer i situationer, hvor en investor kan indsende en 13D/G, der rapporterer én værdi for de samlede aktier (der repræsenterer alle de aktier, der ejes af investorgruppen), men derefter indsender en 13F, der rapporterer en anden værdi for de samlede aktier (der udelukkende repræsenterer deres egne) ejendomsret). Det betyder, at aktieejerskab af 13D/G-arkiver og 13F-arkiveringer ofte ikke er direkte sammenlignelige, så vi præsenterer dem separat.
Bemærk: Fra den 16. maj 2021 viser vi ikke længere ejere, der ikke har indsendt en 13D/G inden for det seneste år. Tidligere viste vi den fulde historie af 13D/G-arkiver. Generelt skal enheder, der er forpligtet til at indgive 13D/G-ansøgninger, indgive mindst årligt, før de indsender en afsluttende ansøgning. Dog forlader fonde nogle gange positioner uden at indsende en afsluttende ansøgning (dvs. de afvikler), så visning af den fulde historie resulterede nogle gange i forvirring om det nuværende ejerskab. For at undgå forvirring viser vi nu kun 'aktuelle' ejere - det vil sige - ejere, der har anmeldt inden for det seneste år.
Upgrade to unlock premium data.
| Fil dato | Form | Investor | Forrige Aktier |
Seneste Aktier |
Δ Aktier (Procent) |
Ejendomsret (Procent) |
Δ Ejerskab (Procent) |
|
|---|---|---|---|---|---|---|---|---|
| 2026-03-03 | Saba Capital Management, L.P. | 9,008,235 | 9,869,469 | 9.56 | 10.49 | 9.61 | ||
| 2025-05-07 | MORGAN STANLEY | 6,331,010 | 7,325,796 | 15.71 | 7.70 | 14.93 |
13F og NPORT arkivering
Detaljer om 13F-arkivering er gratis. Detaljer om NP-ansøgninger kræver et premium-medlemskab. Grønne rækker angiver nye positioner. Røde rækker angiver lukkede positioner. Klik på linket ikon for at se den fulde transaktionshistorik.
Opgrader
for at låse premium-data op og eksportere til Excel ![]() .
.
| Fil dato | Kilde | Investor | Type | Gennemsnitlig pris (Øst) |
Aktier | Δ Aktier (%) |
Rapporteret Værdi ($1000) |
Δ Værdi (%) |
Port Alloc (%) |
|
|---|---|---|---|---|---|---|---|---|---|---|
| 2026-02-17 | 13F | Saba Capital Management, L.P. | 8.640.031 | 15,08 | 111.370 | 14,02 | ||||
| 2026-02-03 | 13F | International Assets Investment Management, Llc | 16.100 | 0,00 | 208 | 3,50 | ||||
| 2026-02-02 | 13F | Fifth Third Bancorp | 87 | 1 | ||||||
| 2026-02-17 | 13F | Modern Wealth Management, LLC | 100.829 | -21,31 | 1.300 | -22,08 | ||||
| 2026-02-13 | 13F | Level Four Advisory Services, Llc | 22.949 | 2,30 | 296 | 1,37 | ||||
| 2025-10-17 | 13F | Fortitude Family Office, LLC | 0 | -100,00 | 0 | |||||
| 2026-02-06 | 13F | Prevail Innovative Wealth Advisors, Llc | 211.538 | 7,40 | 2.727 | 6,40 | ||||
| 2026-02-17 | 13F | Ionic Capital Management LLC | 40.000 | 516 | ||||||
| 2026-01-23 | 13F | Diversify Advisory Services, LLC | 32.769 | -13,47 | 436 | -11,04 | ||||
| 2026-02-13 | 13F | Integrated Wealth Concepts LLC | 132.359 | -5,17 | 1.706 | -6,01 | ||||
| 2026-02-11 | 13F | M Holdings Securities, Inc. | 17.809 | 0 | ||||||
| 2026-02-17 | 13F | Wiley Bros.-aintree Capital, Llc | 42.036 | 205,43 | 542 | 202,23 | ||||
| 2026-01-29 | 13F | D.a. Davidson & Co. | 92.782 | 4,17 | 1.196 | 3,20 | ||||
| 2026-01-30 | 13F | United Community Bank | 1.650 | 0,00 | 21 | 0,00 | ||||
| 2026-02-13 | 13F | Stifel Financial Corp | 1.289.025 | 4,81 | 16.616 | 3,84 | ||||
| 2026-01-08 | 13F | Wealth Enhancement Advisory Services, Llc | 46.771 | -4,21 | 618 | -3,59 | ||||
| 2026-02-03 | 13F | Emerald Investment Partners, Llc | 48.901 | 1,54 | 630 | 0,64 | ||||
| 2025-09-24 | 13F | Caldwell Trust Co | 0 | -100,00 | 0 | -100,00 | ||||
| 2026-02-05 | 13F | Thrivent Financial For Lutherans | 156.164 | 0,00 | 2 | 0,00 | ||||
| 2026-02-13 | 13F | Colony Group, LLC | 980.837 | 12.643 | ||||||
| 2025-10-22 | 13F | Geneos Wealth Management Inc. | 0 | -100,00 | 0 | |||||
| 2026-02-09 | 13F | Cary Street Partners Financial Llc | 12.603 | 162 | ||||||
| 2026-02-06 | 13F | Vestmark Advisory Solutions, Inc. | 17.318 | 223 | ||||||
| 2026-02-14 | 13F | Pointe Capital Management LLC | 42.556 | -29,27 | 549 | -29,92 | ||||
| 2026-01-22 | 13F | Accordant Advisory Group Inc | 2.600 | 0,00 | 34 | 0,00 | ||||
| 2026-02-03 | 13F | We Are One Seven, LLC | 10.661 | -26,85 | 137 | -27,51 | ||||
| 2026-02-13 | 13F | Dymon Asia Capital (singapore) Pte. Ltd. | 0 | -100,00 | 0 | |||||
| 2026-02-04 | 13F | Tsfg, Llc | 1.000 | 0,00 | 0 | |||||
| 2026-02-14 | 13F | Rockefeller Capital Management L.P. | 16.131 | -65,74 | 208 | -66,18 | ||||
| 2025-09-26 | NP | Templeton Global Income Fund | 15.160 | -0,75 | 192 | 8,47 | ||||
| 2026-02-17 | 13F | Bank Of America Corp /de/ | 2.913.921 | -13,88 | 37.560 | -14,68 | ||||
| 2026-02-12 | 13F | Steward Partners Investment Advisory, Llc | 13.410 | 0,00 | 173 | -1,15 | ||||
| 2026-02-05 | 13F | Allworth Financial LP | 3.235 | 431,20 | 42 | 485,71 | ||||
| 2026-01-23 | 13F | Transcend Wealth Collective, Llc | 0 | -100,00 | 0 | |||||
| 2026-01-21 | 13F | Future Financial Wealth Managment LLC | 0 | -100,00 | 0 | |||||
| 2026-02-11 | 13F | Janney Montgomery Scott LLC | 17.833 | 3,58 | 0 | |||||
| 2026-01-05 | 13F | Chesapeake Asset Management Llc | 0 | -100,00 | 0 | -100,00 | ||||
| 2026-01-14 | 13F | Moisand Fitzgerald Tamayo, LLC | 0 | -100,00 | 0 | |||||
| 2026-01-08 | 13F | Occidental Asset Management, LLC | 16.895 | -0,25 | 218 | -1,36 | ||||
| 2026-02-13 | 13F | SRS Capital Advisors, Inc. | 1.302 | 17 | ||||||
| 2026-02-17 | 13F | Guggenheim Capital Llc | 607.745 | -0,02 | 7.834 | -0,95 | ||||
| 2026-02-17 | 13F | Creative Planning | 195.498 | -3,67 | 2.520 | -4,58 | ||||
| 2026-02-17 | 13F | Susquehanna International Group, Llp | 39.471 | 509 | ||||||
| 2026-02-17 | 13F | Evolve Private Wealth, Llc | 173.050 | 2.231 | ||||||
| 2026-02-17 | 13F | Polar Asset Management Partners Inc. | 0 | -100,00 | 0 | |||||
| 2026-01-05 | 13F | Park Avenue Securities Llc | 0 | -100,00 | 0 | |||||
| 2026-02-02 | 13F | Ashton Thomas Securities, Llc | 17.425 | -10,30 | 225 | -11,11 | ||||
| 2025-11-14 | 13F | Capstone Investment Advisors, Llc | 526.672 | 0,00 | 6.852 | 4,93 | ||||
| 2026-02-17 | 13F | Wealth Watch Advisors, INC | 1.485 | -1,39 | 19 | 0,00 | ||||
| 2026-01-23 | 13F | Farther Finance Advisors, LLC | 452 | 6 | ||||||
| 2026-02-06 | 13F | HighTower Advisors, LLC | 13.330 | -14,13 | 172 | -14,93 | ||||
| 2026-02-13 | 13F | Landscape Capital Management, L.l.c. | 21.551 | 278 | ||||||
| 2026-02-17 | 13F | Cetera Investment Advisers | 57.824 | 14,41 | 745 | 13,39 | ||||
| 2025-09-25 | NP | AAINX - Thrivent Opportunity Income Plus Fund Class A | 40.673 | 0,00 | 515 | 8,88 | ||||
| 2026-02-13 | 13F | Wells Fargo & Company/mn | 390.131 | -6,89 | 5.029 | -7,76 | ||||
| 2026-01-12 | 13F | Uhlmann Price Securities, Llc | 42.151 | 2,35 | 543 | 1,50 | ||||
| 2026-01-20 | 13F | SOA Wealth Advisors, LLC. | 704 | 2,33 | 9 | 12,50 | ||||
| 2026-02-02 | 13F | Avidian Wealth Solutions, LLC | 30.000 | 0,00 | 387 | -1,03 | ||||
| 2026-02-13 | 13F | Venture Visionary Partners LLC | 27.990 | 0,00 | 361 | -1,10 | ||||
| 2026-02-17 | 13F | Ancora Advisors, LLC | 377 | 277,00 | 5 | 300,00 | ||||
| 2026-02-02 | 13F | Wolverine Asset Management Llc | 108.877 | 1.403 | ||||||
| 2026-02-10 | 13F | Beckerman Institutional, LLC | 55.843 | -0,56 | 720 | -1,51 | ||||
| 2025-11-12 | 13F | Cresset Asset Management, LLC | 0 | -100,00 | 0 | |||||
| 2025-12-16 | 13F | Garde Capital, Inc. | 0 | -100,00 | 0 | |||||
| 2026-02-05 | 13F | Stephens Inc /ar/ | 53.864 | -3,08 | 694 | -4,01 | ||||
| 2026-02-10 | 13F | Envestnet Asset Management Inc | 29.771 | -56,11 | 384 | -56,58 | ||||
| 2026-02-20 | 13F | Kovitz Investment Group Partners, LLC | 0 | -100,00 | 0 | |||||
| 2025-11-14 | 13F | 1607 Capital Partners, LLC | 0 | -100,00 | 0 | |||||
| 2026-01-26 | 13F | Cwm, Llc | 3.183 | -19,84 | 0 | |||||
| 2026-02-18 | 13F | GWM Advisors LLC | 0 | -100,00 | 0 | |||||
| 2026-02-11 | 13F | Alteri Wealth LLC | 13.893 | 0,00 | 179 | -0,56 | ||||
| 2026-02-13 | 13F | Mariner, LLC | 39.580 | -16,05 | 510 | -16,80 | ||||
| 2026-02-12 | 13F | Kovack Advisors, Inc. | 19.069 | 247 | ||||||
| 2026-01-15 | 13F | Allspring Global Investments Holdings, LLC | 1.651.888 | 1,34 | 21.293 | 0,40 | ||||
| 2026-01-29 | 13F | UBS Group AG | 313.249 | -16,63 | 4.038 | -17,41 | ||||
| 2026-02-06 | 13F | Tortoise Investment Management, LLC | 0 | -100,00 | 0 | |||||
| 2026-03-13 | 13F | Fund Advisors of America Inc/FL | 57.526 | 742 | ||||||
| 2026-02-12 | 13F | Penserra Capital Management LLC | 541.612 | 10,20 | 7 | 0,00 | ||||
| 2026-02-17 | 13F | Fmr Llc | 15 | 0 | ||||||
| 2026-01-13 | 13F | Capital Investment Advisors, LLC | 17.191 | -9,72 | 222 | -10,53 | ||||
| 2026-02-13 | 13F | Pathstone Holdings, LLC | 487.016 | -60,08 | 6.278 | -60,45 | ||||
| 2026-02-13 | 13F | Pinnacle Wealth Planning Services, Inc. | 19.547 | 252 | ||||||
| 2026-02-17 | 13F | Equitable Holdings, Inc. | 10.330 | 133 | ||||||
| 2026-01-29 | 13F | Camelot Portfolios, LLC | 13.443 | 3,09 | 173 | 2,37 | ||||
| 2025-10-07 | 13F | Sonora Investment Management Group, LLC | 0 | -100,00 | 0 | |||||
| 2026-02-06 | 13F | Creative Financial Designs Inc /adv | 897 | 0,00 | 12 | 0,00 | ||||
| 2026-02-09 | 13F | Blue Bell Private Wealth Management, Llc | 282.305 | 10,77 | 3.639 | 9,74 | ||||
| 2025-11-14 | 13F | Mml Investors Services, Llc | 0 | -100,00 | 0 | |||||
| 2026-01-12 | 13F | DAVENPORT & Co LLC | 18.472 | 0,00 | 238 | -0,83 | ||||
| 2026-02-17 | 13F | Private Advisor Group, LLC | 22.217 | -1,07 | 286 | -2,05 | ||||
| 2025-09-25 | NP | AABFX - Thrivent Balanced Income Plus Fund Class A | 5.085 | 0,00 | 64 | 8,47 | ||||
| 2026-01-12 | 13F | Sax Wealth Advisors, Llc | 36.035 | 464 | ||||||
| 2025-11-14 | 13F | Wetherby Asset Management Inc | 12.996 | -53,37 | 169 | -51,01 | ||||
| 2026-01-23 | 13F | Assetmark, Inc | 0 | -100,00 | 0 | |||||
| 2026-01-29 | 13F | Comerica Bank | 27.502 | -2,04 | 355 | -3,01 | ||||
| 2026-02-12 | 13F | Wealthspire Advisors, LLC | 0 | -100,00 | 0 | |||||
| 2026-01-16 | 13F | Vanguard Capital Wealth Advisors This fund is a listed as child fund of Vanguard Group Inc and if that institution has disclosed ownership in this security, then these positions will not be double counted when calculating total shares and total value | 12.610 | 2,25 | 163 | 1,25 | ||||
| 2026-01-26 | 13F | Merit Financial Group, LLC | 61.845 | -0,25 | 797 | -1,12 | ||||
| 2026-01-27 | 13F | TD Waterhouse Canada Inc. | 1.800 | 0,00 | 23 | 0,00 | ||||
| 2026-01-20 | 13F | Thurston, Springer, Miller, Herd & Titak, Inc. | 1.000 | 13 | ||||||
| 2025-10-22 | 13F | Daymark Wealth Partners, Llc | 0 | -100,00 | 0 | |||||
| 2026-01-29 | 13F | Sanctuary Advisors, LLC | 28.921 | -6,16 | 373 | -7,00 | ||||
| 2026-01-22 | 13F | Comprehensive Money Management Services LLC | 25.050 | 0,00 | 323 | -0,92 | ||||
| 2026-01-26 | 13F | Opal Wealth Advisors, LLC | 74.520 | -0,97 | 961 | -1,84 | ||||
| 2026-01-20 | 13F | Stratos Wealth Partners, LTD. | 17.880 | 0,38 | 230 | -0,43 | ||||
| 2026-02-04 | 13F | Ameritas Advisory Services, LLC | 0 | -100,00 | 0 | -100,00 | ||||
| 2026-02-09 | 13F | Harbour Investments, Inc. | 150 | -77,17 | 2 | -87,50 | ||||
| 2026-02-13 | 13F | Morgan Stanley | 10.841.427 | -1,27 | 139.746 | -2,18 | ||||
| 2026-01-07 | 13F | Procyon Private Wealth Partners, LLC | 15.305 | 197 | ||||||
| 2025-11-07 | 13F | Atticus Wealth Management, Llc | 0 | -100,00 | 0 | |||||
| 2026-01-13 | 13F | Dakota Wealth Management | 11.119 | -23,89 | 143 | -24,74 | ||||
| 2026-01-28 | 13F | WPG Advisers, LLC | 7.372 | 0,16 | 95 | 0,00 | ||||
| 2026-02-04 | 13F | Berry Wealth Group, LP | 11.701 | 2,03 | 151 | 0,67 | ||||
| 2026-02-11 | 13F | LPL Financial LLC | 735.756 | 14,83 | 9.484 | 13,76 | ||||
| 2026-01-20 | 13F | Relyea Zuckerberg Hanson LLC | 0 | -100,00 | 0 | |||||
| 2026-02-13 | 13F | Karpus Management, Inc. | 0 | -100,00 | 0 | |||||
| 2026-02-19 | 13F | Invesco Ltd. | 1.282.479 | -14,19 | 16.531 | -14,98 | ||||
| 2025-11-04 | 13F | Winnow Wealth Llc | 0 | -100,00 | 0 | |||||
| 2026-01-14 | 13F | Pallas Capital Advisors LLC | 0 | -100,00 | 0 | |||||
| 2026-01-22 | 13F | Pinnacle Bancorp, Inc. | 456 | -82,02 | 6 | -84,37 | ||||
| 2026-02-06 | 13F | EverSource Wealth Advisors, LLC | 2.965 | -0,84 | 38 | 0,00 | ||||
| 2026-02-06 | 13F | GPS Wealth Strategies Group, LLC | 0 | -100,00 | 0 | |||||
| 2025-11-13 | 13F | Franklin Resources Inc | 0 | -100,00 | 0 | |||||
| 2026-02-17 | 13F | Raymond James Financial Inc | 434.459 | 2,41 | 5.600 | 1,47 | ||||
| 2026-01-26 | 13F | Shaker Financial Services, LLC | 221.869 | 364,93 | 2.860 | 361,13 | ||||
| 2026-02-12 | 13F | Mount Yale Investment Advisors, LLC | 17.318 | 0,00 | 223 | -0,89 | ||||
| 2026-02-13 | 13F | Seven Mile Advisory | 41.411 | -2,54 | 534 | -3,44 | ||||
| 2026-02-09 | 13F | Accredited Investor Services, Llc | 49.472 | -1,72 | 638 | -2,60 | ||||
| 2026-02-09 | 13F | Key FInancial Inc | 196 | 0,00 | 3 | 0,00 | ||||
| 2026-02-12 | 13F | Wedbush Securities Inc | 10.426 | 0,80 | 0 | |||||
| 2026-01-15 | 13F | Highline Wealth Partners Llc | 250 | -16,67 | 3 | 0,00 | ||||
| 2026-02-11 | 13F | Closed-End Fund Advisors, Inc. | 46.947 | 605 | ||||||
| 2026-01-23 | 13F | Rsm Us Wealth Management Llc | 79.251 | -9,48 | 1.026 | -9,93 | ||||
| 2026-02-05 | 13F | Cambridge Investment Research Advisors, Inc. | 49.274 | 0,49 | 1 | |||||
| 2026-01-26 | 13F | Nations Financial Group Inc, /ia/ /adv | 20.000 | 0,00 | 258 | -1,15 | ||||
| 2026-02-02 | 13F | Benjamin Edwards Inc | 61.480 | -11,35 | 793 | -12,20 | ||||
| 2026-02-12 | 13F | Jane Street Group, Llc | 47.571 | 154,08 | 613 | 152,26 | ||||
| 2026-02-10 | 13F/A | Northwestern Mutual Wealth Management Co | 5.805 | 7,40 | 75 | 5,71 | ||||
| 2026-02-11 | 13F | Modus Advisors, LLC | 500 | 6 | ||||||
| 2026-02-17 | 13F | Readystate Asset Management Lp | 32.530 | 41,07 | 419 | 40,13 | ||||
| 2025-10-08 | 13F | Integrated Capital Management, Inc. | 0 | -100,00 | 0 | |||||
| 2026-02-17 | 13F | Advisor Group Holdings, Inc. | 184.841 | -1,01 | 2.383 | -1,85 | ||||
| 2026-02-17 | 13F | Royal Bank Of Canada | 519.411 | 5,48 | 6.695 | 4,50 | ||||
| 2026-01-14 | 13F | Chatham Capital Group, Inc. | 10.000 | 0,00 | 129 | -1,54 | ||||
| 2026-02-11 | 13F | Jpmorgan Chase & Co | 667 | 0,00 | 9 | 0,00 | ||||
| 2026-03-03 | 13F | NWF Advisory Services Inc. | 20.500 | -14,58 | 264 | -15,38 | ||||
| 2026-02-12 | 13F | Commonwealth Equity Services, Llc | 41.621 | 48,32 | 536 | |||||
| 2026-02-12 | 13F | Colonial Trust Co / SC | 8.863 | 0,00 | 113 | 0,00 | ||||
| 2026-02-13 | 13F | Kestra Advisory Services, LLC | 0 | -100,00 | 0 | |||||
| 2026-02-06 | 13F | Larson Financial Group LLC | 1.000 | 0,00 | 13 | -7,69 | ||||
| 2026-02-06 | 13F | Pnc Financial Services Group, Inc. | 10.423 | -30,41 | 134 | -30,93 | ||||
| 2026-02-12 | 13F | Sit Investment Associates Inc | 0 | -100,00 | 0 | |||||
| 2025-11-12 | 13F | Us Bancorp \de\ | 0 | -100,00 | 0 | |||||
| 2026-02-12 | 13F | Advisors Asset Management, Inc. | 1.190.070 | -10,29 | 15.340 | -11,11 | ||||
| 2026-02-17 | 13F | Tower Research Capital LLC (TRC) | 24 | -20,00 | 0 | |||||
| 2026-02-04 | 13F | Advisor OS, LLC | 49.405 | 7,35 | 637 | 6,35 | ||||
| 2026-02-13 | 13F | Commerce Bank | 14.028 | 0,00 | 181 | -1,10 | ||||
| 2026-02-17 | 13F | Ameriprise Financial Inc | 11.879 | -44,67 | 153 | -45,16 | ||||
| 2026-02-13 | 13F | Baird Financial Group, Inc. | 56.225 | -1,72 | 725 | -2,69 | ||||
| 2026-02-06 | 13F | Global Retirement Partners, LLC | 46.221 | 13.906,36 | 596 | 14.775,00 | ||||
| 2025-11-12 | 13F | Transce3nd, LLC | 0 | -100,00 | 0 | |||||
| 2026-02-06 | 13F | Fortis Group Advisors, LLC | 250 | 0,00 | 3 | 0,00 |