Grundlæggende statistik
| Institutionelle ejere | 90 total, 89 long only, 0 short only, 1 long/short - change of 4,60% MRQ |
| Gennemsnitlig porteføljeallokering | 0.0659 % - change of -74,22% MRQ |
| Institutionelle aktier (lange) | 8.916.822 (ex 13D/G) - change of 1,61MM shares 22,01% MRQ |
| Institutionel værdi (lang) | $ 93.165 USD ($1000) |
Institutionelt ejerskab og aktionærer
VanEck ETF Trust - VanEck Mortgage REIT Income ETF (US:MORT) har 90 institutionelle ejere og aktionærer, der har indsendt 13D/G- eller 13F-formularer til Securities Exchange Commission (SEC). Disse institutioner har i alt 8,916,822 aktier. Største aktionærer omfatter HighTower Advisors, LLC, LPL Financial LLC, Gradient Investments LLC, Morgan Stanley, Bank Of America Corp /de/, Two Sigma Investments, Lp, AXS Investments LLC, Mml Investors Services, Llc, Cetera Investment Advisers, and Arete Wealth Advisors, LLC .
VanEck ETF Trust - VanEck Mortgage REIT Income ETF (ARCA:MORT) institutionel ejerskabsstruktur viser aktuelle positioner i virksomheden efter institutioner og fonde, samt seneste ændringer i positionsstørrelse. Større aktionærer kan omfatte individuelle investorer, investeringsforeninger, hedgefonde eller institutioner. Skema 13D angiver, at investoren besidder (eller besidder) mere end 5 % af virksomheden og har til hensigt (eller har til hensigt at) aktivt at forfølge en ændring i forretningsstrategi. Skema 13G indikerer en passiv investering på over 5%.
The share price as of March 18, 2026 is 10,17 / share. Previously, on March 19, 2025, the share price was 11,57 / share. This represents a decline of 12,10% over that period.

Fondens stemningsscore
Fund Sentiment Score (fka Ownership Accumulation Score) finder de aktier, der bliver mest købt af fonde. Det er resultatet af en sofistikeret, multi-faktor kvantitativ model, der identificerer virksomheder med de højeste niveauer af institutionel akkumulering. Scoringsmodellen bruger en kombination af den samlede stigning i oplyste ejere, ændringerne i porteføljeallokeringer i disse ejere og andre målinger. Tallet går fra 0 til 100, hvor højere tal indikerer et højere niveau af akkumulering for sine jævnaldrende, og 50 er gennemsnittet.
Opdateringsfrekvens: Dagligt
Se Ownership Explorer, som giver en liste over højest rangerende virksomheder.
AI+ Ask Fintel’s AI assistant about VanEck ETF Trust - VanEck Mortgage REIT Income ETF.
Select a question to share a public post with an AI-crafted answer.
Thinking of good questions…
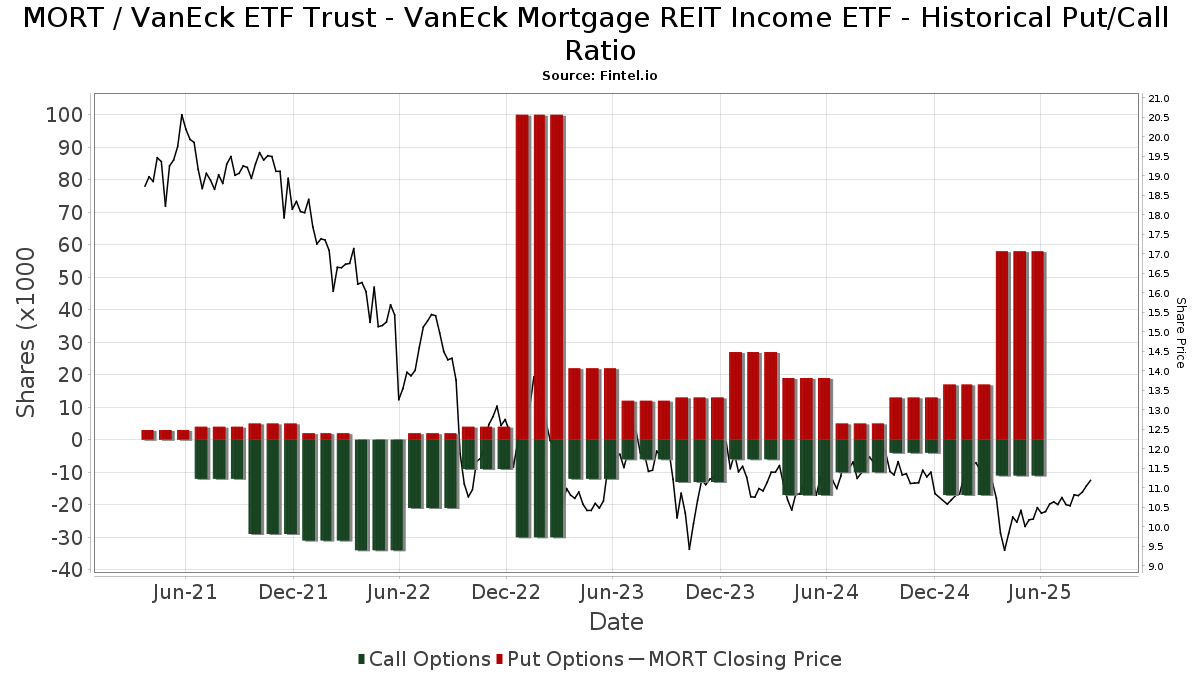
Institutionel Put/Call-forhold
Ud over at indberette standardaktie- og gældsudstedelser skal institutter med mere end 100 mill. aktiver under forvaltning også oplyse deres put- og call-optionsbeholdninger. Da salgsoptioner generelt indikerer negativ stemning, og købsoptioner indikerer positiv stemning, kan vi få en fornemmelse af den overordnede institutionelle stemning ved at plotte forholdet mellem put og kald. Diagrammet til højre viser det historiske put/call-forhold for dette instrument.
Brug af Put/Call Ratio som en indikator for investorernes stemning overvinder en af de vigtigste mangler ved at bruge totalt institutionelt ejerskab, som er, at en betydelig mængde af aktiver under forvaltning investeres passivt for at spore indekser. Passivt forvaltede fonde køber typisk ikke optioner, så indikatoren for put/call-forholdet følger mere nøje følelsen af aktivt forvaltede fonde.
13F og NPORT arkivering
Detaljer om 13F-arkivering er gratis. Detaljer om NP-ansøgninger kræver et premium-medlemskab. Grønne rækker angiver nye positioner. Røde rækker angiver lukkede positioner. Klik på linket ikon for at se den fulde transaktionshistorik.
Opgrader
for at låse premium-data op og eksportere til Excel ![]() .
.
| Fil dato | Kilde | Investor | Type | Gennemsnitlig pris (Øst) |
Aktier | Δ Aktier (%) |
Rapporteret Værdi ($1000) |
Δ Værdi (%) |
Port Alloc (%) |
|
|---|---|---|---|---|---|---|---|---|---|---|
| 2026-01-29 | 13F | UBS Group AG | 31.940 | -68,37 | 336 | -69,18 | ||||
| 2025-11-06 | 13F | Assetmark, Inc | 0 | -100,00 | 0 | |||||
| 2026-02-09 | 13F | Keating Financial Advisory Services, Inc. | 7.690 | 81 | ||||||
| 2025-11-06 | 13F | Ameritas Advisory Services, LLC | 0 | -100,00 | 0 | -100,00 | ||||
| 2026-02-17 | 13F | Equitable Holdings, Inc. | 116.100 | 1,83 | 1.220 | -0,57 | ||||
| 2025-11-12 | 13F | Group One Trading, L.p. | 0 | -100,00 | 0 | |||||
| 2026-01-27 | 13F | Elevated Capital Advisors, LLC | 23 | 0 | ||||||
| 2026-02-12 | 13F | Wedbush Securities Inc | 111.390 | 2,77 | 1 | 0,00 | ||||
| 2026-01-22 | 13F | Brookwood Investment Group LLC | 0 | -100,00 | 0 | |||||
| 2026-02-10 | 13F | Hillsdale Investment Management Inc. | 38.800 | 11,17 | 408 | 8,53 | ||||
| 2026-01-26 | 13F | AE Wealth Management LLC | 1.455 | 45,50 | 15 | 50,00 | ||||
| 2026-02-06 | 13F | Prevail Innovative Wealth Advisors, Llc | 0 | -100,00 | 0 | |||||
| 2026-02-12 | 13F | Grey Fox Wealth Advisors, LLC | 0 | -100,00 | 0 | |||||
| 2026-01-30 | 13F | Sigma Planning Corp | 20.288 | 17,27 | 213 | 14,52 | ||||
| 2026-02-17 | 13F | Susquehanna International Group, Llp | Put | 0 | -100,00 | 0 | ||||
| 2026-02-13 | 13F | Arete Wealth Advisors, LLC | 247.659 | 1,98 | 3 | 0,00 | ||||
| 2026-02-13 | 13F | Wells Fargo & Company/mn | 2 | 100,00 | 0 | |||||
| 2026-01-12 | 13F | Roble, Belko & Company, Inc | 190 | 0 | ||||||
| 2026-02-12 | 13F | Triumph Capital Management | 7.043 | -29,17 | 74 | -30,84 | ||||
| 2026-01-21 | 13F | Country Trust Bank | 300 | 0,00 | 3 | 0,00 | ||||
| 2026-01-26 | 13F | Consolidated Portfolio Review Corp | 0 | -100,00 | 0 | |||||
| 2026-01-23 | 13F | Farther Finance Advisors, LLC | 21 | 0,00 | 0 | |||||
| 2026-02-13 | 13F | Kestra Advisory Services, LLC | 3.177 | 33 | ||||||
| 2026-02-13 | 13F | Motiv8 Investments LLC | 1.250 | 0 | ||||||
| 2026-02-11 | 13F | OneAscent Family Office, LLC | 50.581 | 61,24 | 532 | 57,57 | ||||
| 2026-02-17 | 13F | Quadrature Capital Ltd | 29.817 | -82,05 | 313 | -82,48 | ||||
| 2026-02-17 | 13F | Harvest Investment Services, LLC | 13.608 | 0,00 | 143 | -2,05 | ||||
| 2025-11-14 | 13F | Consultiva Wealth Management, Corp. | 0 | -100,00 | 0 | |||||
| 2026-01-29 | 13F | Focused Wealth Management, Inc | 109.587 | 1.152 | ||||||
| 2026-02-09 | 13F | Harbour Investments, Inc. | 10 | 0,00 | 0 | |||||
| 2026-02-10 | 13F | AXS Investments LLC | 266.501 | -36,14 | 2.801 | -37,69 | ||||
| 2025-11-13 | 13F | Bnp Paribas Arbitrage, Sa | 0 | -100,00 | 0 | -100,00 | ||||
| 2026-01-20 | 13F | Signaturefd, Llc | 2 | 0,00 | 0 | |||||
| 2026-02-13 | 13F | MAI Capital Management | 4.305 | 6,40 | 45 | 4,65 | ||||
| 2026-01-30 | 13F | Wealthfront Advisers Llc | 28.399 | -32,61 | 298 | -34,22 | ||||
| 2026-02-13 | 13F/A | New England Private Wealth Advisors LLC | 55.755 | 0,00 | 586 | -2,50 | ||||
| 2026-02-05 | 13F | Phoenix Holdings Ltd. | 6.706 | 4.268 | ||||||
| 2026-02-17 | 13F | Fmr Llc | 3.540 | 9,06 | 37 | 8,82 | ||||
| 2026-02-12 | 13F | Bank Of Montreal /can/ | 0 | -100,00 | 0 | |||||
| 2026-02-17 | 13F | Advisor Group Holdings, Inc. | 41.794 | 9,78 | 439 | 6,04 | ||||
| 2026-01-06 | 13F | Nelson, Van Denburg & Campbell Wealth Management Group, LLC | 0 | -100,00 | 0 | |||||
| 2026-02-05 | 13F | AlphaCore Capital LLC | 44.750 | -33,86 | 470 | -35,44 | ||||
| 2026-01-12 | 13F | Sax Wealth Advisors, Llc | 30.000 | 0,00 | 315 | -2,48 | ||||
| 2026-02-17 | 13F | Qube Research & Technologies Ltd | 49.043 | 57,23 | 515 | 53,73 | ||||
| 2026-01-27 | 13F | Institute for Wealth Management, LLC. | 26.455 | 2,50 | 278 | 0,36 | ||||
| 2026-02-05 | 13F | Thrivent Financial For Lutherans | 12.700 | 0,00 | 0 | |||||
| 2026-02-10 | 13F | Marshall & Sterling Wealth Advisors Inc. | 36.166 | 2,32 | 380 | 0,00 | ||||
| 2026-02-18 | 13F | GWM Advisors LLC | 24.084 | 253 | ||||||
| 2026-01-21 | 13F | Sowell Financial Services LLC | 15.424 | 10,77 | 162 | 8,72 | ||||
| 2026-02-11 | 13F | LPL Financial LLC | 1.212.310 | 9,43 | 12.741 | 6,79 | ||||
| 2026-02-17 | 13F | Jones Financial Companies Lllp | 512 | 5 | ||||||
| 2026-02-13 | 13F | Stifel Financial Corp | 57.993 | -5,29 | 610 | -7,59 | ||||
| 2026-02-17 | 13F | Citadel Advisors Llc | 39.405 | 414 | ||||||
| 2026-02-09 | 13F | Huntington National Bank | 51 | 56,25 | ||||||
| 2025-11-12 | 13F | TCG Advisory Services, LLC | 0 | -100,00 | 0 | |||||
| 2026-02-13 | 13F | Mml Investors Services, Llc | 265.520 | 11,03 | 2.791 | 8,35 | ||||
| 2026-02-17 | 13F | XTX Topco Ltd | 28.004 | -14,42 | 294 | -16,48 | ||||
| 2026-01-06 | 13F | Investors Research Corp | 5.258 | 0,00 | 55 | -1,79 | ||||
| 2026-02-17 | 13F | Royal Bank Of Canada | 133.930 | 193,04 | 1.408 | 185,60 | ||||
| 2026-02-13 | 13F | National Bank Of Canada /fi/ | 339 | 0,00 | 4 | 0,00 | ||||
| 2026-02-13 | 13F | Morgan Stanley | 694.284 | 77,68 | 7.297 | 73,38 | ||||
| 2026-02-17 | 13F | Raymond James Financial Inc | 58.238 | 50,67 | 612 | 47,12 | ||||
| 2026-02-17 | 13F | Tower Research Capital LLC (TRC) | 21.440 | -56,42 | 225 | -57,47 | ||||
| 2026-02-04 | 13F | Anson Capital, Inc. | 55.118 | 207,61 | 579 | 201,56 | ||||
| 2026-02-06 | 13F | Cascade Financial Partners, LLC | 56.956 | 38,85 | 599 | 35,60 | ||||
| 2026-02-12 | 13F | Steward Partners Investment Advisory, Llc | 145.104 | 78,55 | 1.525 | 74,29 | ||||
| 2026-01-16 | 13F | Ronald Blue Trust, Inc. | 150 | 0,00 | 2 | 0,00 | ||||
| 2026-02-13 | 13F | Advyzon Investment Management, LLC | 36.910 | 14,93 | 388 | 12,17 | ||||
| 2026-01-08 | 13F | Wealth Enhancement Advisory Services, Llc | 66.717 | 31,45 | 718 | 35,80 | ||||
| 2026-01-29 | 13F | Integras Partners LLC | 138.851 | -6,10 | 1.459 | -8,35 | ||||
| 2026-02-17 | 13F | Susquehanna International Group, Llp | 11.929 | -63,36 | 125 | -64,29 | ||||
| 2026-01-08 | 13F | Gradient Investments LLC | 706.782 | 1,84 | 7.428 | -0,62 | ||||
| 2026-01-30 | 13F | ASB Consultores, LLC | 13.710 | 154 | ||||||
| 2025-11-13 | 13F | Ulland Investment Advisors, LLC | 0 | -100,00 | 0 | |||||
| 2026-02-04 | 13F | H&H Retirement Design & Management INC | 98.173 | -10,33 | 1.053 | -7,55 | ||||
| 2026-02-14 | 13F | Rockefeller Capital Management L.P. | 12.534 | -7,02 | 132 | -9,66 | ||||
| 2026-02-06 | 13F | Global Retirement Partners, LLC | 113 | -91,35 | 1 | -92,86 | ||||
| 2026-02-10 | 13F | Lido Advisors, LLC | 19.030 | 0,00 | 205 | 0,00 | ||||
| 2026-02-12 | 13F | Hrt Financial Lp | 33.404 | 0 | ||||||
| 2026-02-17 | 13F | Two Sigma Investments, Lp | 638.349 | 6.709 | ||||||
| 2026-02-10 | 13F/A | Northwestern Mutual Wealth Management Co | 13.732 | -1,20 | 144 | -3,36 | ||||
| 2026-02-03 | 13F | International Assets Investment Management, Llc | 18.250 | -14,12 | 192 | -13,57 | ||||
| 2026-02-11 | 13F | Jpmorgan Chase & Co | 26.896 | 283 | ||||||
| 2026-01-23 | 13F | Clear Creek Financial Management, LLC | 10.250 | 108 | ||||||
| 2026-02-09 | 13F | Hartland & Co., LLC | 0 | -100,00 | 0 | |||||
| 2026-02-05 | 13F | Cambridge Investment Research Advisors, Inc. | 47.381 | -30,13 | 0 | |||||
| 2026-02-06 | 13F | HighTower Advisors, LLC | 1.273.864 | 13.388 | ||||||
| 2026-02-17 | 13F | Advisory Services Network, LLC | 0 | -100,00 | 0 | |||||
| 2026-02-17 | 13F | Cetera Investment Advisers | 250.144 | 31,23 | 2.629 | 28,12 | ||||
| 2026-01-15 | 13F | Jaffetilchin Investment Partners, LLC | 20.781 | -2,15 | 218 | -4,39 | ||||
| 2025-11-14 | 13F | Citadel Advisors Llc | Put | 0 | -100,00 | 0 | ||||
| 2026-01-21 | 13F | Future Financial Wealth Managment LLC | 0 | -100,00 | 0 | |||||
| 2026-01-29 | 13F | Ashton Thomas Private Wealth, LLC | 245.471 | -1,78 | 2.580 | -4,16 | ||||
| 2026-01-26 | 13F | Cwm, Llc | 13 | 0,00 | 0 | |||||
| 2026-02-11 | 13F | Simplex Trading, Llc | 237 | -96,49 | 2 | |||||
| 2026-02-12 | 13F | Founders Financial Alliance, LLC | 50 | 0,00 | 1 | |||||
| 2026-01-14 | 13F | Wealthcare Advisory Partners LLC | 12.252 | -42,34 | 129 | -43,86 | ||||
| 2026-02-12 | 13F | Hollencrest Capital Management | 7.040 | 0,00 | 74 | -2,67 | ||||
| 2026-02-12 | 13F | Jane Street Group, Llc | Put | 13.500 | -8,78 | 142 | -11,32 | |||
| 2026-02-12 | 13F | Jane Street Group, Llc | Call | 10.200 | 107 | |||||
| 2025-11-14 | 13F | Susquehanna International Group, Llp | Call | 0 | -100,00 | 0 | -100,00 | |||
| 2026-02-04 | 13F | Drive Wealth Management, Llc | 0 | -100,00 | 0 | |||||
| 2026-02-11 | 13F | O'shaughnessy Asset Management, Llc | 1 | 0,00 | 0 | |||||
| 2026-02-17 | 13F | Bank Of America Corp /de/ | 642.343 | 16,70 | 6.751 | 13,88 | ||||
| 2026-01-23 | 13F | Fifth Third Securities, Inc. | 53.192 | 1,87 | 559 | -0,53 | ||||
| 2026-01-21 | 13F | TPG Advisors LLC | 15.133 | 47,47 | 159 | 44,55 | ||||
| 2026-02-05 | 13F | Soltis Investment Advisors LLC | 122.677 | -23,49 | 1.289 | -25,32 | ||||
| 2026-02-10 | 13F | Envestnet Asset Management Inc | 153.376 | 41,73 | 1.612 | 38,28 | ||||
| 2026-02-17 | 13F | Van Den Berg Management I, Inc | 240 | -58,97 | 3 | -66,67 | ||||
| 2026-02-12 | 13F | Insigneo Advisory Services, Llc | 0 | -100,00 | 0 | |||||
| 2026-02-13 | 13F | Citigroup Inc | 1 | 0 | ||||||
| 2026-02-12 | 13F | Jane Street Group, Llc | 15.025 | -70,90 | 158 | -71,76 | ||||
| 2026-01-30 | 13F | Us Bancorp \de\ | 555 | 0,00 | 6 | 0,00 | ||||
| 2026-01-23 | 13F | Aspect Partners, LLC | 300 | 0,00 | 3 | 0,00 |