Grundlæggende statistik
| Institutionelle ejere | 82 total, 82 long only, 0 short only, 0 long/short - change of -6,82% MRQ |
| Gennemsnitlig porteføljeallokering | 0.0596 % - change of -88,04% MRQ |
| Institutionelle aktier (lange) | 4.892.358 (ex 13D/G) - change of -0,51MM shares -9,37% MRQ |
| Institutionel værdi (lang) | $ 173.441 USD ($1000) |
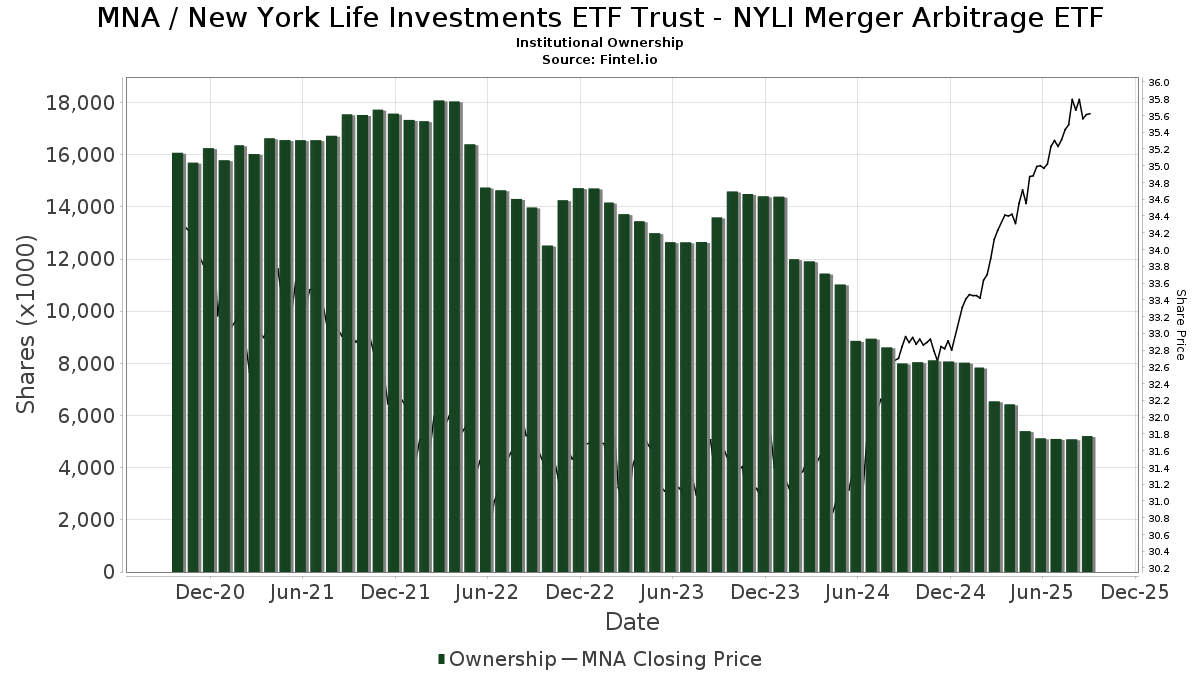
Institutionelt ejerskab og aktionærer
New York Life Investments ETF Trust - NYLI Merger Arbitrage ETF (US:MNA) har 82 institutionelle ejere og aktionærer, der har indsendt 13D/G- eller 13F-formularer til Securities Exchange Commission (SEC). Disse institutioner har i alt 4,892,358 aktier. Største aktionærer omfatter New York Life Investment Management Llc, Morgan Stanley, Osborne Partners Capital Management, Llc, Ameriprise Financial Inc, Envestnet Asset Management Inc, Oppenheimer Asset Management Inc., Aspiriant, Llc, IHT Wealth Management, LLC, Equitable Holdings, Inc., and Royal Bank Of Canada .
New York Life Investments ETF Trust - NYLI Merger Arbitrage ETF (ARCA:MNA) institutionel ejerskabsstruktur viser aktuelle positioner i virksomheden efter institutioner og fonde, samt seneste ændringer i positionsstørrelse. Større aktionærer kan omfatte individuelle investorer, investeringsforeninger, hedgefonde eller institutioner. Skema 13D angiver, at investoren besidder (eller besidder) mere end 5 % af virksomheden og har til hensigt (eller har til hensigt at) aktivt at forfølge en ændring i forretningsstrategi. Skema 13G indikerer en passiv investering på over 5%.
The share price as of March 27, 2026 is 36,20 / share. Previously, on March 31, 2025, the share price was 34,30 / share. This represents an increase of 5,54% over that period.
Fondens stemningsscore
Fund Sentiment Score (fka Ownership Accumulation Score) finder de aktier, der bliver mest købt af fonde. Det er resultatet af en sofistikeret, multi-faktor kvantitativ model, der identificerer virksomheder med de højeste niveauer af institutionel akkumulering. Scoringsmodellen bruger en kombination af den samlede stigning i oplyste ejere, ændringerne i porteføljeallokeringer i disse ejere og andre målinger. Tallet går fra 0 til 100, hvor højere tal indikerer et højere niveau af akkumulering for sine jævnaldrende, og 50 er gennemsnittet.
Opdateringsfrekvens: Dagligt
Se Ownership Explorer, som giver en liste over højest rangerende virksomheder.
AI+ Ask Fintel’s AI assistant about New York Life Investments ETF Trust - NYLI Merger Arbitrage ETF.
Select a question to share a public post with an AI-crafted answer.
Thinking of good questions…
Institutionel Put/Call-forhold
Ud over at indberette standardaktie- og gældsudstedelser skal institutter med mere end 100 mill. aktiver under forvaltning også oplyse deres put- og call-optionsbeholdninger. Da salgsoptioner generelt indikerer negativ stemning, og købsoptioner indikerer positiv stemning, kan vi få en fornemmelse af den overordnede institutionelle stemning ved at plotte forholdet mellem put og kald. Diagrammet til højre viser det historiske put/call-forhold for dette instrument.
Brug af Put/Call Ratio som en indikator for investorernes stemning overvinder en af de vigtigste mangler ved at bruge totalt institutionelt ejerskab, som er, at en betydelig mængde af aktiver under forvaltning investeres passivt for at spore indekser. Passivt forvaltede fonde køber typisk ikke optioner, så indikatoren for put/call-forholdet følger mere nøje følelsen af aktivt forvaltede fonde.
13F og NPORT arkivering
Detaljer om 13F-arkivering er gratis. Detaljer om NP-ansøgninger kræver et premium-medlemskab. Grønne rækker angiver nye positioner. Røde rækker angiver lukkede positioner. Klik på linket ikon for at se den fulde transaktionshistorik.
Opgrader
for at låse premium-data op og eksportere til Excel ![]() .
.
| Fil dato | Kilde | Investor | Type | Gennemsnitlig pris (Øst) |
Aktier | Δ Aktier (%) |
Rapporteret Værdi ($1000) |
Δ Værdi (%) |
Port Alloc (%) |
|
|---|---|---|---|---|---|---|---|---|---|---|
| 2026-02-09 | 13F | MRP Capital Investments, LLC | 5.100 | 2,00 | 183 | 3,41 | ||||
| 2026-01-05 | 13F | City Center Advisors, LLC | 7.065 | 253 | ||||||
| 2025-11-03 | 13F | GPS Wealth Strategies Group, LLC | 0 | -100,00 | 0 | |||||
| 2026-01-30 | 13F | Urban Wealth Management, LLC | 0 | -100,00 | 0 | -100,00 | ||||
| 2026-01-28 | 13F | Kingswood Wealth Advisors, Llc | 111.993 | 3,11 | 4.008 | 2,80 | ||||
| 2026-02-02 | 13F | Oppenheimer Asset Management Inc. | 255.653 | -4,51 | 9.150 | -4,81 | ||||
| 2026-02-17 | 13F | Captrust Financial Advisors | 78.311 | -6,52 | 2.803 | -6,82 | ||||
| 2026-01-22 | 13F | Comprehensive Money Management Services LLC | 7.526 | 0,00 | 269 | -0,37 | ||||
| 2025-10-17 | 13F | Retireful, LLC | 0 | -100,00 | 0 | |||||
| 2026-02-13 | 13F | Wells Fargo & Company/mn | 16.522 | 1,98 | 591 | 1,72 | ||||
| 2026-02-11 | 13F | Parallel Advisors, LLC | 5.708 | 3.467,50 | 204 | 3.980,00 | ||||
| 2026-02-09 | 13F | Prospera Financial Services Inc | 6.235 | -0,62 | 223 | -0,89 | ||||
| 2026-01-09 | 13F | First Heartland Consultants, Inc. | 7.281 | 261 | ||||||
| 2026-01-29 | 13F | UBS Group AG | 0 | -100,00 | 0 | |||||
| 2026-01-21 | 13F | Flagship Harbor Advisors, Llc | 71 | 3 | ||||||
| 2026-02-12 | 13F | Bank of Jackson Hole Trust | 0 | -100,00 | 0 | |||||
| 2026-01-14 | 13F | Worth Asset Management, LLC | 0 | -100,00 | 0 | |||||
| 2026-02-17 | 13F | Advisor Group Holdings, Inc. | 12.607 | -34,14 | 451 | -34,16 | ||||
| 2026-01-29 | 13F | Nbc Securities, Inc. | 1.429 | 0,00 | 51 | 0,00 | ||||
| 2026-02-09 | 13F | Key FInancial Inc | 0 | -100,00 | 0 | |||||
| 2026-02-12 | 13F | Summit Financial, LLC | 10.240 | 1,61 | 366 | 1,39 | ||||
| 2026-01-28 | 13F | Old National Bancorp /in/ | 15.895 | 0,48 | 569 | 0,18 | ||||
| 2026-01-23 | 13F | Smallwood Wealth Investment Management, LLC | 256 | 0,00 | 9 | 0,00 | ||||
| 2026-02-17 | 13F | Equitable Holdings, Inc. | 140.070 | -1,14 | 5.013 | -1,44 | ||||
| 2026-01-29 | 13F | Comerica Bank | 1.853 | 8,24 | 66 | 8,20 | ||||
| 2026-02-17 | 13F | Citadel Advisors Llc | 25.549 | 13,22 | 914 | 12,84 | ||||
| 2025-10-09 | 13F | Toth Financial Advisory Corp | 0 | -100,00 | 0 | |||||
| 2026-02-13 | 13F | Kestra Advisory Services, LLC | 0 | -100,00 | 0 | |||||
| 2026-01-20 | 13F | Aspiriant, Llc | 151.667 | 7,07 | 5.428 | 6,75 | ||||
| 2025-11-14 | 13F | Strategic Wealth Partners, Ltd. | 9.333 | 335 | ||||||
| 2026-01-23 | 13F | Farther Finance Advisors, LLC | 36.622 | 85,04 | 1.311 | 84,51 | ||||
| 2026-02-10 | 13F | Envestnet Asset Management Inc | 271.162 | -3,76 | 9.705 | -4,06 | ||||
| 2026-02-17 | 13F | Fmr Llc | 110 | 423,81 | 4 | |||||
| 2026-02-06 | 13F | Global Retirement Partners, LLC | 1.223 | -0,65 | 44 | -2,27 | ||||
| 2026-02-11 | 13F | O'shaughnessy Asset Management, Llc | 77 | 0,00 | 3 | 0,00 | ||||
| 2026-02-17 | 13F | Hilltop Holdings Inc. | 11.021 | -2,40 | 394 | -2,72 | ||||
| 2026-02-17 | 13F | Advisory Services Network, LLC | 0 | -100,00 | 0 | |||||
| 2026-02-13 | 13F | Centaurus Financial, Inc. | 3.701 | 2,44 | 0 | |||||
| 2026-02-17 | 13F | SageView Advisory Group, LLC | 619 | 22 | ||||||
| 2026-02-17 | 13F | IHT Wealth Management, LLC | 144.150 | 5.159 | ||||||
| 2026-02-04 | 13F | Ameritas Advisory Services, LLC | 0 | -100,00 | 0 | |||||
| 2026-01-16 | 13F | Perigon Wealth Management, LLC | 6.365 | 2,84 | 228 | 2,25 | ||||
| 2026-01-12 | 13F | Focus Financial Network, Inc. | 19.644 | -0,29 | 703 | -0,57 | ||||
| 2026-02-17 | 13F | Hyundai Investments Co., Ltd. | 12.154 | 436 | ||||||
| 2026-02-13 | 13F | McAdam, LLC | 10.401 | 12,39 | 372 | 12,05 | ||||
| 2026-01-27 | 13F | Osborne Partners Capital Management, Llc | 547.571 | 0,05 | 19.598 | -0,25 | ||||
| 2026-02-05 | 13F | Allworth Financial LP | 131 | 5 | ||||||
| 2026-01-27 | 13F | Belpointe Asset Management LLC | 9.829 | -7,37 | 352 | -7,63 | ||||
| 2026-01-22 | 13F | Good Steward Wealth Advisors,LLC | 12.396 | 2,83 | 444 | 2,55 | ||||
| 2026-02-09 | 13F | Harbour Investments, Inc. | 689 | 0,00 | 25 | 0,00 | ||||
| 2026-02-10 | 13F | ESL Trust Services, LLC | 2.383 | -20,11 | 85 | -20,56 | ||||
| 2026-02-10 | 13F | Savant Capital, LLC | 74.648 | -0,54 | 2.672 | -0,85 | ||||
| 2026-01-13 | 13F | CoreCap Advisors, LLC | 6 | 0,00 | 0 | |||||
| 2026-02-05 | 13F | New York Life Investment Management Llc | 857.413 | 11,28 | 30.687 | 10,94 | ||||
| 2026-01-29 | 13F | Quest 10 Wealth Builders, Inc. | 0 | -100,00 | 0 | |||||
| 2026-02-13 | 13F | Smartleaf Asset Management LLC | 6.344 | -30,80 | 228 | -30,58 | ||||
| 2026-02-11 | 13F | LPL Financial LLC | 84.212 | -22,78 | 3.014 | -23,02 | ||||
| 2026-02-13 | 13F | Gts Securities Llc | 0 | -100,00 | 0 | |||||
| 2026-02-17 | 13F | Private Advisor Group, LLC | 6.138 | -30,46 | 220 | -30,70 | ||||
| 2026-01-23 | 13F | Legacy Financial Strategies, LLC | 6.417 | -0,42 | 230 | -0,87 | ||||
| 2026-02-17 | 13F | Scarborough Advisors, LLC | 673 | 0,00 | 24 | 0,00 | ||||
| 2026-01-22 | 13F | HHM Wealth Advisors, LLC | 447 | 0,00 | 16 | -6,25 | ||||
| 2026-02-17 | 13F | Cetera Investment Advisers | 51.078 | -1,49 | 1.828 | -1,77 | ||||
| 2026-02-02 | 13F | Oppenheimer & Co Inc | 10.707 | -4,93 | 383 | -5,20 | ||||
| 2026-02-17 | 13F | Raymond James Financial Inc | 103.721 | 46,75 | 3.712 | 46,31 | ||||
| 2026-02-17 | 13F | Ameriprise Financial Inc | 284.540 | 49,98 | 10.185 | 49,65 | ||||
| 2026-02-11 | 13F | Janney Montgomery Scott LLC | 19.908 | -1,22 | 1 | |||||
| 2026-02-12 | 13F | CIBC Private Wealth Group, LLC | 610 | 22 | ||||||
| 2026-02-13 | 13F | Morgan Stanley | 719.936 | 3,53 | 25.767 | 3,22 | ||||
| 2026-02-06 | 13F | IFP Advisors, Inc | 1.568 | 1,69 | 56 | 1,82 | ||||
| 2026-01-14 | 13F | Wealthcare Advisory Partners LLC | 8.281 | -15,38 | 296 | -15,67 | ||||
| 2026-01-20 | 13F | Thurston, Springer, Miller, Herd & Titak, Inc. | 1.636 | 293,27 | 59 | 314,29 | ||||
| 2026-01-27 | 13F | Elevated Capital Advisors, LLC | 53 | 2 | ||||||
| 2026-01-23 | 13F | Cantor Fitzgerald Investment Adviser L.p. | 60.635 | -1,68 | 2.170 | -1,99 | ||||
| 2026-01-23 | 13F | Diversify Advisory Services, LLC | 6.732 | 0,00 | 242 | 0,41 | ||||
| 2026-02-17 | 13F | National Asset Management, Inc. | 105.719 | -2,84 | 3.784 | -3,15 | ||||
| 2026-02-18 | 13F | GWM Advisors LLC | 0 | -100,00 | 0 | |||||
| 2026-02-13 | 13F | Resources Investment Advisors, LLC. | 30.484 | -19,43 | 1.091 | -19,66 | ||||
| 2026-02-12 | 13F | Brinker Capital Investments, LLC | 21.393 | 1,17 | 766 | 0,79 | ||||
| 2026-02-05 | 13F | Duncan Williams Asset Management, LLC | 15.286 | -4,82 | 551 | -4,34 | ||||
| 2026-02-06 | 13F | Creative Financial Designs Inc /adv | 3.052 | 0,00 | 109 | 0,00 | ||||
| 2026-02-10 | 13F | Advisor Resource Council | 13.958 | 504 | ||||||
| 2026-02-03 | 13F | Costello Asset Management, INC | 300 | 0,00 | 11 | 0,00 | ||||
| 2026-02-05 | 13F | Atria Investments Llc | 8.313 | 298 | ||||||
| 2026-02-17 | 13F | Royal Bank Of Canada | 115.762 | 28,02 | 4.144 | 27,63 | ||||
| 2026-02-05 | 13F | Cambridge Investment Research Advisors, Inc. | 21.114 | -5,37 | 1 | |||||
| 2026-02-11 | 13F | Liberty Square Wealth Partners Llc | 35.513 | -31,92 | 1.271 | -32,10 | ||||
| 2026-02-14 | 13F | Rockefeller Capital Management L.P. | 26.633 | 197,71 | 953 | 196,88 | ||||
| 2026-01-16 | 13F | RHS Financial, LLC | 6.317 | -34,83 | 226 | -34,87 | ||||
| 2026-02-17 | 13F | Bank Of America Corp /de/ | 65.578 | 53,84 | 2.347 | 53,40 | ||||
| 2026-02-17 | 13F | Susquehanna International Group, Llp | 0 | -100,00 | 0 | |||||
| 2026-02-12 | 13F | Commonwealth Equity Services, Llc | 51.875 | -6,36 | 1.857 | 185.500,00 | ||||
| 2026-02-13 | 13F | SRS Capital Advisors, Inc. | 156 | 0,00 | 6 | 0,00 | ||||
| 2026-02-12 | 13F | Jane Street Group, Llc | 77.717 | 122,46 | 2.781 | 121,77 | ||||
| 2026-02-13 | 13F | MAI Capital Management | 12.726 | -4,71 | 455 | -5,01 | ||||
| 2026-02-17 | 13F | Integrated Advisors Network LLC | 13.146 | -0,05 | 470 | -0,42 | ||||
| 2026-01-26 | 13F | Cwm, Llc | 1.001 | -21,86 | 0 |