Grundlæggende statistik
| Institutionelle ejere | 100 total, 100 long only, 0 short only, 0 long/short - change of -3,85% MRQ |
| Gennemsnitlig porteføljeallokering | 0.1094 % - change of 1,49% MRQ |
| Institutionelle aktier (lange) | 10.874.360 (ex 13D/G) - change of 0,75MM shares 7,39% MRQ |
| Institutionel værdi (lang) | $ 156.084 USD ($1000) |
Institutionelt ejerskab og aktionærer
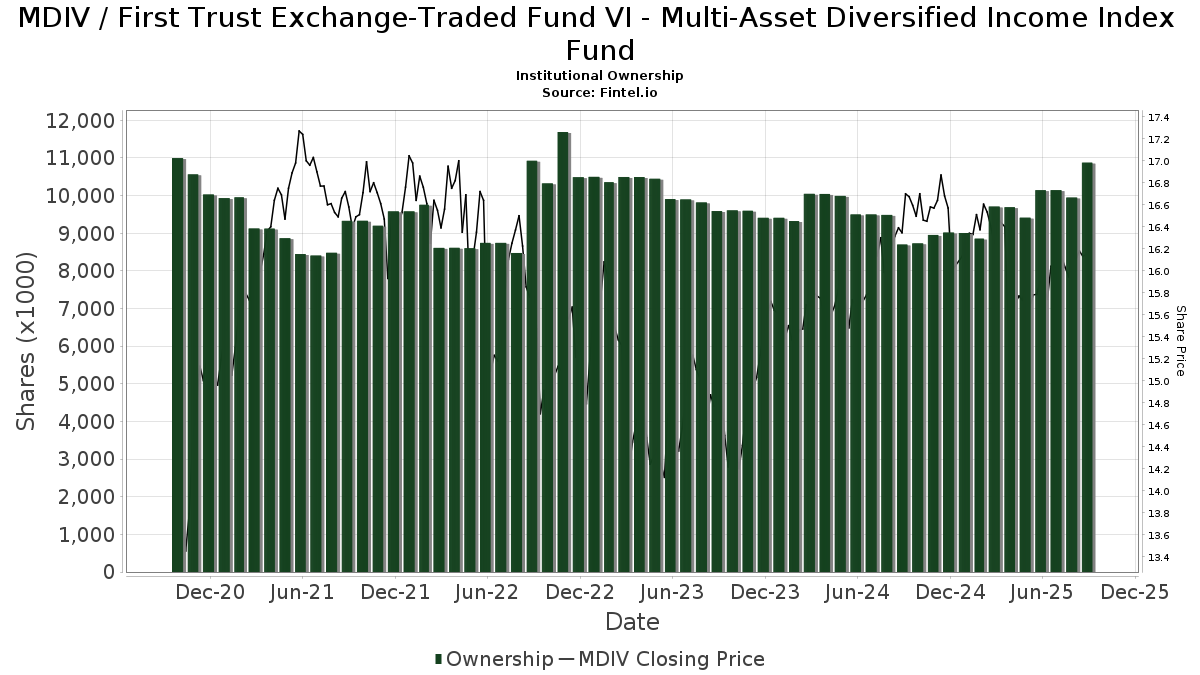
First Trust Exchange-Traded Fund VI - Multi-Asset Diversified Income Index Fund (US:MDIV) har 100 institutionelle ejere og aktionærer, der har indsendt 13D/G- eller 13F-formularer til Securities Exchange Commission (SEC). Disse institutioner har i alt 10,874,360 aktier. Største aktionærer omfatter Flaharty Asset Management, LLC, Ameriprise Financial Inc, LPL Financial LLC, Morgan Stanley, Commonwealth Equity Services, Llc, Bank Of America Corp /de/, Harbour Investments, Inc., Wells Fargo & Company/mn, Royal Bank Of Canada, and Raymond James Financial Inc .
First Trust Exchange-Traded Fund VI - Multi-Asset Diversified Income Index Fund (NasdaqGM:MDIV) institutionel ejerskabsstruktur viser aktuelle positioner i virksomheden efter institutioner og fonde, samt seneste ændringer i positionsstørrelse. Større aktionærer kan omfatte individuelle investorer, investeringsforeninger, hedgefonde eller institutioner. Skema 13D angiver, at investoren besidder (eller besidder) mere end 5 % af virksomheden og har til hensigt (eller har til hensigt at) aktivt at forfølge en ændring i forretningsstrategi. Skema 13G indikerer en passiv investering på over 5%.
The share price as of September 8, 2025 is 16,16 / share. Previously, on September 9, 2024, the share price was 16,32 / share. This represents a decline of 0,98% over that period.
Fondens stemningsscore
Fund Sentiment Score (fka Ownership Accumulation Score) finder de aktier, der bliver mest købt af fonde. Det er resultatet af en sofistikeret, multi-faktor kvantitativ model, der identificerer virksomheder med de højeste niveauer af institutionel akkumulering. Scoringsmodellen bruger en kombination af den samlede stigning i oplyste ejere, ændringerne i porteføljeallokeringer i disse ejere og andre målinger. Tallet går fra 0 til 100, hvor højere tal indikerer et højere niveau af akkumulering for sine jævnaldrende, og 50 er gennemsnittet.
Opdateringsfrekvens: Dagligt
Se Ownership Explorer, som giver en liste over højest rangerende virksomheder.
Institutionel Put/Call-forhold
Ud over at indberette standardaktie- og gældsudstedelser skal institutter med mere end 100 mill. aktiver under forvaltning også oplyse deres put- og call-optionsbeholdninger. Da salgsoptioner generelt indikerer negativ stemning, og købsoptioner indikerer positiv stemning, kan vi få en fornemmelse af den overordnede institutionelle stemning ved at plotte forholdet mellem put og kald. Diagrammet til højre viser det historiske put/call-forhold for dette instrument.
Brug af Put/Call Ratio som en indikator for investorernes stemning overvinder en af de vigtigste mangler ved at bruge totalt institutionelt ejerskab, som er, at en betydelig mængde af aktiver under forvaltning investeres passivt for at spore indekser. Passivt forvaltede fonde køber typisk ikke optioner, så indikatoren for put/call-forholdet følger mere nøje følelsen af aktivt forvaltede fonde.
13F og NPORT arkivering
Detaljer om 13F-arkivering er gratis. Detaljer om NP-ansøgninger kræver et premium-medlemskab. Grønne rækker angiver nye positioner. Røde rækker angiver lukkede positioner. Klik på linket ikon for at se den fulde transaktionshistorik.
Opgrader
for at låse premium-data op og eksportere til Excel ![]() .
.
| Fil dato | Kilde | Investor | Type | Gennemsnitlig pris (Øst) |
Aktier | Δ Aktier (%) |
Rapporteret Værdi ($1000) |
Δ Værdi (%) |
Port Alloc (%) |
|
|---|---|---|---|---|---|---|---|---|---|---|
| 2025-08-11 | 13F | Aptus Capital Advisors, LLC | 20.470 | -6,43 | 324 | -9,52 | ||||
| 2025-07-29 | 13F | Kraft, Davis & Associates, LLC | 10.420 | 0,00 | 167 | 3,09 | ||||
| 2025-08-06 | 13F | Wedbush Securities Inc | 82.555 | 0,17 | 1 | 0,00 | ||||
| 2025-08-08 | 13F | Flaharty Asset Management, LLC | 1.611.174 | 2,52 | 25.473 | -0,88 | ||||
| 2025-08-14 | 13F | Icon Wealth Advisors, LLC | 7.946 | 1,26 | 126 | -2,34 | ||||
| 2025-07-25 | 13F | Stephens Consulting, LLC | 200 | 0,00 | 3 | 0,00 | ||||
| 2025-08-11 | 13F | Synergy Investment Management, LLC | 0 | -100,00 | 0 | |||||
| 2025-08-12 | 13F | LPL Financial LLC | 1.196.971 | 0,74 | 18.924 | -2,59 | ||||
| 2025-08-04 | 13F | Arbor Capital Management Inc /adv | 16.008 | 18,44 | 255 | 15,38 | ||||
| 2025-08-11 | 13F | Principal Securities, Inc. | 380 | -3,31 | 6 | 0,00 | ||||
| 2025-08-12 | 13F | Cornerstone Wealth Management, LLC | 57.839 | 1,17 | 914 | -2,14 | ||||
| 2025-08-14 | 13F | Wiley Bros.-aintree Capital, Llc | 48.042 | 760 | ||||||
| 2025-08-15 | 13F | Morgan Stanley | 863.071 | 0,32 | 13.645 | -3,00 | ||||
| 2025-08-11 | 13F | Citigroup Inc | 2.000 | 0,00 | 32 | -3,12 | ||||
| 2025-08-14 | 13F | Citadel Advisors Llc | 10.659 | -75,72 | 169 | -76,57 | ||||
| 2025-08-14 | 13F/A | Rockefeller Capital Management L.P. | 151.455 | 29,37 | 2.395 | 25,08 | ||||
| 2025-08-14 | 13F | Harvest Investment Services, LLC | 107.125 | 1,86 | 1.694 | -1,51 | ||||
| 2025-08-06 | 13F | Commonwealth Equity Services, Llc | 702.944 | -1,37 | 11 | 0,00 | ||||
| 2025-09-04 | 13F/A | Advisor Group Holdings, Inc. | 138.292 | -5,81 | 2.186 | -8,92 | ||||
| 2025-08-11 | 13F | Cornerstone Planning Group LLC | 328 | 1,86 | 5 | 0,00 | ||||
| 2025-08-14 | 13F | Guardian Wealth Advisors, Llc / Nc | 2.572 | 0,00 | 41 | -4,76 | ||||
| 2025-08-14 | 13F | Snowden Capital Advisors LLC | 11.803 | -0,01 | 187 | -3,63 | ||||
| 2025-07-07 | 13F | Thurston, Springer, Miller, Herd & Titak, Inc. | 1.441 | 1,62 | 23 | -4,35 | ||||
| 2025-08-14 | 13F | Bank Of America Corp /de/ | 530.942 | -2,15 | 8.394 | -5,39 | ||||
| 2025-08-19 | 13F | Advisory Services Network, LLC | 11.633 | 6,19 | 185 | 3,35 | ||||
| 2025-07-08 | 13F | Nbc Securities, Inc. | 2.438 | 0,00 | 0 | |||||
| 2025-07-31 | 13F | Cambridge Investment Research Advisors, Inc. | 149.886 | -13,37 | 2 | 0,00 | ||||
| 2025-08-04 | 13F | L.m. Kohn & Company | 0 | -100,00 | 0 | |||||
| 2025-08-08 | 13F | Pnc Financial Services Group, Inc. | 655 | 0,00 | 10 | 0,00 | ||||
| 2025-05-14 | 13F | Northwestern Mutual Wealth Management Co | 0 | -100,00 | 0 | |||||
| 2025-07-25 | 13F | Atria Wealth Solutions, Inc. | 26.605 | 0,44 | 421 | -3,00 | ||||
| 2025-05-13 | 13F | Thrivent Financial For Lutherans | 0 | -100,00 | 0 | |||||
| 2025-07-24 | 13F | IFP Advisors, Inc | 20.669 | -5,27 | 327 | -8,43 | ||||
| 2025-08-13 | 13F | Rockport Wealth LLC | 234.411 | 3,95 | 3.706 | 0,52 | ||||
| 2025-08-12 | 13F | Jaffetilchin Investment Partners, LLC | 41.925 | -2,65 | 663 | -5,97 | ||||
| 2025-08-14 | 13F | UBS Group AG | 73.456 | -1,84 | 1.161 | -5,07 | ||||
| 2025-05-12 | 13F | Independent Advisor Alliance | 0 | -100,00 | 0 | |||||
| 2025-07-28 | 13F | Harbour Investments, Inc. | 360.401 | 12,98 | 5.698 | 9,22 | ||||
| 2025-08-08 | 13F | Fortis Group Advisors, LLC | 51.095 | 814 | ||||||
| 2025-08-06 | 13F | Prospera Financial Services Inc | 15.508 | 245 | ||||||
| 2025-08-18 | 13F/A | National Bank Of Canada /fi/ | 1.543 | 0,00 | 24 | -4,00 | ||||
| 2025-07-11 | 13F | Farther Finance Advisors, LLC | 15.522 | -8,03 | 245 | -11,23 | ||||
| 2025-08-13 | 13F | RPg Family Wealth Advisory, LLC | 20.450 | 0,00 | 323 | -3,29 | ||||
| 2025-08-08 | 13F | Larson Financial Group LLC | 36.835 | -1,34 | 582 | -4,59 | ||||
| 2025-08-14 | 13F | Raymond James Financial Inc | 280.114 | -0,49 | 4.429 | -3,80 | ||||
| 2025-07-21 | 13F | Ameritas Advisory Services, LLC | 22.208 | -3,19 | 351 | -5,14 | ||||
| 2025-07-25 | 13F | Endowment Wealth Management, Inc. | 38.716 | 10,63 | 612 | 6,99 | ||||
| 2025-08-14 | 13F | Comerica Bank | 11.394 | 0,00 | 180 | -3,23 | ||||
| 2025-07-11 | 13F | Pinnacle Bancorp, Inc. | 1.000 | 0,00 | 16 | -6,25 | ||||
| 2025-08-13 | 13F | StoneX Group Inc. | 11.993 | -32,17 | 190 | -34,60 | ||||
| 2025-08-08 | 13F | Capital Investment Advisory Services, LLC | 200.879 | -8,08 | 3.176 | -11,14 | ||||
| 2025-07-16 | 13F | ORG Partners LLC | 5.000 | 0,00 | 80 | -3,66 | ||||
| 2025-07-18 | 13F | Truist Financial Corp | 23.300 | -21,42 | 368 | -23,97 | ||||
| 2025-08-13 | 13F | Millstone Evans Group, LLC | 310 | 0,00 | 5 | -20,00 | ||||
| 2025-07-31 | 13F | Moloney Securities Asset Management, LLC | 0 | -100,00 | 0 | |||||
| 2025-07-29 | 13F | Elevation Capital Advisory, LLC | 0 | -100,00 | 0 | -100,00 | ||||
| 2025-08-13 | 13F | Jones Financial Companies Lllp | 57.483 | 11,07 | 906 | 7,35 | ||||
| 2025-08-14 | 13F | Wells Fargo & Company/mn | 353.567 | -16,86 | 5.590 | -19,63 | ||||
| 2025-07-17 | 13F | Sound Income Strategies, LLC | 0 | -100,00 | 0 | |||||
| 2025-08-12 | 13F | Park Square Financial Group, LLC | 278 | 0,00 | 4 | 0,00 | ||||
| 2025-07-17 | 13F | Janney Montgomery Scott LLC | 51.001 | -13,00 | 1 | |||||
| 2025-08-18 | 13F | Geneos Wealth Management Inc. | 2.515 | 0,00 | 40 | -4,88 | ||||
| 2025-08-14 | 13F | Stifel Financial Corp | 60.756 | -0,16 | 961 | -3,52 | ||||
| 2025-07-21 | 13F | DHJJ Financial Advisors, Ltd. | 30 | 0,00 | 0 | |||||
| 2025-07-03 | 13F | TrueWealth Advisors, LLC | 53.350 | -21,01 | 843 | -23,64 | ||||
| 2025-08-18 | 13F | Second Line Capital, LLC | 17.898 | -7,29 | 283 | -10,48 | ||||
| 2025-08-12 | 13F | PSI Advisors, LLC | 32.851 | 47,61 | 519 | 42,98 | ||||
| 2025-08-19 | 13F | Newbridge Financial Services Group, Inc. | 2.536 | -45,05 | 40 | -46,67 | ||||
| 2025-08-06 | 13F | AE Wealth Management LLC | 0 | -100,00 | 0 | |||||
| 2025-08-12 | 13F | Jpmorgan Chase & Co | 1.000 | 16 | ||||||
| 2025-08-14 | 13F | Susquehanna International Group, Llp | 0 | -100,00 | 0 | |||||
| 2025-08-14 | 13F | Freedom Financial Partners LLC | 33.832 | -3,88 | 535 | -7,13 | ||||
| 2025-05-12 | 13F | Richard W. Paul & Associates, LLC | 0 | -100,00 | 0 | |||||
| 2025-08-11 | 13F | HighTower Advisors, LLC | 32.014 | -11,44 | 506 | -14,38 | ||||
| 2025-08-08 | 13F | Intrua Financial, LLC | 25.495 | 0,00 | 403 | -3,12 | ||||
| 2025-07-23 | 13F | Tcfg Wealth Management, Llc | 61.357 | 0,21 | 970 | -3,10 | ||||
| 2025-08-05 | 13F | Sigma Planning Corp | 50.786 | -31,04 | 803 | -33,39 | ||||
| 2025-08-12 | 13F | MAI Capital Management | 6.094 | -3,05 | 96 | -5,88 | ||||
| 2025-08-13 | 13F | Baird Financial Group, Inc. | 14.134 | 17,78 | 223 | 13,78 | ||||
| 2025-08-04 | 13F | IFG Advisory, LLC | 0 | -100,00 | 0 | |||||
| 2025-08-12 | 13F | Steward Partners Investment Advisory, Llc | 1.898 | -0,68 | 30 | -3,23 | ||||
| 2025-08-14 | 13F | Fmr Llc | 197 | 3 | ||||||
| 2025-08-11 | 13F | Private Advisor Group, LLC | 53.774 | -4,50 | 850 | -7,61 | ||||
| 2025-08-14 | 13F | Royal Bank Of Canada | 344.627 | 4,17 | 5.449 | 0,72 | ||||
| 2025-07-24 | 13F | Us Bancorp \de\ | 1.800 | 0,00 | 28 | -3,45 | ||||
| 2025-08-14 | 13F | GWM Advisors LLC | 17.310 | 3,56 | 274 | 0,00 | ||||
| 2025-08-01 | 13F | Envestnet Asset Management Inc | 45.202 | -24,10 | 715 | -26,62 | ||||
| 2025-07-29 | 13F | Huntleigh Advisors, Inc. | 10.051 | 0,14 | 159 | -3,66 | ||||
| 2025-08-14 | 13F | Ameriprise Financial Inc | 1.538.244 | 147,05 | 24.348 | 139,15 | ||||
| 2025-04-17 | 13F | Authentikos Wealth Advisory, LLC | 0 | -100,00 | 0 | |||||
| 2025-07-10 | 13F | Wealth Enhancement Advisory Services, Llc | 19.764 | 0,38 | 317 | -1,56 | ||||
| 2025-07-29 | 13F | Cottonwood Capital Advisors, Llc | 66.592 | -0,02 | 1.053 | -3,40 | ||||
| 2025-05-09 | 13F | GeoWealth Management, LLC | 0 | -100,00 | 0 | |||||
| 2025-07-16 | 13F/A | CX Institutional | 851 | -0,23 | 0 | |||||
| 2025-08-08 | 13F | Cetera Investment Advisers | 269.657 | 5,74 | 4.263 | 2,23 | ||||
| 2025-08-12 | 13F | Global Retirement Partners, LLC | 7.778 | 0,00 | 123 | -2,40 | ||||
| 2025-08-12 | 13F | Founders Financial Alliance, LLC | 2.252 | 1,30 | 36 | -2,78 | ||||
| 2025-05-13 | 13F | EPG Wealth Management LLC | 0 | -100,00 | 0 | -100,00 | ||||
| 2025-08-14 | 13F | Smartleaf Asset Management LLC | 7 | 0,00 | 0 | |||||
| 2025-07-25 | 13F | Concurrent Investment Advisors, LLC | 38.941 | 19,46 | 616 | 15,38 | ||||
| 2025-08-12 | 13F | Proequities, Inc. | 0 | 0 | ||||||
| 2025-08-13 | 13F | Keystone Financial Group | 17.389 | -0,70 | 275 | -4,20 | ||||
| 2025-07-25 | 13F | Total Clarity Wealth Management, Inc. | 56.800 | 898 | ||||||
| 2025-07-29 | 13F | International Assets Investment Management, Llc | 47.205 | 102,79 | 746 | 96,32 | ||||
| 2025-07-25 | 13F | Cwm, Llc | 100 | 0,00 | 0 | |||||
| 2025-08-05 | 13F | GPS Wealth Strategies Group, LLC | 3.012 | 0,00 | 48 | -4,08 | ||||
| 2025-08-12 | 13F | SRS Capital Advisors, Inc. | 300 | 0,00 | 5 | 0,00 | ||||
| 2025-07-22 | 13F | Coastal Investment Advisors, Inc. | 0 | -100,00 | 0 | |||||
| 2025-07-29 | 13F | Stratos Wealth Partners, LTD. | 22.233 | 45,62 | 352 | 40,96 | ||||
| 2025-08-05 | 13F | Bank Of Montreal /can/ | 400 | 0,00 | 6 | 0,00 | ||||
| 2025-08-13 | 13F | Proactive Wealth Strategies LLC | 15.400 | 0,00 | 0 | |||||
| 2025-07-23 | 13F | Bellevue Asset Management, Llc | 1.169 | -12,63 | 18 | -14,29 | ||||
| 2025-08-06 | 13F | Cherry Creek Investment Advisors, Inc. | 0 | -100,00 | 0 | |||||
| 2025-05-05 | 13F | Transce3nd, LLC | 0 | -100,00 | 0 | |||||
| 2025-07-15 | 13F | Elevated Capital Advisors, LLC | 72.300 | 0,00 | 1.182 | 0,00 | ||||
| 2025-08-01 | 13F | Bessemer Group Inc | 150 | -98,36 | 0 | |||||
| 2025-08-13 | 13F | EverSource Wealth Advisors, LLC | 196 | 18,79 | 3 | 50,00 | ||||
| 2025-08-14 | 13F | CoreCap Advisors, LLC | 800 | 0,00 | 13 | -7,69 | ||||
| 2025-08-15 | 13F | Kestra Advisory Services, LLC | 128.401 | 3,82 | 2.030 | 0,40 |
Other Listings
| MX:MDIV |