Grundlæggende statistik
| Institutionelle aktier (lange) | 5.551.112 - 38,99% (ex 13D/G) - change of -0,70MM shares -11,20% MRQ |
| Institutionel værdi (lang) | $ 90.697 USD ($1000) |
Institutionelt ejerskab og aktionærer
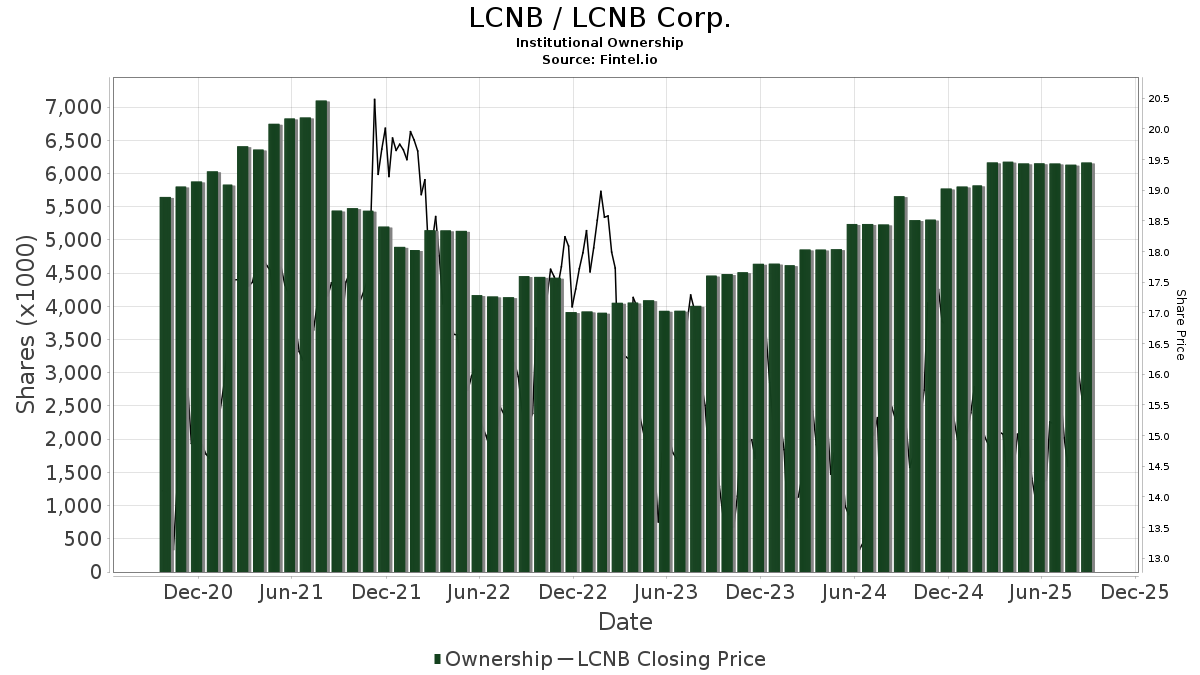
LCNB Corp. (US:LCNB) har 102 institutionelle ejere og aktionærer, der har indsendt 13D/G- eller 13F-formularer til Securities Exchange Commission (SEC). Disse institutioner har i alt 5,551,112 aktier. Største aktionærer omfatter BlackRock, Inc., Vanguard Group Inc, Ritter Daniher Financial Advisory LLC / DE, Lcnb Corp, Dimensional Fund Advisors Lp, Geode Capital Management, Llc, State Street Corp, Renaissance Technologies Llc, Johnson Investment Counsel Inc, and Bridgeway Capital Management Inc .
LCNB Corp. (NasdaqCM:LCNB) institutionel ejerskabsstruktur viser aktuelle positioner i virksomheden efter institutioner og fonde, samt seneste ændringer i positionsstørrelse. Større aktionærer kan omfatte individuelle investorer, investeringsforeninger, hedgefonde eller institutioner. Skema 13D angiver, at investoren besidder (eller besidder) mere end 5 % af virksomheden og har til hensigt (eller har til hensigt at) aktivt at forfølge en ændring i forretningsstrategi. Skema 13G indikerer en passiv investering på over 5%.
The share price as of April 10, 2026 is 16,95 / share. Previously, on April 11, 2025, the share price was 13,64 / share. This represents an increase of 24,27% over that period.
Fondens stemningsscore
Fund Sentiment Score (fka Ownership Accumulation Score) finder de aktier, der bliver mest købt af fonde. Det er resultatet af en sofistikeret, multi-faktor kvantitativ model, der identificerer virksomheder med de højeste niveauer af institutionel akkumulering. Scoringsmodellen bruger en kombination af den samlede stigning i oplyste ejere, ændringerne i porteføljeallokeringer i disse ejere og andre målinger. Tallet går fra 0 til 100, hvor højere tal indikerer et højere niveau af akkumulering for sine jævnaldrende, og 50 er gennemsnittet.
Opdateringsfrekvens: Dagligt
Se Ownership Explorer, som giver en liste over højest rangerende virksomheder.
AI+ Ask Fintel’s AI assistant about LCNB Corp..
Select a question to share a public post with an AI-crafted answer.
Thinking of good questions…
Institutionel Put/Call-forhold
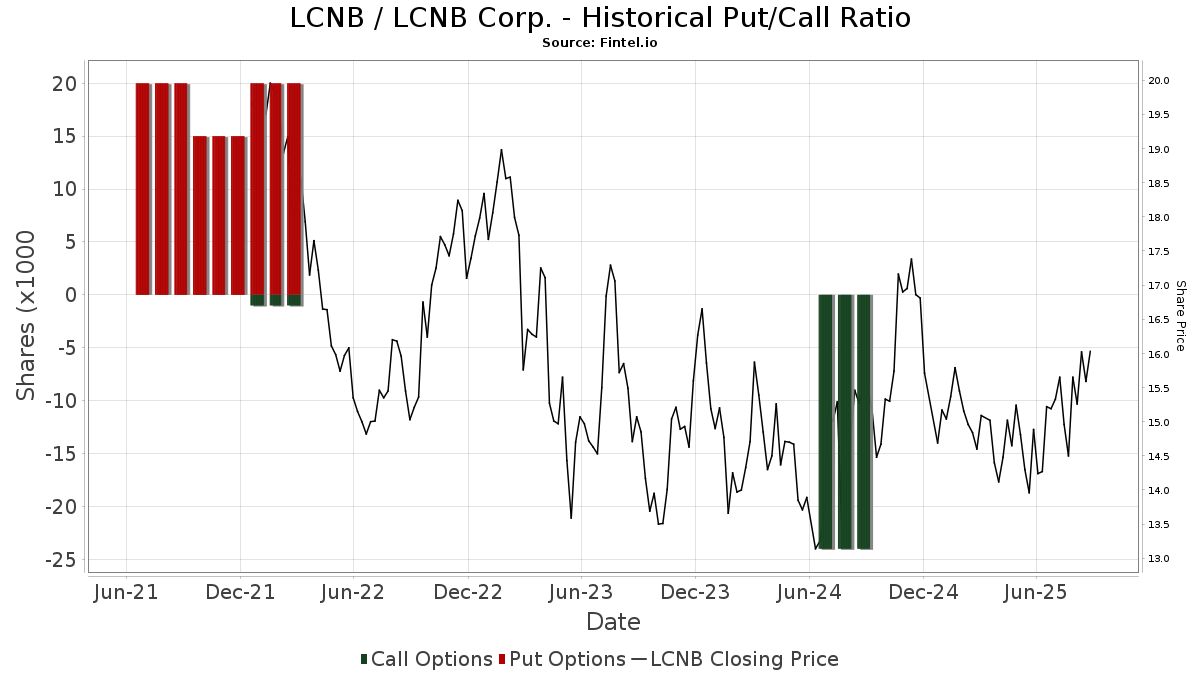
Ud over at indberette standardaktie- og gældsudstedelser skal institutter med mere end 100 mill. aktiver under forvaltning også oplyse deres put- og call-optionsbeholdninger. Da salgsoptioner generelt indikerer negativ stemning, og købsoptioner indikerer positiv stemning, kan vi få en fornemmelse af den overordnede institutionelle stemning ved at plotte forholdet mellem put og kald. Diagrammet til højre viser det historiske put/call-forhold for dette instrument.
Brug af Put/Call Ratio som en indikator for investorernes stemning overvinder en af de vigtigste mangler ved at bruge totalt institutionelt ejerskab, som er, at en betydelig mængde af aktiver under forvaltning investeres passivt for at spore indekser. Passivt forvaltede fonde køber typisk ikke optioner, så indikatoren for put/call-forholdet følger mere nøje følelsen af aktivt forvaltede fonde.
13F og NPORT arkivering
Detaljer om 13F-arkivering er gratis. Detaljer om NP-ansøgninger kræver et premium-medlemskab. Grønne rækker angiver nye positioner. Røde rækker angiver lukkede positioner. Klik på linket ikon for at se den fulde transaktionshistorik.
Opgrader
for at låse premium-data op og eksportere til Excel ![]() .
.
| Fil dato | Kilde | Investor | Type | Gennemsnitlig pris (Øst) |
Aktier | Δ Aktier (%) |
Rapporteret Værdi ($1000) |
Δ Værdi (%) |
Port Alloc (%) |
|
|---|---|---|---|---|---|---|---|---|---|---|
| 2026-02-02 | 13F | Equitable Trust Co | 11.377 | -23,46 | 186 | -16,22 | ||||
| 2026-02-09 | 13F | Legal & General Group Plc | 1.092 | -17,52 | 18 | -10,53 | ||||
| 2026-02-13 | 13F | Maltese Capital Management Llc | 20.500 | 336 | ||||||
| 2026-02-17 | 13F | Citadel Advisors Llc | 33.358 | -33,36 | 547 | -27,20 | ||||
| 2026-02-10 | 13F | Ritter Daniher Financial Advisory LLC / DE | 545.227 | 0,00 | 8.936 | 9,35 | ||||
| 2026-02-06 | 13F | Covestor Ltd | 69 | 38,00 | 0 | |||||
| 2026-04-07 | 13F | Farther Finance Advisors, LLC | 76 | -24,00 | 1 | 0,00 | ||||
| 2026-02-13 | 13F | Johnson Investment Counsel Inc | 136.848 | -0,26 | 2.243 | 9,05 | ||||
| 2026-02-13 | 13F | Barclays Plc | 45.945 | 64,94 | 753 | 79,71 | ||||
| 2026-02-13 | 13F | Wells Fargo & Company/mn | 17.119 | 38,65 | 281 | 51,35 | ||||
| 2026-02-17 | 13F | Tower Research Capital LLC (TRC) | 670 | -26,70 | 11 | -23,08 | ||||
| 2026-01-30 | 13F | Us Bancorp \de\ | 650 | 0,00 | 11 | 11,11 | ||||
| 2026-02-17 | 13F | Northern Trust Corp | 92.080 | -8,72 | 1.509 | -0,20 | ||||
| 2025-11-12 | 13F | Bahl & Gaynor Inc | 0 | -100,00 | 0 | |||||
| 2026-02-12 | 13F | BlackRock, Inc. | 817.970 | 4,54 | 13.407 | 14,31 | ||||
| 2026-02-05 | 13F | Amalgamated Bank | 423 | -4,30 | 0 | |||||
| 2026-02-04 | 13F | Shoker Investment Counsel, Inc. | 16.951 | 278 | ||||||
| 2026-02-17 | 13F | SageView Advisory Group, LLC | 522 | 9 | ||||||
| 2026-01-21 | 13F | Baker Ellis Asset Management LLC | 16.500 | -37,74 | 270 | -31,99 | ||||
| 2026-02-13 | 13F | Charles Schwab Investment Management Inc | 38.144 | 0,00 | 625 | 9,46 | ||||
| 2026-01-26 | 13F | Cwm, Llc | 2.779 | 11,56 | 0 | |||||
| 2026-02-13 | 13F | Panagora Asset Management Inc | 13.244 | 217 | ||||||
| 2026-02-13 | 13F | MAI Capital Management | 5.704 | 0,07 | 93 | 9,41 | ||||
| 2026-02-17 | 13F | Raymond James Financial Inc | 20.773 | 0,39 | 340 | 9,68 | ||||
| 2026-02-04 | 13F | Bailard, Inc. | 19.013 | 312 | ||||||
| 2026-02-10 | 13F | IAG Wealth Partners, LLC | 800 | 0,00 | 13 | 18,18 | ||||
| 2025-11-14 | 13F | Susquehanna International Group, Llp | 0 | -100,00 | 0 | |||||
| 2026-02-17 | 13F | Bank Of America Corp /de/ | 35.332 | 18,06 | 579 | 29,24 | ||||
| 2026-02-12 | 13F | Renaissance Technologies Llc | 138.116 | 7,14 | 2.264 | 17,13 | ||||
| 2026-02-11 | 13F | O'shaughnessy Asset Management, Llc | 15.488 | 254 | ||||||
| 2026-02-10 | 13F | Lido Advisors, LLC | 15.729 | 0,00 | 236 | 0,00 | ||||
| 2026-02-17 | 13F | Aqr Capital Management Llc | 32.113 | 23,74 | 526 | 35,22 | ||||
| 2026-02-17 | 13F | California State Teachers Retirement System | 826 | -17,81 | 14 | -13,33 | ||||
| 2026-01-23 | 13F | Ritholtz Wealth Management | 14.441 | 237 | ||||||
| 2026-02-11 | 13F | MCF Advisors LLC | 872 | 14 | ||||||
| 2026-02-05 | 13F | Kapstone Financial Advisors LLC | 86.067 | -3,23 | 1.411 | 5,78 | ||||
| 2026-02-10 | 13F/A | Northwestern Mutual Wealth Management Co | 2.845 | 0,00 | 47 | 9,52 | ||||
| 2026-02-12 | 13F | Jane Street Group, Llc | 0 | -100,00 | 0 | |||||
| 2026-02-03 | 13F | SBI Securities Co., Ltd. | 4 | -42,86 | 0 | |||||
| 2026-02-12 | 13F | FineMark National Bank & Trust | 11.953 | 0,00 | 196 | 8,94 | ||||
| 2026-02-10 | 13F | Connor, Clark & Lunn Investment Management Ltd. | 60.929 | 1,71 | 999 | 11,14 | ||||
| 2026-02-19 | 13F | Invesco Ltd. | 11.908 | 195 | ||||||
| 2026-02-06 | 13F | Kimelman & Baird, LLC | 11.500 | 0,00 | 188 | 9,30 | ||||
| 2026-01-29 | 13F | UBS Group AG | 3.134 | -62,85 | 51 | -59,52 | ||||
| 2026-02-13 | 13F | Citigroup Inc | 548 | 106,79 | 9 | 166,67 | ||||
| 2026-01-22 | 13F | Bartlett & Co. Wealth Management Llc | 37.713 | 0,03 | 618 | 9,38 | ||||
| 2026-01-15 | 13F | Hengehold Capital Management Llc | 33.686 | 20,14 | 552 | 31,43 | ||||
| 2026-02-13 | 13F | Kilter Group LLC | 8 | 0 | ||||||
| 2026-02-11 | 13F | Ameritas Investment Partners, Inc. | 873 | 14 | ||||||
| 2026-02-13 | 13F | Axim Planning & Wealth | 11.500 | 0,00 | 188 | 9,30 | ||||
| 2026-02-13 | 13F | Arrowstreet Capital, Limited Partnership | 16.041 | 0,00 | 263 | 9,17 | ||||
| 2026-02-09 | 13F | Geode Capital Management, Llc | 329.487 | 0,36 | 5.402 | 9,73 | ||||
| 2026-02-13 | 13F | Rhumbline Advisers | 17.103 | -9,32 | 280 | -0,71 | ||||
| 2026-01-29 | 13F | Vanguard Group Inc | 705.265 | 0,33 | 11.559 | 9,70 | ||||
| 2026-01-28 | 13F | Cornerstone Advisory, LLC | 21.000 | 0,00 | 344 | 9,55 | ||||
| 2026-02-11 | 13F | Los Angeles Capital Management Llc | 9.471 | 146 | ||||||
| 2026-02-10 | 13F | Lcnb Corp | 506.663 | 0,93 | 8.304 | 10,37 | ||||
| 2026-02-17 | 13F | Millennium Management Llc | 0 | -100,00 | 0 | |||||
| 2026-04-06 | 13F | GAMMA Investing LLC | 318 | 78,65 | 5 | 100,00 | ||||
| 2026-02-06 | 13F | EverSource Wealth Advisors, LLC | 47 | -2,08 | 1 | |||||
| 2026-02-13 | 13F | Morgan Stanley | 67.933 | 23,08 | 1.113 | 34,58 | ||||
| 2026-02-17 | 13F | Optiver Holding B.V. | 164 | 0,00 | 3 | 0,00 | ||||
| 2026-02-09 | 13F | Hartland & Co., LLC | 1 | -88,89 | 0 | |||||
| 2026-02-10 | 13F | Acadian Asset Management Llc | 6.811 | 89,77 | 0 | |||||
| 2026-02-05 | 13F | Center for Financial Planning, Inc. | 12.664 | 0,00 | 208 | 9,52 | ||||
| 2026-01-08 | 13F | True Wealth Design, LLC | 11 | 10,00 | 0 | |||||
| 2026-02-13 | 13F | Police & Firemen's Retirement System of New Jersey | 4.701 | -1,18 | 77 | 8,45 | ||||
| 2026-02-13 | 13F | Great West Life Assurance Co /can/ | 1.648 | 57,70 | 0 | |||||
| 2026-02-10 | 13F | Bnp Paribas Arbitrage, Sa | 4.019 | 11,58 | 66 | 22,64 | ||||
| 2026-02-12 | 13F | American Financial Group Inc | 93.582 | 0,00 | 1.534 | 9,34 | ||||
| 2026-03-06 | 13F | Hsbc Holdings Plc | 34.466 | 23,28 | 561 | 32,94 | ||||
| 2026-02-02 | 13F | Souders Financial Advisors | 17.734 | 4,80 | 291 | 14,62 | ||||
| 2026-02-10 | 13F | New Republic Capital, LLC | 17.488 | 0,00 | 287 | 9,16 | ||||
| 2026-02-17 | 13F | Royal Bank Of Canada | 328 | -61,86 | 5 | -61,54 | ||||
| 2025-11-14 | 13F | Corton Capital Inc. | 10.321 | 155 | ||||||
| 2026-02-06 | 13F | Pnc Financial Services Group, Inc. | 31 | 93,75 | 1 | |||||
| 2026-02-17 | 13F | Quadrature Capital Ltd | 10.434 | 171 | ||||||
| 2026-02-17 | 13F | Bridgeway Capital Management Inc | 115.706 | 6,34 | 1.896 | 16,25 | ||||
| 2026-02-10 | 13F | Goldman Sachs Group Inc | 62.382 | 37,59 | 1.022 | 50,52 | ||||
| 2026-02-11 | 13F | Deutsche Bank Ag\ | 0 | -100,00 | 0 | |||||
| 2026-02-17 | 13F | Cetera Investment Advisers | 81.684 | 0,00 | 1.339 | 9,31 | ||||
| 2025-11-14 | 13F | Fourthstone LLC | 0 | -100,00 | 0 | -100,00 | ||||
| 2025-11-14 | 13F | Two Sigma Investments, Lp | 0 | -100,00 | 0 | |||||
| 2026-02-09 | 13F | Huntington National Bank | 1 | 0,00 | 0 | |||||
| 2026-02-17 | 13F | Two Sigma Advisers, Lp | 0 | -100,00 | 0 | |||||
| 2026-02-13 | 13F | Squarepoint Ops LLC | 14.767 | -36,31 | 242 | -30,26 | ||||
| 2026-02-12 | 13F | Dimensional Fund Advisors Lp | 494.644 | 4,68 | 8.107 | 14,46 | ||||
| 2026-02-13 | 13F | State Street Corp | 180.882 | 0,35 | 2.965 | 9,70 | ||||
| 2026-02-17 | 13F | Russell Investments Group, Ltd. | 1.496 | 25,71 | 25 | 41,18 | ||||
| 2026-02-10 | 13F | Bank of New York Mellon Corp | 56.232 | -0,10 | 922 | 9,25 | ||||
| 2026-02-12 | 13F | Commonwealth Equity Services, Llc | 27.929 | -11,43 | 458 | |||||
| 2026-02-06 | 13F | IFP Advisors, Inc | 17 | 6,25 | 0 | |||||
| 2026-02-18 | 13F | GWM Advisors LLC | 619 | -95,63 | 10 | -95,28 | ||||
| 2026-02-20 | 13F | Sunbelt Securities, Inc. | 1 | 0 | ||||||
| 2026-02-11 | 13F | LPL Financial LLC | 27.904 | 4,36 | 457 | 14,25 | ||||
| 2026-02-12 | 13F | New York State Common Retirement Fund | 4.699 | 0,00 | 77 | 10,00 | ||||
| 2026-02-11 | 13F | Jpmorgan Chase & Co | 9.478 | -30,49 | 155 | -24,02 | ||||
| 2026-02-13 | 13F | Sterling Capital Management LLC | 776 | -16,47 | 13 | -7,69 | ||||
| 2026-01-30 | 13F | Pekin Hardy Strauss, Inc. | 13.165 | 24,48 | 216 | 36,08 | ||||
| 2026-02-09 | 13F | Harbour Investments, Inc. | 1.625 | 0,00 | 27 | 8,33 | ||||
| 2026-02-05 | 13F | Allworth Financial LP | 6.614 | -0,02 | 108 | 9,09 | ||||
| 2026-02-17 | 13F | MIRAE ASSET GLOBAL ETFS HOLDINGS Ltd. | 6.284 | 0,74 | 103 | 9,68 | ||||
| 2026-02-12 | 13F | MetLife Investment Management, LLC | 6.451 | 0,00 | 106 | 9,38 | ||||
| 2026-02-04 | 13F | HORAN Wealth, LLC | 78.601 | 4,46 | 1.288 | 14,29 | ||||
| 2026-02-11 | 13F | Empowered Funds, LLC | 72.106 | 10,58 | 1.182 | 20,88 | ||||
| 2026-02-12 | 13F | Nuveen, LLC | 15.385 | 0,00 | 252 | 9,57 | ||||
| 2026-01-21 | 13F | SJS Investment Consulting Inc. | 5 | 0 | ||||||
| 2026-02-13 | 13F | SRS Capital Advisors, Inc. | 0 | -100,00 | 0 | |||||
| 2026-02-17 | 13F | Fmr Llc | 391 | 15,68 | 6 | 20,00 | ||||
| 2026-02-10 | 13F | Rothschild Investment Llc | 20 | 185,71 | 0 | |||||
| 2026-02-17 | 13F | Advisor Group Holdings, Inc. | 98 | -5,77 | 2 | 0,00 |