Grundlæggende statistik
| Institutionelle ejere | 100 total, 100 long only, 0 short only, 0 long/short - change of -3,81% MRQ |
| Gennemsnitlig porteføljeallokering | 0.3189 % - change of -0,76% MRQ |
| Institutionelle aktier (lange) | 7.710.003 (ex 13D/G) - change of -0,71MM shares -8,47% MRQ |
| Institutionel værdi (lang) | $ 336.066 USD ($1000) |
Institutionelt ejerskab og aktionærer
J.P. Morgan Exchange-Traded Fund Trust - JPMorgan Diversified Return U.S. Small Cap Equity ETF (US:JPSE) har 100 institutionelle ejere og aktionærer, der har indsendt 13D/G- eller 13F-formularer til Securities Exchange Commission (SEC). Disse institutioner har i alt 7,710,003 aktier. Største aktionærer omfatter Koss-Olinger Consulting, LLC, LPL Financial LLC, Raymond James Financial Inc, Bank Of America Corp /de/, Royal Bank Of Canada, Hartford Financial Management Inc., Morgan Stanley, Goldstein Advisors, LLC, Stifel Financial Corp, and Northwestern Mutual Wealth Management Co .
J.P. Morgan Exchange-Traded Fund Trust - JPMorgan Diversified Return U.S. Small Cap Equity ETF (ARCA:JPSE) institutionel ejerskabsstruktur viser aktuelle positioner i virksomheden efter institutioner og fonde, samt seneste ændringer i positionsstørrelse. Større aktionærer kan omfatte individuelle investorer, investeringsforeninger, hedgefonde eller institutioner. Skema 13D angiver, at investoren besidder (eller besidder) mere end 5 % af virksomheden og har til hensigt (eller har til hensigt at) aktivt at forfølge en ændring i forretningsstrategi. Skema 13G indikerer en passiv investering på over 5%.
The share price as of September 10, 2025 is 49,63 / share. Previously, on September 11, 2024, the share price was 45,06 / share. This represents an increase of 10,13% over that period.

Fondens stemningsscore
Fund Sentiment Score (fka Ownership Accumulation Score) finder de aktier, der bliver mest købt af fonde. Det er resultatet af en sofistikeret, multi-faktor kvantitativ model, der identificerer virksomheder med de højeste niveauer af institutionel akkumulering. Scoringsmodellen bruger en kombination af den samlede stigning i oplyste ejere, ændringerne i porteføljeallokeringer i disse ejere og andre målinger. Tallet går fra 0 til 100, hvor højere tal indikerer et højere niveau af akkumulering for sine jævnaldrende, og 50 er gennemsnittet.
Opdateringsfrekvens: Dagligt
Se Ownership Explorer, som giver en liste over højest rangerende virksomheder.
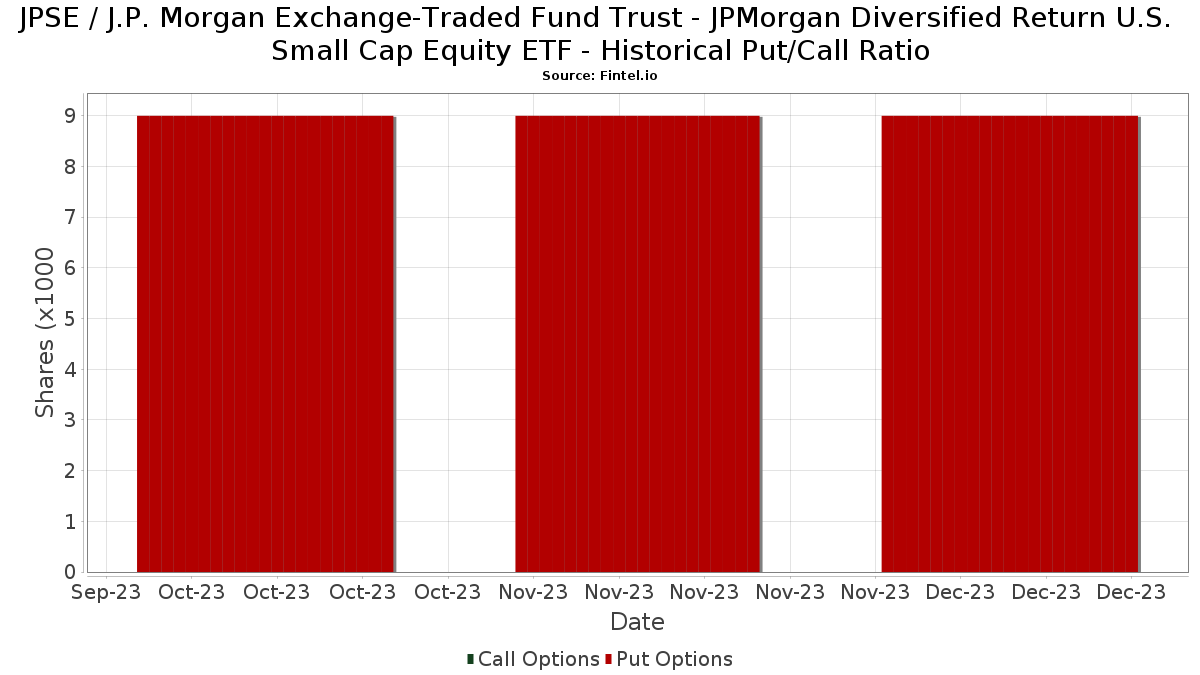
Institutionel Put/Call-forhold
Ud over at indberette standardaktie- og gældsudstedelser skal institutter med mere end 100 mill. aktiver under forvaltning også oplyse deres put- og call-optionsbeholdninger. Da salgsoptioner generelt indikerer negativ stemning, og købsoptioner indikerer positiv stemning, kan vi få en fornemmelse af den overordnede institutionelle stemning ved at plotte forholdet mellem put og kald. Diagrammet til højre viser det historiske put/call-forhold for dette instrument.
Brug af Put/Call Ratio som en indikator for investorernes stemning overvinder en af de vigtigste mangler ved at bruge totalt institutionelt ejerskab, som er, at en betydelig mængde af aktiver under forvaltning investeres passivt for at spore indekser. Passivt forvaltede fonde køber typisk ikke optioner, så indikatoren for put/call-forholdet følger mere nøje følelsen af aktivt forvaltede fonde.
13F og NPORT arkivering
Detaljer om 13F-arkivering er gratis. Detaljer om NP-ansøgninger kræver et premium-medlemskab. Grønne rækker angiver nye positioner. Røde rækker angiver lukkede positioner. Klik på linket ikon for at se den fulde transaktionshistorik.
Opgrader
for at låse premium-data op og eksportere til Excel ![]() .
.
| Fil dato | Kilde | Investor | Type | Gennemsnitlig pris (Øst) |
Aktier | Δ Aktier (%) |
Rapporteret Værdi ($1000) |
Δ Værdi (%) |
Port Alloc (%) |
|
|---|---|---|---|---|---|---|---|---|---|---|
| 2025-05-09 | 13F | GeoWealth Management, LLC | 0 | -100,00 | 0 | -100,00 | ||||
| 2025-07-25 | 13F | Cwm, Llc | 1.234 | -41,46 | 0 | |||||
| 2025-07-29 | 13F | Stephens Inc /ar/ | 8.112 | 0,38 | 369 | 4,55 | ||||
| 2025-08-14 | 13F | Gerber Kawasaki Wealth & Investment Management | 188.962 | 1,78 | 8.596 | 6,22 | ||||
| 2025-07-08 | 13F | Gallacher Capital Management LLC | 15.973 | -2,01 | 727 | 2,25 | ||||
| 2025-08-01 | 13F | Rossby Financial, LCC | 96 | 17,07 | 4 | 33,33 | ||||
| 2025-08-06 | 13F | AE Wealth Management LLC | 232 | 0,00 | 11 | 0,00 | ||||
| 2025-08-12 | 13F | Jpmorgan Chase & Co | 27.229 | -4,31 | 1.239 | -0,16 | ||||
| 2025-08-12 | 13F | J.w. Cole Advisors, Inc. | 16.188 | 736 | ||||||
| 2025-08-06 | 13F | Centerpoint Advisory Group | 5.866 | -10,44 | 267 | -6,67 | ||||
| 2025-07-29 | NP | EBI - Longview Advantage ETF | 0 | -100,00 | 0 | -100,00 | ||||
| 2025-07-22 | 13F | Appleton Partners Inc/ma | 182.143 | -0,08 | 8 | 14,29 | ||||
| 2025-07-22 | 13F | DAVENPORT & Co LLC | 108.166 | 7,51 | 4.920 | 12,20 | ||||
| 2025-08-08 | 13F | Intrua Financial, LLC | 5.498 | 0,00 | 250 | 4,60 | ||||
| 2025-08-13 | 13F | Northwestern Mutual Wealth Management Co | 190.340 | 16,22 | 8.658 | 21,29 | ||||
| 2025-08-14 | 13F | Integrated Wealth Concepts LLC | 61.460 | -4,89 | 2.796 | -0,75 | ||||
| 2025-08-07 | 13F | Everhart Financial Group, Inc. | 0 | -100,00 | 0 | |||||
| 2025-07-21 | 13F | Ameriflex Group, Inc. | 941 | 43 | ||||||
| 2025-07-25 | 13F | Atria Wealth Solutions, Inc. | 5.133 | -77,08 | 233 | -76,13 | ||||
| 2025-07-30 | 13F | Paul Damon & Associates, Inc. | 50.328 | 5,02 | 2.289 | 9,57 | ||||
| 2025-08-12 | 13F | O'shaughnessy Asset Management, Llc | 1 | 0,00 | 0 | |||||
| 2025-07-24 | 13F | Us Bancorp \de\ | 1.175 | 0,00 | 53 | 3,92 | ||||
| 2025-08-14 | 13F | Fmr Llc | 1.046 | -19,72 | 48 | -16,07 | ||||
| 2025-07-14 | 13F | AdvisorNet Financial, Inc | 65 | 0,00 | 3 | 0,00 | ||||
| 2025-07-30 | 13F | Nottingham Advisors, Inc. | 11.034 | 0,00 | 502 | 4,38 | ||||
| 2025-07-17 | 13F | LexAurum Advisors, LLC | 45.552 | 66,22 | 2.072 | 73,53 | ||||
| 2025-08-14 | 13F | Keystone Financial Services, LLC | 150.714 | 5,27 | 6.856 | 9,86 | ||||
| 2025-08-14 | 13F | UBS Group AG | 436 | 0,00 | 20 | 0,00 | ||||
| 2025-08-15 | 13F | Morgan Stanley | 263.455 | -6,33 | 11.984 | -2,25 | ||||
| 2025-07-30 | 13F/A | KPP Advisory Services LLC | 8.961 | -3,86 | 408 | 0,25 | ||||
| 2025-05-16 | 13F | Coppell Advisory Solutions LLC | 0 | -100,00 | 0 | |||||
| 2025-08-12 | 13F | Proequities, Inc. | 0 | 0 | ||||||
| 2025-07-29 | 13F | Goldstein Advisors, LLC | 242.683 | 0,02 | 11.039 | 4,38 | ||||
| 2025-08-14 | 13F | Mariner, LLC | 6.286 | 7,56 | 286 | 12,20 | ||||
| 2025-07-29 | 13F | Interactive Financial Advisors | 16.507 | -0,93 | 751 | 3,31 | ||||
| 2025-08-18 | 13F | N.E.W. Advisory Services LLC | 349 | -96,51 | 16 | -96,55 | ||||
| 2025-07-16 | 13F | Signaturefd, Llc | 130 | 0,00 | 6 | 0,00 | ||||
| 2025-08-14 | 13F | LWM Advisory Services, LLC | 21.972 | 0,45 | 1.000 | 4,83 | ||||
| 2025-04-22 | 13F | Synergy Financial Management, LLC | 0 | -100,00 | 0 | |||||
| 2025-08-08 | 13F | Kingsview Wealth Management, LLC | 104.901 | 22,12 | 4.772 | 27,43 | ||||
| 2025-07-28 | 13F | Sagespring Wealth Partners, Llc | 5.444 | -1,27 | 248 | 2,92 | ||||
| 2025-08-08 | 13F | Beck Bode, LLC | 5.103 | -31,37 | 232 | -28,40 | ||||
| 2025-07-17 | 13F | Fifth Third Securities, Inc. | 33.819 | 13,71 | 1.538 | 18,67 | ||||
| 2025-08-14 | 13F | Ameriprise Financial Inc | 130.614 | 3,86 | 5.945 | 8,60 | ||||
| 2025-08-11 | 13F | Aptus Capital Advisors, LLC | 417 | 0,24 | 19 | 0,00 | ||||
| 2025-08-14 | 13F | Wells Fargo & Company/mn | 20 | 1 | ||||||
| 2025-08-04 | 13F | Pinnacle Associates Ltd | 8.859 | 0,00 | 403 | 4,15 | ||||
| 2025-08-08 | 13F | Thoroughbred Financial Services, Llc | 6.263 | -7,41 | 0 | |||||
| 2025-08-11 | 13F | Principal Securities, Inc. | 103 | -63,48 | 5 | -69,23 | ||||
| 2025-08-14 | 13F | Mercer Global Advisors Inc /adv | 14.241 | -16,13 | 648 | -12,57 | ||||
| 2025-08-14 | 13F | Comerica Bank | 0 | -100,00 | 0 | |||||
| 2025-08-14 | 13F | Bank Of America Corp /de/ | 571.912 | 1,37 | 26.015 | 5,78 | ||||
| 2025-08-12 | 13F | LPL Financial LLC | 832.355 | 28,86 | 37.862 | 34,47 | ||||
| 2025-09-04 | 13F/A | Advisor Group Holdings, Inc. | 53.301 | 4,25 | 2.424 | 8,80 | ||||
| 2025-08-14 | 13F | GWM Advisors LLC | 22.601 | -2,83 | 1.028 | 1,48 | ||||
| 2025-08-01 | 13F | Envestnet Asset Management Inc | 121.567 | -4,24 | 5.530 | -0,07 | ||||
| 2025-08-14 | 13F | Susquehanna International Group, Llp | 34.391 | -10,49 | 1.564 | -6,57 | ||||
| 2025-08-12 | 13F | Steward Partners Investment Advisory, Llc | 201 | 336,96 | 9 | 350,00 | ||||
| 2025-08-08 | 13F | Emerald Investment Partners, Llc | 32 | 0,00 | 1 | 0,00 | ||||
| 2025-07-17 | 13F | KWB Wealth | 26.623 | 3,76 | 1.160 | -3,41 | ||||
| 2025-08-08 | 13F | Cetera Investment Advisers | 51.050 | 7,75 | 2.322 | 12,45 | ||||
| 2025-08-15 | 13F | Kestra Advisory Services, LLC | 9.926 | -46,05 | 452 | -43,77 | ||||
| 2025-05-15 | 13F | Two Sigma Investments, Lp | 0 | -100,00 | 0 | |||||
| 2025-08-12 | 13F | Wayfinding Financial, LLC | 0 | -100,00 | 0 | |||||
| 2025-08-14 | 13F | Mml Investors Services, Llc | 36.179 | 10,68 | 2 | 0,00 | ||||
| 2025-07-25 | 13F | Hazlett, Burt & Watson, Inc. | 11 | 0,00 | 0 | |||||
| 2025-08-12 | 13F | Financial Advocates Investment Management | 95.024 | -32,42 | 4.322 | -29,48 | ||||
| 2025-08-12 | 13F | Global Retirement Partners, LLC | 0 | -100,00 | 0 | |||||
| 2025-08-11 | 13F | Bell Investment Advisors, Inc | 253 | -31,25 | 12 | -31,25 | ||||
| 2025-07-17 | 13F | Beacon Capital Management, LLC | 23 | 1 | ||||||
| 2025-08-13 | 13F | Capital Advisors Wealth Management, LLC | 90.974 | -79,74 | 4.138 | -78,86 | ||||
| 2025-07-29 | 13F | Stratos Wealth Partners, LTD. | 8.876 | -40,25 | 404 | -37,71 | ||||
| 2025-08-06 | 13F | ZEGA Investments, LLC | 0 | -100,00 | 0 | |||||
| 2025-08-07 | 13F | Pinnacle Wealth Management Advisory Group, LLC | 8.859 | 0,00 | 403 | 4,15 | ||||
| 2025-08-13 | 13F | Jones Financial Companies Lllp | 82.138 | 9,13 | 3.736 | 14,22 | ||||
| 2025-08-14 | 13F | Stifel Financial Corp | 223.080 | 4,31 | 10.147 | 8,85 | ||||
| 2025-08-07 | 13F | Kestra Private Wealth Services, Llc | 6.781 | -4,48 | 308 | -0,32 | ||||
| 2025-07-31 | 13F | Oak Harbor Wealth Partners, Llc | 19.370 | 57,85 | 881 | 64,98 | ||||
| 2025-08-11 | 13F | HighTower Advisors, LLC | 9.737 | 99,82 | 443 | 108,49 | ||||
| 2025-07-31 | 13F | Hartford Financial Management Inc. | 315.333 | 97,68 | 14.344 | 106,29 | ||||
| 2025-08-05 | 13F | Bank Of Montreal /can/ | 111 | 5 | ||||||
| 2025-08-06 | 13F | Prospera Financial Services Inc | 7.441 | -4,07 | 339 | 0,00 | ||||
| 2025-07-11 | 13F | Farther Finance Advisors, LLC | 3 | -98,45 | 0 | -100,00 | ||||
| 2025-07-10 | 13F | Wealth Enhancement Advisory Services, Llc | 6.202 | -2,96 | 291 | 4,68 | ||||
| 2025-04-22 | 13F | Hill Island Financial Llc | 0 | -100,00 | 0 | |||||
| 2025-08-12 | 13F | Tocqueville Asset Management L.p. | 156.068 | -0,91 | 7.099 | 3,41 | ||||
| 2025-08-11 | 13F | Nations Financial Group Inc, /ia/ /adv | 5.787 | -17,16 | 263 | -13,49 | ||||
| 2025-07-31 | 13F | Cambridge Investment Research Advisors, Inc. | 23.663 | -9,59 | 1 | 0,00 | ||||
| 2025-07-24 | 13F | IFP Advisors, Inc | 413 | -2,13 | 19 | 0,00 | ||||
| 2025-08-14 | 13F | Stonehaven Wealth & Tax Solutions, Llc | 41.146 | 5,02 | 1.872 | 9,61 | ||||
| 2025-07-18 | 13F | First Pacific Financial | 73.466 | 1,89 | 3.342 | 6,30 | ||||
| 2025-08-06 | 13F | Ipsen Advisor Group LLC | 111.067 | 3,85 | 5.052 | 8,39 | ||||
| 2025-08-04 | 13F | Hantz Financial Services, Inc. | 3 | 0,00 | 0 | |||||
| 2025-07-11 | 13F | Sprinkle Financial Consultants LLC | 126.612 | -4,49 | 5.760 | -0,33 | ||||
| 2025-07-08 | 13F | Choice Wealth Advisors, LLC | 0 | -100,00 | 0 | |||||
| 2025-08-01 | 13F | Mendel Money Management | 9.961 | 5,18 | 453 | 9,95 | ||||
| 2025-08-14 | 13F | Redwood Financial Network Corp | 14.131 | -2,79 | 643 | 1,42 | ||||
| 2025-08-01 | 13F | Schmidt P J Investment Management Inc | 23.697 | 3,94 | 1.078 | 8,46 | ||||
| 2025-07-17 | 13F | Albion Financial Group /ut | 1.573 | -47,64 | 72 | -45,38 | ||||
| 2025-08-01 | 13F | Koss-Olinger Consulting, LLC | 1.248.672 | -1,53 | 56.800 | 2,76 | ||||
| 2025-08-14 | 13F | Financial Engines Advisors L.L.C. | 26.460 | 1.204 | ||||||
| 2025-04-16 | 13F | Salem Investment Counselors Inc | 0 | -100,00 | 0 | |||||
| 2025-07-07 | 13F | Teamwork Financial Advisors, LLC | 5.253 | -74,36 | 239 | -73,35 | ||||
| 2025-08-06 | 13F | Golden State Wealth Management, LLC | 0 | -100,00 | 0 | |||||
| 2025-05-02 | 13F | Transcendent Capital Group LLC | 0 | -100,00 | 0 | |||||
| 2025-08-06 | 13F | Commonwealth Equity Services, Llc | 70.919 | 35,07 | 3 | 50,00 | ||||
| 2025-08-14 | 13F | Raymond James Financial Inc | 796.316 | -39,76 | 36.223 | -37,14 | ||||
| 2025-08-12 | 13F | Cornerstone Wealth Management, LLC | 28.835 | 6,43 | 1.312 | 11,01 | ||||
| 2025-08-14 | 13F | Citadel Advisors Llc | 11.810 | -70,16 | 537 | -68,87 | ||||
| 2025-08-04 | 13F | Creative Financial Designs Inc /adv | 54 | 0,00 | 2 | 0,00 | ||||
| 2025-08-08 | 13F | Gts Securities Llc | 18.972 | 0,00 | 863 | 4,36 | ||||
| 2025-04-25 | 13F | Smallwood Wealth Investment Management, LLC | 226 | 10 | ||||||
| 2025-08-05 | 13F | Aviance Capital Partners, LLC | 7.113 | 0,00 | 324 | 4,19 | ||||
| 2025-08-14 | 13F | Colony Group, LLC | 7.635 | -10,80 | 347 | -6,97 | ||||
| 2025-08-14 | 13F | Royal Bank Of Canada | 316.645 | -31,34 | 14.404 | -28,35 | ||||
| 2025-07-29 | 13F | Private Trust Co Na | 1.101 | 0,00 | 50 | 6,38 |