Grundlæggende statistik
| Institutionelle aktier (lange) | 5.327.201 - 17,82% (ex 13D/G) - change of -0,35MM shares -6,15% MRQ |
| Institutionel værdi (lang) | $ 27.314 USD ($1000) |
Institutionelt ejerskab og aktionærer
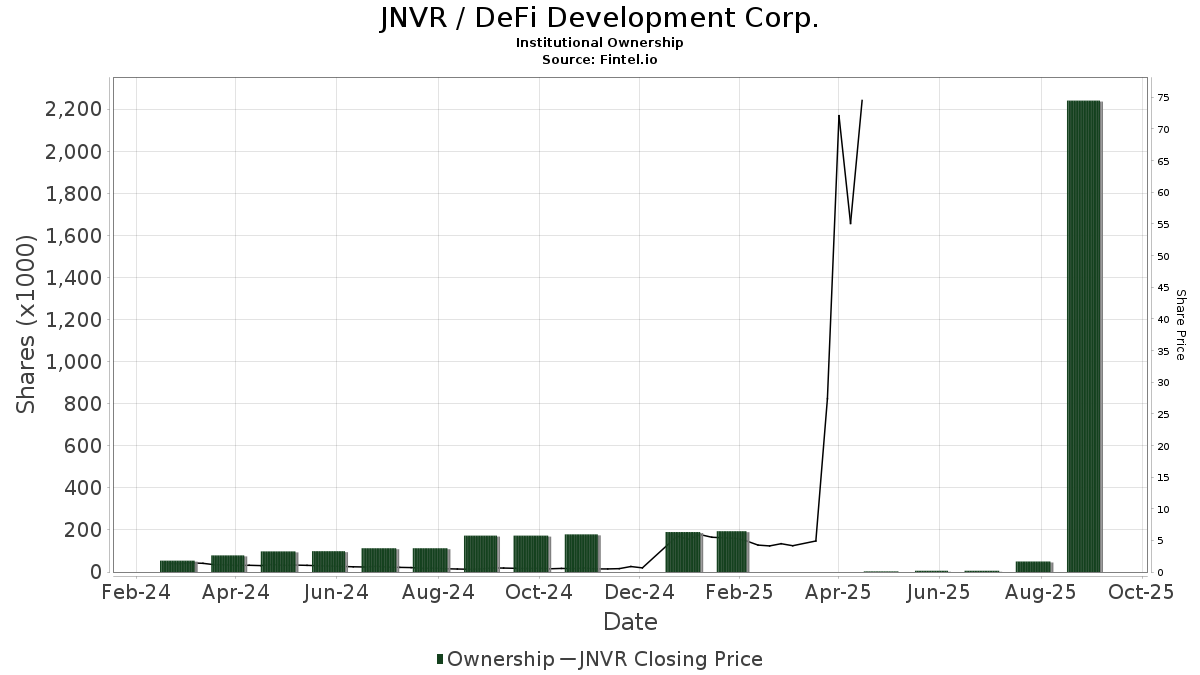
DeFi Development Corp. (US:JNVR) har 60 institutionelle ejere og aktionærer, der har indsendt 13D/G- eller 13F-formularer til Securities Exchange Commission (SEC). Disse institutioner har i alt 5,327,201 aktier. Største aktionærer omfatter Vanguard Group Inc, Alyeska Investment Group, L.P., Group One Trading, L.p., Susquehanna International Group, Llp, Millennium Management Llc, Citadel Advisors Llc, Jane Street Group, Llc, BlackRock, Inc., Susquehanna International Group, Llp, and Geode Capital Management, Llc .
DeFi Development Corp. (NasdaqCM:JNVR) institutionel ejerskabsstruktur viser aktuelle positioner i virksomheden efter institutioner og fonde, samt seneste ændringer i positionsstørrelse. Større aktionærer kan omfatte individuelle investorer, investeringsforeninger, hedgefonde eller institutioner. Skema 13D angiver, at investoren besidder (eller besidder) mere end 5 % af virksomheden og har til hensigt (eller har til hensigt at) aktivt at forfølge en ændring i forretningsstrategi. Skema 13G indikerer en passiv investering på over 5%.
The share price as of May 2, 2025 is 79,31 / share. Previously, on March 12, 2025, the share price was 4,47 / share. This represents an increase of 1.674,27% over that period.
Fondens stemningsscore
Fund Sentiment Score (fka Ownership Accumulation Score) finder de aktier, der bliver mest købt af fonde. Det er resultatet af en sofistikeret, multi-faktor kvantitativ model, der identificerer virksomheder med de højeste niveauer af institutionel akkumulering. Scoringsmodellen bruger en kombination af den samlede stigning i oplyste ejere, ændringerne i porteføljeallokeringer i disse ejere og andre målinger. Tallet går fra 0 til 100, hvor højere tal indikerer et højere niveau af akkumulering for sine jævnaldrende, og 50 er gennemsnittet.
Opdateringsfrekvens: Dagligt
Se Ownership Explorer, som giver en liste over højest rangerende virksomheder.
AI+ Ask Fintel’s AI assistant about DeFi Development Corp..
Select a question to share a public post with an AI-crafted answer.
Thinking of good questions…
Institutionel Put/Call-forhold
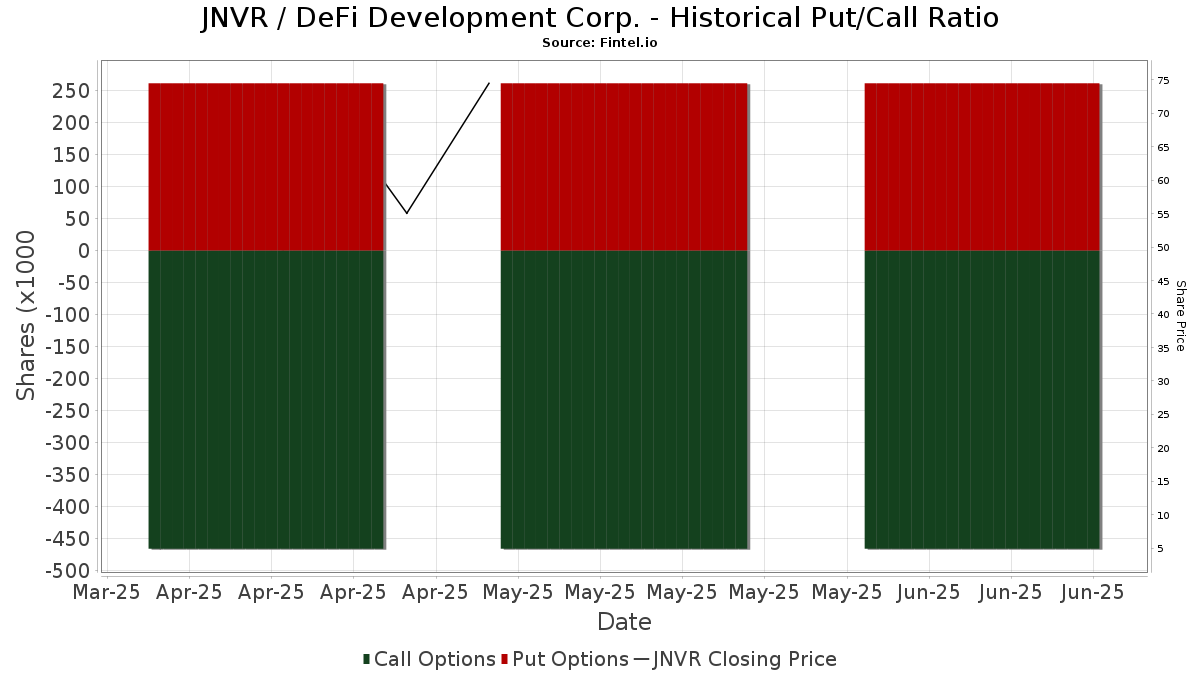
Ud over at indberette standardaktie- og gældsudstedelser skal institutter med mere end 100 mill. aktiver under forvaltning også oplyse deres put- og call-optionsbeholdninger. Da salgsoptioner generelt indikerer negativ stemning, og købsoptioner indikerer positiv stemning, kan vi få en fornemmelse af den overordnede institutionelle stemning ved at plotte forholdet mellem put og kald. Diagrammet til højre viser det historiske put/call-forhold for dette instrument.
Brug af Put/Call Ratio som en indikator for investorernes stemning overvinder en af de vigtigste mangler ved at bruge totalt institutionelt ejerskab, som er, at en betydelig mængde af aktiver under forvaltning investeres passivt for at spore indekser. Passivt forvaltede fonde køber typisk ikke optioner, så indikatoren for put/call-forholdet følger mere nøje følelsen af aktivt forvaltede fonde.
13F og NPORT arkivering
Detaljer om 13F-arkivering er gratis. Detaljer om NP-ansøgninger kræver et premium-medlemskab. Grønne rækker angiver nye positioner. Røde rækker angiver lukkede positioner. Klik på linket ikon for at se den fulde transaktionshistorik.
Opgrader
for at låse premium-data op og eksportere til Excel ![]() .
.
| Fil dato | Kilde | Investor | Type | Gennemsnitlig pris (Øst) |
Aktier | Δ Aktier (%) |
Rapporteret Værdi ($1000) |
Δ Værdi (%) |
Port Alloc (%) |
|
|---|---|---|---|---|---|---|---|---|---|---|
| 2026-02-03 | 13F | Strengthening Families & Communities, LLC | 50 | 0 | ||||||
| 2026-02-18 | 13F | GWM Advisors LLC | 51.408 | 64,64 | 260 | -45,82 | ||||
| 2026-01-23 | 13F | Farther Finance Advisors, LLC | 6.322 | 173,21 | 32 | -11,43 | ||||
| 2026-02-17 | 13F | Polar Asset Management Partners Inc. | 0 | -100,00 | 0 | -100,00 | ||||
| 2026-02-10 | 13F | Bnp Paribas Arbitrage, Sa | 1.733 | 9 | ||||||
| 2026-02-13 | 13F | Verition Fund Management LLC | Put | 36.300 | 0,00 | 183 | -67,03 | |||
| 2026-02-13 | 13F | Verition Fund Management LLC | 22.500 | 114 | ||||||
| 2026-02-13 | 13F | Citigroup Inc | 17.883 | 968,28 | 90 | 260,00 | ||||
| 2026-02-10 | 13F | Belvedere Trading LLC | 0 | -100,00 | 0 | |||||
| 2025-11-14 | 13F | Hunting Hill Global Capital, LLC | Put | 0 | -100,00 | 0 | -100,00 | |||
| 2026-02-13 | 13F | Citigroup Inc | Put | 0 | -100,00 | 0 | -100,00 | |||
| 2026-02-10 | 13F | Goldman Sachs Group Inc | Put | 0 | -100,00 | 0 | ||||
| 2026-01-13 | 13F | CoreCap Advisors, LLC | 1.000 | 5 | ||||||
| 2026-02-17 | 13F | Altshuler Shaham Ltd | Call | 40 | 0,00 | 0 | -100,00 | |||
| 2026-02-17 | 13F | Bank Of America Corp /de/ | 10.638 | 145,40 | 54 | -19,70 | ||||
| 2026-02-17 | 13F | Boothbay Fund Management, Llc | Put | 0 | -100,00 | 0 | ||||
| 2026-01-29 | 13F | Sanctuary Advisors, LLC | 10.662 | 54 | ||||||
| 2026-02-12 | 13F | Federation des caisses Desjardins du Quebec | 4.000 | 20 | ||||||
| 2026-02-13 | 13F | State Street Corp | 80.647 | 26,91 | 407 | -58,13 | ||||
| 2025-11-14 | 13F | Raymond James Financial Inc | 0 | -100,00 | 0 | |||||
| 2025-11-14 | 13F | National Bank Of Canada /fi/ | 0 | -100,00 | 0 | |||||
| 2026-01-30 | 13F | Bogart Wealth, LLC | 0 | -100,00 | 0 | |||||
| 2026-02-17 | 13F | XTX Topco Ltd | 37.959 | 192 | ||||||
| 2026-02-17 | 13F | Weiss Asset Management LP | 0 | -100,00 | 0 | -100,00 | ||||
| 2026-02-17 | 13F | Palisade Capital Management Llc/nj | 0 | -100,00 | 0 | |||||
| 2026-01-26 | 13F | Cwm, Llc | 32 | 0,00 | 0 | |||||
| 2026-02-26 | 13F/A | Aristides Capital LLC | 37.100 | 187 | ||||||
| 2026-01-21 | 13F | Signature Resources Capital Management, LLC | 10 | 0 | ||||||
| 2026-02-17 | 13F | Capstone Investment Advisors, Llc | 15.144 | 76 | ||||||
| 2026-02-10 | 13F | Goldman Sachs Group Inc | 95.878 | -49,04 | 484 | -83,19 | ||||
| 2026-02-17 | 13F | Pantera Capital Partners LP | 0 | -100,00 | 0 | |||||
| 2026-02-17 | 13F | Murchinson Ltd. | Put | 0 | -100,00 | 0 | ||||
| 2026-02-13 | 13F | Squarepoint Ops LLC | 11.381 | 57 | ||||||
| 2026-02-17 | 13F | RK Capital Management, LLC/FL | Put | 0 | -100,00 | 0 | ||||
| 2026-02-17 | 13F | Price T Rowe Associates Inc /md/ | 13.900 | 0 | ||||||
| 2026-02-06 | 13F | Leonteq Securities AG | 2.249 | -98,17 | 11 | -99,42 | ||||
| 2026-02-17 | 13F | Heights Capital Management, Inc | Put | 0 | -100,00 | 0 | ||||
| 2026-02-17 | 13F | Northern Trust Corp | 45.525 | 51,89 | 230 | -50,00 | ||||
| 2026-02-13 | 13F | Verition Fund Management LLC | Call | 0 | -100,00 | 0 | -100,00 | |||
| 2025-11-12 | 13F | Simplex Trading, Llc | 0 | -100,00 | 0 | |||||
| 2025-12-15 | 13F | FNY Investment Advisers, LLC | Put | 0 | -100,00 | 0 | ||||
| 2026-02-12 | 13F | Jane Street Group, Llc | 136.217 | 688 | ||||||
| 2026-02-13 | 13F | DeepCurrents Investment Group LLC | 117.200 | 1.065,01 | 592 | 283,77 | ||||
| 2025-11-14 | 13F | Larson Financial Group LLC | 0 | -100,00 | 0 | |||||
| 2026-02-12 | 13F | Jane Street Group, Llc | Put | 123.200 | -16,19 | 622 | -72,36 | |||
| 2026-02-12 | 13F | Jane Street Group, Llc | Call | 365.600 | -30,51 | 1.846 | -77,08 | |||
| 2026-02-17 | 13F | Millennium Management Llc | 407.794 | 215,00 | 2.059 | 3,88 | ||||
| 2026-01-12 | 13F | Lauer Wealth, LLC | 60.600 | 0,83 | 419 | -53,60 | ||||
| 2026-02-13 | 13F | Quarry LP | Put | 0 | -100,00 | 0 | ||||
| 2026-02-17 | 13F | RK Capital Management, LLC/FL | 124.882 | 631 | ||||||
| 2026-02-11 | 13F | Simplex Trading, Llc | Call | 118.800 | -56,96 | 134 | 3.225,00 | |||
| 2025-10-21 | 13F | Global Retirement Partners, LLC | 0 | -100,00 | 0 | |||||
| 2026-02-17 | 13F | Crawford Fund Management, LLC | Call | 78.000 | 394 | |||||
| 2026-02-17 | 13F | Citadel Advisors Llc | 0 | -100,00 | 0 | -100,00 | ||||
| 2026-02-17 | 13F | Citadel Advisors Llc | Call | 368.200 | 32,02 | 1.859 | -56,45 | |||
| 2026-02-17 | 13F | Citadel Advisors Llc | Put | 268.800 | -3,45 | 1.357 | -68,16 | |||
| 2025-09-26 | NP | USMIX - Extended Market Index Fund | 326 | 5 | ||||||
| 2026-02-17 | 13F | Engineers Gate Manager LP | 73.150 | 369 | ||||||
| 2026-02-13 | 13F | Morgan Stanley | 20.416 | -33,44 | 103 | -78,04 | ||||
| 2026-02-17 | 13F | Heights Capital Management, Inc | 0 | -100,00 | 0 | |||||
| 2026-02-13 | 13F | Wells Fargo & Company/mn | 41.752 | 34,25 | 211 | -55,88 | ||||
| 2026-02-13 | 13F | Centiva Capital, LP | 0 | -100,00 | 0 | |||||
| 2026-02-10 | 13F | State of Wyoming | 39.014 | 197 | ||||||
| 2026-02-12 | 13F | BlackRock, Inc. | 342.913 | 20,83 | 1.732 | -60,15 | ||||
| 2026-01-30 | 13F | Us Bancorp \de\ | 3.600 | 18 | ||||||
| 2026-02-17 | 13F | Susquehanna International Group, Llp | Call | 409.300 | -41,14 | 2.067 | -80,59 | |||
| 2026-02-10 | 13F | Belvedere Trading LLC | Call | 107.100 | 279,79 | 556 | 28,77 | |||
| 2026-02-17 | 13F | Susquehanna International Group, Llp | 103.582 | -43,02 | 523 | -81,21 | ||||
| 2026-02-17 | 13F | Susquehanna International Group, Llp | Put | 300.600 | -46,28 | 1.518 | -82,28 | |||
| 2026-02-09 | 13F | Advent Capital Management /de/ | 0 | -100,00 | 0 | |||||
| 2026-02-10 | 13F | Belvedere Trading LLC | Put | 2.600 | -80,88 | 14 | -93,75 | |||
| 2026-02-12 | 13F | Rossby Financial, LCC | 0 | -100,00 | 0 | |||||
| 2026-02-11 | 13F | LPL Financial LLC | 14.880 | 75 | ||||||
| 2026-02-17 | 13F | Shay Capital LLC | 79.635 | 402 | ||||||
| 2026-01-29 | 13F | UBS Group AG | 181.804 | 301,49 | 918 | 32,47 | ||||
| 2025-11-14 | 13F | Royal Bank Of Canada | 0 | -100,00 | 0 | -100,00 | ||||
| 2026-01-09 | 13F | SG Americas Securities, LLC | 0 | -100,00 | 0 | |||||
| 2026-02-17 | 13F | Quadrature Capital Ltd | 62.901 | 318 | ||||||
| 2026-02-13 | 13F | OMERS ADMINISTRATION Corp | 47.600 | 240 | ||||||
| 2026-02-17 | 13F | Jones Financial Companies Lllp | 1.642 | 1.056,34 | 8 | 300,00 | ||||
| 2025-11-14 | 13F | Anatole Investment Management Ltd | 0 | -100,00 | 0 | -100,00 | ||||
| 2026-02-17 | 13F | Advisor Group Holdings, Inc. | 0 | -100,00 | 0 | |||||
| 2025-09-24 | NP | SWTSX - Schwab Total Stock Market Index Fund This fund is a listed as child fund of Charles Schwab Investment Management Inc and if that institution has disclosed ownership in this security, then these positions will not be double counted when calculating total shares and total value | 4.500 | 65 | ||||||
| 2026-02-17 | 13F | 683 Capital Management, LLC | 117.990 | 596 | ||||||
| 2025-11-14 | 13F | Wolverine Trading, Llc | 31.069 | 502 | ||||||
| 2025-11-14 | 13F | Wolverine Trading, Llc | Call | 65.800 | 1.064 | |||||
| 2025-11-14 | 13F | Wolverine Trading, Llc | Put | 54.300 | 878 | |||||
| 2026-02-17 | 13F | Jain Global LLC | 221.271 | 1.117 | ||||||
| 2026-01-29 | 13F | IMC-Chicago, LLC | Call | 46.900 | 237 | |||||
| 2026-02-17 | 13F | Jain Global LLC | Put | 100.000 | 0,00 | 505 | -67,02 | |||
| 2026-01-29 | 13F | Vanguard Group Inc | 1.261.601 | 71,54 | 6.371 | -43,41 | ||||
| 2026-02-17 | 13F | Qube Research & Technologies Ltd | 26.197 | 132 | ||||||
| 2026-02-13 | 13F | Alyeska Investment Group, L.P. | 518.522 | -16,34 | 2.619 | -66,55 | ||||
| 2026-02-09 | 13F | Geode Capital Management, Llc | 288.054 | 65,61 | 1.455 | -45,36 | ||||
| 2026-02-12 | 13F | Hollencrest Capital Management | 0 | -100,00 | 0 | |||||
| 2026-02-13 | 13F | Barclays Plc | 21.911 | 221,84 | 111 | 5,77 | ||||
| 2026-02-11 | 13F | Group One Trading, L.p. | Call | 421.800 | -35,18 | 2.130 | -78,62 | |||
| 2026-02-11 | 13F | Group One Trading, L.p. | 203.113 | 1.026 | ||||||
| 2026-03-03 | 13F/A | Caitong International Asset Management Co., Ltd | 9.313 | 47 | ||||||
| 2026-02-17 | 13F | Captrust Financial Advisors | 11.297 | 7,11 | 57 | -64,60 | ||||
| 2026-02-17 | 13F | Two Sigma Investments, Lp | 285.800 | 1.443 | ||||||
| 2026-02-17 | 13F | Tower Research Capital LLC (TRC) | 634 | 48,48 | 3 | -50,00 |