Grundlæggende statistik
| Institutionelle ejere | 162 total, 162 long only, 0 short only, 0 long/short - change of 18,12% MRQ |
| Gennemsnitlig porteføljeallokering | 0.5724 % - change of -11,18% MRQ |
| Institutionelle aktier (lange) | 111.883.781 (ex 13D/G) - change of 6,25MM shares 5,91% MRQ |
| Institutionel værdi (lang) | $ 5.617.113 USD ($1000) |
Institutionelt ejerskab og aktionærer
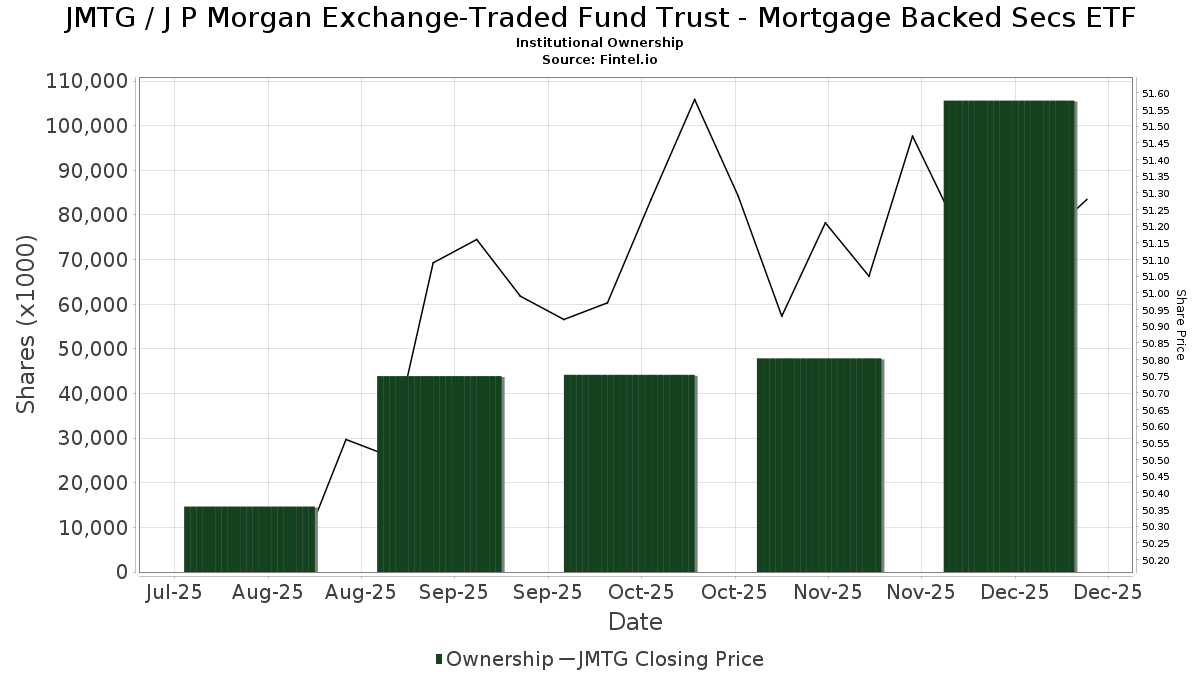
J P Morgan Exchange-Traded Fund Trust - Mortgage Backed Secs ETF (US:JMTG) har 162 institutionelle ejere og aktionærer, der har indsendt 13D/G- eller 13F-formularer til Securities Exchange Commission (SEC). Disse institutioner har i alt 111,883,781 aktier. Største aktionærer omfatter Jpmorgan Chase & Co, Bank Of America Corp /de/, NorthRock Partners, LLC, Morgan Stanley, Ameriprise Financial Inc, LPL Financial LLC, M&t Bank Corp, Wealth Enhancement Advisory Services, Llc, Bailard, Inc., and Acropolis Investment Management, LLC .
J P Morgan Exchange-Traded Fund Trust - Mortgage Backed Secs ETF (ARCA:JMTG) institutionel ejerskabsstruktur viser aktuelle positioner i virksomheden efter institutioner og fonde, samt seneste ændringer i positionsstørrelse. Større aktionærer kan omfatte individuelle investorer, investeringsforeninger, hedgefonde eller institutioner. Skema 13D angiver, at investoren besidder (eller besidder) mere end 5 % af virksomheden og har til hensigt (eller har til hensigt at) aktivt at forfølge en ændring i forretningsstrategi. Skema 13G indikerer en passiv investering på over 5%.
The share price as of April 2, 2026 is 50,91 / share. Previously, on June 30, 2025, the share price was 50,19 / share. This represents an increase of 1,43% over that period.
Fondens stemningsscore
Fund Sentiment Score (fka Ownership Accumulation Score) finder de aktier, der bliver mest købt af fonde. Det er resultatet af en sofistikeret, multi-faktor kvantitativ model, der identificerer virksomheder med de højeste niveauer af institutionel akkumulering. Scoringsmodellen bruger en kombination af den samlede stigning i oplyste ejere, ændringerne i porteføljeallokeringer i disse ejere og andre målinger. Tallet går fra 0 til 100, hvor højere tal indikerer et højere niveau af akkumulering for sine jævnaldrende, og 50 er gennemsnittet.
Opdateringsfrekvens: Dagligt
Se Ownership Explorer, som giver en liste over højest rangerende virksomheder.
AI+ Ask Fintel’s AI assistant about J P Morgan Exchange-Traded Fund Trust - Mortgage Backed Secs ETF.
Select a question to share a public post with an AI-crafted answer.
Thinking of good questions…
Institutionel Put/Call-forhold
Ud over at indberette standardaktie- og gældsudstedelser skal institutter med mere end 100 mill. aktiver under forvaltning også oplyse deres put- og call-optionsbeholdninger. Da salgsoptioner generelt indikerer negativ stemning, og købsoptioner indikerer positiv stemning, kan vi få en fornemmelse af den overordnede institutionelle stemning ved at plotte forholdet mellem put og kald. Diagrammet til højre viser det historiske put/call-forhold for dette instrument.
Brug af Put/Call Ratio som en indikator for investorernes stemning overvinder en af de vigtigste mangler ved at bruge totalt institutionelt ejerskab, som er, at en betydelig mængde af aktiver under forvaltning investeres passivt for at spore indekser. Passivt forvaltede fonde køber typisk ikke optioner, så indikatoren for put/call-forholdet følger mere nøje følelsen af aktivt forvaltede fonde.
13F og NPORT arkivering
Detaljer om 13F-arkivering er gratis. Detaljer om NP-ansøgninger kræver et premium-medlemskab. Grønne rækker angiver nye positioner. Røde rækker angiver lukkede positioner. Klik på linket ikon for at se den fulde transaktionshistorik.
Opgrader
for at låse premium-data op og eksportere til Excel ![]() .
.
| Fil dato | Kilde | Investor | Type | Gennemsnitlig pris (Øst) |
Aktier | Δ Aktier (%) |
Rapporteret Værdi ($1000) |
Δ Værdi (%) |
Port Alloc (%) |
|
|---|---|---|---|---|---|---|---|---|---|---|
| 2026-01-30 | 13F | Caldwell Securities, Inc | 39 | 0,00 | 2 | 0,00 | ||||
| 2026-01-23 | 13F | Galvin, Gaustad & Stein, LLC | 43.234 | 2.208 | ||||||
| 2026-02-03 | 13F | We Are One Seven, LLC | 4.007 | 0,00 | 205 | 0,00 | ||||
| 2026-01-16 | 13F | Abacus Planning Group, Inc. | 547.480 | -17,76 | 27.954 | -17,66 | ||||
| 2026-02-18 | 13F | Beacon Pointe Advisors, LLC | 24.367 | -11,54 | 1.244 | -11,40 | ||||
| 2026-02-13 | 13F | Citigroup Inc | 975 | 50 | ||||||
| 2026-02-02 | 13F | Truist Financial Corp | 37.798 | 4,17 | 1.930 | 4,27 | ||||
| 2026-02-06 | 13F | AAFCPAs Wealth Management, LLC | 12.926 | 0,73 | 660 | 0,76 | ||||
| 2026-02-06 | 13F | BlueStem Wealth Partners, LLC | 537.942 | 27.467 | ||||||
| 2025-11-04 | 13F | Guerra Advisors Inc | 2.137 | 109 | ||||||
| 2026-02-13 | 13F | Stifel Financial Corp | 247.165 | 4,51 | 12.620 | 4,62 | ||||
| 2026-02-10 | 13F | Savant Capital, LLC | 6.513 | -11,28 | 333 | -11,23 | ||||
| 2026-02-10 | 13F | ESL Trust Services, LLC | 46.238 | 6,80 | 2.361 | 6,93 | ||||
| 2026-01-26 | 13F | Cwm, Llc | 572 | 135,39 | 0 | |||||
| 2026-02-10 | 13F | Marshall & Sterling Wealth Advisors Inc. | 45 | -78,16 | 2 | -80,00 | ||||
| 2026-02-04 | 13F | Bailard, Inc. | 1.450.504 | 11,57 | 74.063 | 11,70 | ||||
| 2026-02-11 | 13F | Dorsey & Whitney Trust CO LLC | 28.416 | 8,52 | 1.451 | 8,61 | ||||
| 2026-02-17 | 13F | Bank Of America Corp /de/ | 14.596.537 | 1,50 | 745.299 | 1,62 | ||||
| 2026-01-28 | 13F | Walleye Partners, LLC | 9.231 | 471 | ||||||
| 2026-01-12 | 13F | Breakthru Advisory Services, Llc | 90.259 | -7,32 | 4.609 | -7,23 | ||||
| 2026-02-19 | 13F | CI Private Wealth, LLC | 6.710 | 344 | ||||||
| 2026-02-06 | 13F | Copia Wealth Management | 156 | 8 | ||||||
| 2026-02-17 | 13F | Equitable Holdings, Inc. | 139.669 | 35,14 | 7.131 | 35,31 | ||||
| 2026-01-12 | 13F | CVA Family Office, LLC | 0 | -100,00 | 0 | |||||
| 2026-01-21 | 13F | Country Trust Bank | 290 | 15 | ||||||
| 2026-02-12 | 13F | Quadrant Capital Group Llc | 3.147 | 161 | ||||||
| 2026-02-17 | 13F | Advisory Services Network, LLC | 0 | -100,00 | 0 | |||||
| 2026-02-12 | 13F | Commonwealth Equity Services, Llc | 88.305 | -0,40 | 4.509 | 112.600,00 | ||||
| 2026-02-05 | 13F | Cornerstone Wealth Management, LLC | 84.610 | 5,54 | 4.320 | 5,68 | ||||
| 2026-02-11 | 13F | Jpmorgan Chase & Co | 40.513.319 | 8,10 | 2.068.610 | 8,23 | ||||
| 2026-02-12 | 13F | Brueske Advisory Services, LLC | 0 | -100,00 | 0 | |||||
| 2026-01-20 | 13F | Stratos Wealth Partners, LTD. | 4.625 | -7,80 | 236 | -7,45 | ||||
| 2026-02-06 | 13F | Envestnet Portfolio Solutions, Inc. | 81.212 | 4.147 | ||||||
| 2026-02-09 | 13F | TrustBank | 251.592 | 12.846 | ||||||
| 2026-02-20 | 13F | Kovitz Investment Group Partners, LLC | 0 | -100,00 | 0 | |||||
| 2026-01-22 | 13F | Yarger Wealth Strategies, Llc | 25.798 | -13,48 | 1.317 | -13,36 | ||||
| 2026-02-17 | 13F | RMB Capital Management, LLC | 504.860 | 2,83 | 25.869 | 3,31 | ||||
| 2026-02-04 | 13F | Pensionmark Financial Group, Llc | 4.736 | -29,59 | 240 | -30,03 | ||||
| 2026-02-13 | 13F | Hudson Portfolio Management LLC | 10.715 | 547 | ||||||
| 2026-01-26 | 13F | AE Wealth Management LLC | 375 | -11,97 | 19 | -9,52 | ||||
| 2026-02-11 | 13F | Vise Technologies, Inc. | 16.206 | 827 | ||||||
| 2026-02-13 | 13F | Morgan Stanley | 6.521.316 | 7,21 | 332.978 | 7,33 | ||||
| 2026-01-27 | 13F | PFG Advisors | 21.287 | -12,33 | 1.087 | -12,28 | ||||
| 2025-11-06 | 13F | Blume Capital Management, Inc. | 0 | -100,00 | 0 | |||||
| 2026-02-17 | 13F | Cetera Investment Advisers | 116.747 | 28,85 | 5.961 | 29,03 | ||||
| 2026-02-12 | 13F | Rossby Financial, LCC | 14 | 1 | ||||||
| 2026-02-17 | 13F | Warren Averett Asset Management, LLC | 1.443 | 74 | ||||||
| 2026-02-05 | 13F | 1620 Investment Advisors, Inc. | 22 | 0,00 | 1 | 0,00 | ||||
| 2026-02-10 | 13F | Evolution Wealth Management Inc. | 992 | 0,00 | 51 | 0,00 | ||||
| 2026-02-17 | 13F | First Commonwealth Financial Corp /pa/ | 6.438 | 0,00 | 329 | 0,00 | ||||
| 2026-01-23 | 13F | Rsm Us Wealth Management Llc | 49.394 | -0,38 | 2.535 | 0,24 | ||||
| 2026-02-14 | 13F | Rockefeller Capital Management L.P. | 255 | -84,98 | 13 | -84,88 | ||||
| 2026-02-17 | 13F | Royal Bank Of Canada | 8.833 | -11,94 | 451 | -11,91 | ||||
| 2026-01-07 | 13F | Massmutual Trust Co Fsb/adv | 8.534 | 436 | ||||||
| 2026-02-04 | 13F | Midwest Trust Co | 9.273 | -20,00 | 473 | -19,97 | ||||
| 2026-01-12 | 13F | Bill Few Associates, Inc. | 758.534 | 2,42 | 38.731 | 2,54 | ||||
| 2026-02-12 | 13F | Steward Partners Investment Advisory, Llc | 6.685 | 23,98 | 341 | 24,45 | ||||
| 2026-02-04 | 13F | Beverly Hills Private Wealth, LLC | 87.856 | 0,00 | 4.481 | 0,00 | ||||
| 2026-02-05 | 13F | Allworth Financial LP | 162 | 25,58 | 8 | 33,33 | ||||
| 2026-02-17 | 13F | Captrust Financial Advisors | 985.755 | 0,00 | 50.333 | 0,12 | ||||
| 2026-01-21 | 13F | Raleigh Capital Management Inc. | 256 | 13 | ||||||
| 2026-02-09 | 13F | Avalon Trust Co | 1.331.424 | 2,68 | 67.983 | 2,80 | ||||
| 2026-01-30 | 13F/A | M&t Bank Corp | 4.235.792 | -7,28 | 216.280 | -7,17 | ||||
| 2026-02-05 | 13F | Cambridge Investment Research Advisors, Inc. | 837.787 | 3,60 | 43 | 2,44 | ||||
| 2026-02-17 | 13F | Two Sigma Securities, Llc | 5.992 | 306 | ||||||
| 2025-10-17 | 13F | FSC Wealth Advisors, LLC | 0 | -100,00 | 0 | -100,00 | ||||
| 2026-01-14 | 13F | Goelzer Investment Management, Inc. | 809.486 | 4,17 | 41.331 | 4,29 | ||||
| 2026-01-30 | 13F | Camden Capital, LLC | 0 | -100,00 | 0 | |||||
| 2026-02-11 | 13F | Janney Montgomery Scott LLC | 51.936 | -3,77 | 3 | 0,00 | ||||
| 2026-02-13 | 13F | Mariner, LLC | 56.209 | 4,78 | 2.870 | 4,90 | ||||
| 2026-02-12 | 13F | CIBC Private Wealth Group, LLC | 1.990 | 15,10 | 102 | 14,77 | ||||
| 2026-01-07 | 13F | Central Pacific Bank - Trust Division | 69.050 | 3.526 | ||||||
| 2026-02-09 | 13F | Huntington National Bank | 23 | |||||||
| 2026-02-13 | 13F | Colony Group, LLC | 504.668 | 11.240,85 | 25.858 | 11.341,15 | ||||
| 2026-02-04 | 13F | GGM Financials LLC | 0 | -100,00 | 0 | |||||
| 2026-01-06 | 13F | Farmers Trust Co | 471.897 | 24.095 | ||||||
| 2026-02-12 | 13F | Principal Securities, Inc. | 0 | -100,00 | 0 | |||||
| 2025-11-10 | 13F | Marks Group Wealth Management, Inc | 0 | -100,00 | 0 | |||||
| 2026-02-17 | 13F | Creative Planning | 16.228 | -62,42 | 829 | -62,40 | ||||
| 2026-02-17 | 13F | Modern Wealth Management, LLC | 277.267 | 0,48 | 14.157 | 0,60 | ||||
| 2026-02-12 | 13F | BRYN MAWR TRUST Co | 0 | -100,00 | 0 | -100,00 | ||||
| 2026-02-13 | 13F | Resources Investment Advisors, LLC. | 877.336 | -2,83 | 44.797 | -2,71 | ||||
| 2026-01-28 | 13F | Financial Perspectives, Inc | 463 | 24 | ||||||
| 2026-02-02 | 13F | Fifth Third Bancorp | 412 | 0,00 | 21 | 0,00 | ||||
| 2026-02-12 | 13F | Johnson Financial Group, Inc. | 12.827 | 0,00 | 657 | 0,46 | ||||
| 2025-10-22 | 13F | Gries Financial Llc | 7.278 | -36,99 | 371 | -35,92 | ||||
| 2026-01-30 | 13F | First National Bank Sioux Falls | 581.364 | 1,45 | 29.684 | 1,57 | ||||
| 2026-01-26 | 13F | Annex Advisory Services, LLC | 0 | -100,00 | 0 | |||||
| 2026-02-17 | 13F | Ancora Advisors, LLC | 1.864 | 0,00 | 95 | 0,00 | ||||
| 2026-01-23 | 13F | Nbt Bank N A /ny | 740 | 38 | ||||||
| 2026-01-28 | 13F | Schmidt P J Investment Management Inc | 20.255 | -14,82 | 1.034 | -14,69 | ||||
| 2026-02-03 | 13F | Koshinski Asset Management, Inc. | 5.432 | 1,04 | 277 | 1,09 | ||||
| 2025-11-17 | 13F | Kestra Investment Management, LLC | 0 | -100,00 | 0 | -100,00 | ||||
| 2026-02-11 | 13F | LPL Financial LLC | 5.014.914 | 7,98 | 256.061 | 8,11 | ||||
| 2026-02-18 | 13F | GWM Advisors LLC | 0 | -100,00 | 0 | |||||
| 2026-02-06 | 13F | Cadence Wealth Management LLC | 18.013 | -39,02 | 920 | -38,98 | ||||
| 2026-02-10 | 13F | Ssi Investment Management Llc | 155.741 | 7.952 | ||||||
| 2026-02-11 | 13F | Avise Financial Cooperative, Inc. | 47.437 | 2.422 | ||||||
| 2026-02-17 | 13F | NorthRock Partners, LLC | 9.072.433 | 9,51 | 463.238 | 9,64 | ||||
| 2026-01-29 | 13F | UBS Group AG | 253.000 | -8,14 | 12.918 | -8,03 | ||||
| 2026-01-12 | 13F | DAVENPORT & Co LLC | 33.364 | 2,56 | 1.704 | 2,65 | ||||
| 2026-02-17 | 13F | Private Advisor Group, LLC | 46.233 | 1,97 | 2.361 | 2,08 | ||||
| 2026-02-12 | 13F | Jane Street Group, Llc | 0 | -100,00 | 0 | |||||
| 2026-02-17 | 13F | Cdkv Holdings Llc | 23.032 | 1.176 | ||||||
| 2026-01-07 | 13F | Aventura Private Wealth, LLC | 153 | 0,00 | 8 | 0,00 | ||||
| 2026-02-06 | 13F | Global Retirement Partners, LLC | 36.254 | 8.511,40 | 1.851 | 8.714,29 | ||||
| 2026-02-09 | 13F | First National Trust Co | 738.014 | 3,35 | 37.683 | 3,47 | ||||
| 2026-02-05 | 13F | Bessemer Group Inc | 776 | 0 | ||||||
| 2026-02-11 | 13F | Franklin Resources Inc | 220 | 0,92 | 11 | 0,00 | ||||
| 2026-02-06 | 13F | Larson Financial Group LLC | 472 | 24 | ||||||
| 2026-02-17 | 13F | Fmr Llc | 1.203 | 170,95 | 61 | 177,27 | ||||
| 2026-04-03 | 13F | Investors Research Corp | 267 | 0,00 | 14 | 0,00 | ||||
| 2026-02-06 | 13F | Tortoise Investment Management, LLC | 38.660 | 1.974 | ||||||
| 2026-02-06 | 13F | Cullen/frost Bankers, Inc. | 0 | -100,00 | 0 | |||||
| 2026-02-12 | 13F | Bank Of Montreal /can/ | 305.573 | 7,32 | 15.603 | 7,44 | ||||
| 2026-01-05 | 13F | GAMMA Investing LLC | 312 | 16 | ||||||
| 2026-02-17 | 13F | Raymond James Financial Inc | 689.320 | 52,21 | 35.197 | 52,39 | ||||
| 2026-01-26 | 13F | Private Trust Co Na | 867 | -71,22 | 44 | -71,24 | ||||
| 2026-01-12 | 13F | Certified Advisory Corp | 11.293 | -78,57 | 577 | -78,56 | ||||
| 2026-01-14 | 13F | Acropolis Investment Management, LLC | 1.364.694 | 69.681 | ||||||
| 2026-01-09 | 13F | Pacifica Partners Inc. | 670 | 1,06 | 34 | 3,03 | ||||
| 2026-02-11 | 13F | Capital Analysts, Inc. | 466 | 0,00 | 0 | |||||
| 2026-02-13 | 13F | MAI Capital Management | 2.126 | -83,78 | 109 | -83,83 | ||||
| 2026-02-13 | 13F | First National Bank Of Omaha | 40.794 | -2,64 | 2.083 | -2,53 | ||||
| 2026-02-04 | 13F | LRI Investments, LLC | 591 | 0,00 | 30 | 0,00 | ||||
| 2026-02-17 | 13F | Wiley Bros.-aintree Capital, Llc | 15.197 | -0,48 | 776 | -0,39 | ||||
| 2026-02-03 | 13F | International Assets Investment Management, Llc | 168 | 9 | ||||||
| 2026-02-12 | 13F | Wealthspire Advisors, LLC | 0 | -100,00 | 0 | |||||
| 2025-10-30 | 13F | Twin Peaks Wealth Advisors, LLC | 0 | -100,00 | 0 | |||||
| 2026-02-12 | 13F | StoneX Group Inc. | 5.012 | 256 | ||||||
| 2026-02-17 | 13F | Imprint Wealth LLC | 201 | -50,00 | 10 | -50,00 | ||||
| 2026-02-17 | 13F | Citadel Advisors Llc | 0 | -100,00 | 0 | |||||
| 2025-10-24 | 13F | Citizens Financial Group Inc/ri | 0 | -100,00 | 0 | |||||
| 2026-01-14 | 13F | Eastern Bank | 0 | -100,00 | 0 | |||||
| 2026-02-12 | 13F | Triumph Capital Management | 304 | 16 | ||||||
| 2026-01-29 | 13F | Sanctuary Advisors, LLC | 494.168 | 49,35 | 25.232 | 49,52 | ||||
| 2026-02-12 | 13F | Founders Financial Alliance, LLC | 90 | 0,00 | 5 | 0,00 | ||||
| 2026-01-29 | 13F | Comerica Bank | 7.445 | -1,25 | 380 | -1,04 | ||||
| 2026-01-12 | 13F | AllSquare Wealth Management LLC | 0 | -100,00 | 0 | |||||
| 2026-02-13 | 13F | Integrated Wealth Concepts LLC | 114.484 | 2,01 | 5.846 | 2,13 | ||||
| 2026-01-29 | 13F | Kestra Private Wealth Services, Llc | 22.256 | 1.136 | ||||||
| 2026-01-30 | 13F | Us Bancorp \de\ | 11.599 | 25,52 | 592 | 25,69 | ||||
| 2026-02-13 | 13F | Mml Investors Services, Llc | 8.617 | 440 | ||||||
| 2026-02-17 | 13F | Mercer Global Advisors Inc /adv | 967.873 | 1,54 | 49.420 | 1,66 | ||||
| 2026-01-29 | 13F | D.a. Davidson & Co. | 9.286 | -27,79 | 474 | -27,63 | ||||
| 2026-01-21 | 13F | Signature Resources Capital Management, LLC | 665 | 1,06 | 34 | 0,00 | ||||
| 2026-02-10 | 13F/A | Northwestern Mutual Wealth Management Co | 63.586 | 3,98 | 3.247 | 4,11 | ||||
| 2026-01-23 | 13F | Farther Finance Advisors, LLC | 13 | -91,98 | 1 | -100,00 | ||||
| 2026-02-06 | 13F | Pnc Financial Services Group, Inc. | 3.625 | 16,30 | 185 | 17,09 | ||||
| 2026-01-14 | 13F | Centurion Wealth Management LLC | 12.328 | 629 | ||||||
| 2026-02-17 | 13F | Jones Financial Companies Lllp | 227.678 | 25,24 | 11.625 | 25,73 | ||||
| 2026-01-22 | 13F | O'Brien Wealth Partners LLC | 965.974 | 1,45 | 49.323 | 1,57 | ||||
| 2026-01-08 | 13F | Wealth Enhancement Advisory Services, Llc | 2.972.996 | 1,67 | 151.861 | 1,95 | ||||
| 2026-02-13 | 13F | Umb Bank N A/mo | 74.260 | 3.792 | ||||||
| 2026-02-18 | 13F | SkyView Investment Advisors, LLC | 988.597 | -2,32 | 50 | -1,96 | ||||
| 2026-02-10 | 13F | Bank of New York Mellon Corp | 311.724 | 25,72 | 15.917 | 25,87 | ||||
| 2026-01-08 | 13F | Choice Wealth Advisors, LLC | 315.673 | 1,19 | 16.118 | 1,31 | ||||
| 2026-02-12 | 13F | Keel Point, LLC | 32.376 | -35,76 | 1.653 | -35,68 | ||||
| 2026-02-03 | 13F | Legacy Wealth Managment, LLC/ID | 11 | 1 | ||||||
| 2026-01-15 | 13F | Wright Fund Managment, LLC | 900.978 | 0,00 | 46.004 | 0,12 | ||||
| 2026-02-10 | 13F | Envestnet Asset Management Inc | 313.077 | 636,13 | 15.986 | 636,98 | ||||
| 2026-02-06 | 13F | HighTower Advisors, LLC | 64.560 | -4,90 | 3.296 | -4,79 | ||||
| 2026-01-21 | 13F | Flagship Harbor Advisors, Llc | 27 | 1 | ||||||
| 2026-02-17 | 13F | Advisor Group Holdings, Inc. | 142.075 | -46,72 | 7.256 | -46,29 | ||||
| 2025-11-14 | 13F | Strategic Wealth Partners, Ltd. | 46 | 0,00 | 2 | 0,00 | ||||
| 2026-01-26 | 13F | Nations Financial Group Inc, /ia/ /adv | 11.320 | -17,19 | 578 | -17,07 | ||||
| 2026-01-21 | 13F | Sound Income Strategies, LLC | 27 | 0,00 | 1 | 0,00 | ||||
| 2026-01-30 | 13F | Sigma Planning Corp | 38.301 | 4,58 | 1.956 | 4,71 | ||||
| 2026-02-09 | 13F | Diversified Portfolios, Inc. | 22.973 | 2,22 | 1.173 | 2,36 | ||||
| 2026-02-13 | 13F | Alerus Financial Na | 0 | -100,00 | 0 | |||||
| 2026-02-13 | 13F | Wells Fargo & Company/mn | 483.336 | 18,65 | 24.679 | 18,79 | ||||
| 2026-02-05 | 13F | Atria Investments Llc | 14.803 | 756 | ||||||
| 2026-02-12 | 13F | BlackRock, Inc. | 5.866 | 6,89 | 299 | 7,17 | ||||
| 2026-02-13 | 13F | Arkadios Wealth Advisors | 4.472 | 228 | ||||||
| 2026-02-09 | 13F | Allen Capital Group, LLC | 67.130 | -3,52 | 3.428 | -3,41 | ||||
| 2026-03-06 | 13F | Hsbc Holdings Plc | 809.593 | 29,43 | 41.338 | 29,58 | ||||
| 2026-01-22 | 13F | Bfsg, Llc | 709 | 36 | ||||||
| 2026-01-27 | 13F | Wealth Enhancement Trust Services, Inc. | 98.117 | 5.010 | ||||||
| 2026-01-29 | 13F | Nbc Securities, Inc. | 493 | 1,02 | 25 | 4,17 | ||||
| 2026-02-17 | 13F | Summit Trail Advisors, Llc | 8.318 | -4,46 | 426 | -3,84 | ||||
| 2026-01-22 | 13F | Richardson Financial Services Inc. | 106 | 64 | ||||||
| 2026-02-13 | 13F | Kestra Advisory Services, LLC | 0 | -100,00 | 0 | |||||
| 2026-01-20 | 13F | Independence Bank of Kentucky | 47.332 | -9,36 | 2.417 | -9,28 | ||||
| 2026-01-23 | 13F | Assetmark, Inc | 1.178 | 35,25 | 60 | 36,36 | ||||
| 2026-02-05 | 13F | Western Wealth Management, LLC | 29.592 | 7,69 | 1.511 | 7,78 | ||||
| 2026-02-17 | 13F | Ameriprise Financial Inc | 5.111.472 | 12,91 | 260.990 | 13,05 | ||||
| 2026-02-13 | 13F | Delos Wealth Advisors, LLC | 579 | 0,00 | 30 | 0,00 |