Grundlæggende statistik
| Institutionelle ejere | 248 total, 248 long only, 0 short only, 0 long/short - change of 12,22% MRQ |
| Gennemsnitlig porteføljeallokering | 0.5479 % - change of 13,53% MRQ |
| Institutionelle aktier (lange) | 42.553.629 (ex 13D/G) - change of 7,32MM shares 20,79% MRQ |
| Institutionel værdi (lang) | $ 3.859.235 USD ($1000) |
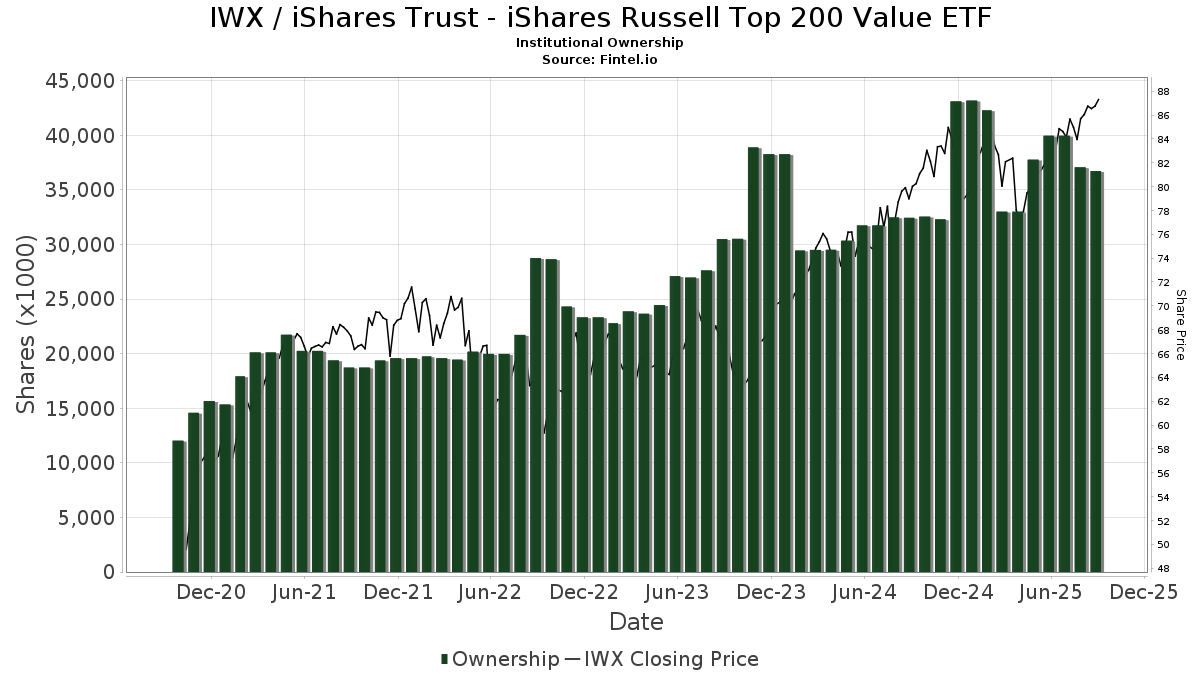
Institutionelt ejerskab og aktionærer
iShares Trust - iShares Russell Top 200 Value ETF (US:IWX) har 248 institutionelle ejere og aktionærer, der har indsendt 13D/G- eller 13F-formularer til Securities Exchange Commission (SEC). Disse institutioner har i alt 42,553,629 aktier. Største aktionærer omfatter Tiaa Trust, National Association, Envestnet Portfolio Solutions, Inc., First Citizens Bank & Trust Co, Envestnet Asset Management Inc, AE Wealth Management LLC, Lido Advisors, LLC, Clark Capital Management Group, Inc., LPL Financial LLC, First Citizens Asset Management, Inc., and BRYN MAWR TRUST Co .
iShares Trust - iShares Russell Top 200 Value ETF (ARCA:IWX) institutionel ejerskabsstruktur viser aktuelle positioner i virksomheden efter institutioner og fonde, samt seneste ændringer i positionsstørrelse. Større aktionærer kan omfatte individuelle investorer, investeringsforeninger, hedgefonde eller institutioner. Skema 13D angiver, at investoren besidder (eller besidder) mere end 5 % af virksomheden og har til hensigt (eller har til hensigt at) aktivt at forfølge en ændring i forretningsstrategi. Skema 13G indikerer en passiv investering på over 5%.
The share price as of April 20, 2026 is 97,99 / share. Previously, on April 21, 2025, the share price was 75,53 / share. This represents an increase of 29,74% over that period.
Fondens stemningsscore
Fund Sentiment Score (fka Ownership Accumulation Score) finder de aktier, der bliver mest købt af fonde. Det er resultatet af en sofistikeret, multi-faktor kvantitativ model, der identificerer virksomheder med de højeste niveauer af institutionel akkumulering. Scoringsmodellen bruger en kombination af den samlede stigning i oplyste ejere, ændringerne i porteføljeallokeringer i disse ejere og andre målinger. Tallet går fra 0 til 100, hvor højere tal indikerer et højere niveau af akkumulering for sine jævnaldrende, og 50 er gennemsnittet.
Opdateringsfrekvens: Dagligt
Se Ownership Explorer, som giver en liste over højest rangerende virksomheder.
AI+ Ask Fintel’s AI assistant about iShares Trust - iShares Russell Top 200 Value ETF.
Select a question to share a public post with an AI-crafted answer.
Thinking of good questions…
Institutionel Put/Call-forhold
Ud over at indberette standardaktie- og gældsudstedelser skal institutter med mere end 100 mill. aktiver under forvaltning også oplyse deres put- og call-optionsbeholdninger. Da salgsoptioner generelt indikerer negativ stemning, og købsoptioner indikerer positiv stemning, kan vi få en fornemmelse af den overordnede institutionelle stemning ved at plotte forholdet mellem put og kald. Diagrammet til højre viser det historiske put/call-forhold for dette instrument.
Brug af Put/Call Ratio som en indikator for investorernes stemning overvinder en af de vigtigste mangler ved at bruge totalt institutionelt ejerskab, som er, at en betydelig mængde af aktiver under forvaltning investeres passivt for at spore indekser. Passivt forvaltede fonde køber typisk ikke optioner, så indikatoren for put/call-forholdet følger mere nøje følelsen af aktivt forvaltede fonde.
13F og NPORT arkivering
Detaljer om 13F-arkivering er gratis. Detaljer om NP-ansøgninger kræver et premium-medlemskab. Grønne rækker angiver nye positioner. Røde rækker angiver lukkede positioner. Klik på linket ikon for at se den fulde transaktionshistorik.
Opgrader
for at låse premium-data op og eksportere til Excel ![]() .
.
| Fil dato | Kilde | Investor | Type | Gennemsnitlig pris (Øst) |
Aktier | Δ Aktier (%) |
Rapporteret Værdi ($1000) |
Δ Værdi (%) |
Port Alloc (%) |
|
|---|---|---|---|---|---|---|---|---|---|---|
| 2026-02-11 | 13F | Tiaa Trust, National Association | 12.344.150 | 1,63 | 1.133.934 | 6,24 | ||||
| 2026-04-17 | 13F | IFC & Insurance Marketing, Inc. | 0 | -100,00 | 0 | |||||
| 2026-02-06 | 13F | Lloyd Advisory Services, LLC. | 8.594 | -1,25 | 789 | 3,27 | ||||
| 2026-02-03 | 13F | Ballast Advisors Llc | 3.606 | 0,00 | 331 | 4,75 | ||||
| 2026-01-30 | 13F | Strategic Blueprint, LLC | 16.716 | 0,00 | 1.536 | 4,49 | ||||
| 2026-01-26 | 13F | SMART Wealth LLC | 8.736 | 5,29 | 802 | 10,01 | ||||
| 2026-02-09 | 13F | Atlantic Trust, LLC | 103 | 0,00 | 9 | 0,00 | ||||
| 2026-02-03 | 13F | Arcadia Wealth Management, LLC | 14.443 | -0,12 | 1.327 | 4,41 | ||||
| 2026-02-17 | 13F | Matters Capital Llc | 52.181 | 4.793 | ||||||
| 2026-02-06 | 13F | Global Retirement Partners, LLC | 5.132 | 661,42 | 471 | 698,31 | ||||
| 2026-02-12 | 13F | Voya Investment Management Llc | 37.343 | 228,67 | 3.430 | 243,69 | ||||
| 2026-02-13 | 13F | Brown Advisory Inc | 18.412 | 1.691 | ||||||
| 2025-11-07 | 13F | Synovus Financial Corp | 10.051 | -7,41 | 884 | -3,39 | ||||
| 2026-02-13 | 13F | Arkadios Wealth Advisors | 141.935 | 2.226,04 | 13.038 | 2.332,46 | ||||
| 2026-02-13 | 13F | Mariner, LLC | 50.183 | -5,46 | 4.610 | -1,18 | ||||
| 2026-01-22 | 13F | Richardson Financial Services Inc. | 530 | 49 | ||||||
| 2026-02-04 | 13F | Meridian Wealth Management, LLC | 3.851 | 0,18 | 354 | 4,75 | ||||
| 2026-02-06 | 13F | GPS Wealth Strategies Group, LLC | 0 | -100,00 | 0 | |||||
| 2026-02-17 | 13F | National Asset Management, Inc. | 20.482 | 1.881 | ||||||
| 2026-02-10 | 13F | Continuum Advisory, LLC | 2.472 | 1,48 | 227 | 6,07 | ||||
| 2026-04-20 | 13F | Centennial Wealth Advisory LLC | 0 | -100,00 | 0 | |||||
| 2026-02-17 | 13F | Advisory Services Network, LLC | 0 | -100,00 | 0 | |||||
| 2025-11-13 | 13F | Renaissance Technologies Llc | 0 | -100,00 | 0 | |||||
| 2026-02-10 | 13F | Cherry Tree Wealth Management, LLC | 267 | 0,00 | 25 | 4,35 | ||||
| 2026-01-26 | 13F | Cordatus Wealth Management LLC | 2.352 | 0,00 | 216 | 4,85 | ||||
| 2026-02-12 | 13F | Steward Partners Investment Advisory, Llc | 1.863 | 92,46 | 171 | 101,18 | ||||
| 2026-02-17 | 13F | Quantinno Capital Management LP | 7.455 | 4,90 | 685 | 9,62 | ||||
| 2026-01-06 | 13F | Ransom Advisory, Ltd | 68 | 6 | ||||||
| 2026-02-06 | 13F | GLOBALT Investments LLC / GA | 65.160 | -2,18 | 5.986 | 2,24 | ||||
| 2026-02-17 | 13F | Blair William & Co/il | 3.543 | 0,00 | 325 | 4,50 | ||||
| 2026-02-06 | 13F | Wilian Securities, LLC | 10.078 | 926 | ||||||
| 2026-02-17 | 13F | GeoWealth Management, LLC | 2.190 | 201 | ||||||
| 2026-02-06 | 13F | BOK Financial Private Wealth, Inc. | 745 | 0,00 | 68 | 4,62 | ||||
| 2026-02-11 | 13F | Parallel Advisors, LLC | 3.031 | -31,08 | 278 | -27,98 | ||||
| 2025-11-12 | 13F | Alpha Zero LLC | 13.925 | 0,00 | 1.224 | 4,35 | ||||
| 2026-02-17 | 13F | EFG International AG | 1.110 | 102 | ||||||
| 2026-02-02 | 13F | B.O.S.S. Retirement Advisors, LLC | 21.827 | -64,65 | 2.005 | -63,04 | ||||
| 2026-02-09 | 13F | Key FInancial Inc | 1.395 | 0,00 | 128 | 4,92 | ||||
| 2026-02-17 | 13F | Tower Research Capital LLC (TRC) | 0 | -100,00 | 0 | |||||
| 2026-02-12 | 13F | Hrt Financial Lp | 6.009 | 1 | ||||||
| 2026-02-13 | 13F | Ausdal Financial Partners, Inc. | 18.551 | 58,95 | 1.704 | 66,24 | ||||
| 2026-02-18 | 13F | First Citizens Bank & Trust Co | 5.983.534 | 1,31 | 549.647 | 5,89 | ||||
| 2025-11-13 | 13F | Glenmede Investment Management, LP | 5.348 | 0,00 | 470 | 4,22 | ||||
| 2026-04-20 | 13F | LifeWealth Investments, LLC | 228.555 | 17,95 | 21.180 | 19,00 | ||||
| 2026-01-20 | 13F | SOA Wealth Advisors, LLC. | 32.712 | -1,10 | 3.005 | 3,37 | ||||
| 2026-04-17 | 13F | Fifth Third Wealth Advisors LLC | 34.175 | 39,63 | 3.167 | 40,84 | ||||
| 2026-02-06 | 13F | Envestnet Portfolio Solutions, Inc. | 6.332.301 | 1,50 | 581.685 | 6,10 | ||||
| 2026-01-26 | 13F | Key Capital Management, INC | 49.531 | 4.550 | ||||||
| 2026-02-12 | 13F | Bank Of Montreal /can/ | 4.754 | 1,62 | 437 | 6,08 | ||||
| 2026-02-13 | 13F | Change Path, LLC | 3.514 | 3,66 | 323 | 8,42 | ||||
| 2026-04-16 | 13F | Diversified Trust Co | 3.072 | 0,00 | 285 | 0,71 | ||||
| 2026-01-29 | 13F | Quest 10 Wealth Builders, Inc. | 21.489 | 3,24 | 1.974 | 7,93 | ||||
| 2026-01-29 | 13F | Sanctuary Advisors, LLC | 148.901 | -1,75 | 13.678 | 2,70 | ||||
| 2026-02-12 | 13F | Jane Street Group, Llc | 0 | -100,00 | 0 | -100,00 | ||||
| 2026-02-13 | 13F | Ubs Asset Management Americas Inc | 1.182 | 109 | ||||||
| 2026-01-22 | 13F | Networth Advisors, LLC | 6.235 | 573 | ||||||
| 2026-02-06 | 13F | Pnc Financial Services Group, Inc. | 13.710 | -3,96 | 1.259 | 0,40 | ||||
| 2026-02-17 | 13F | Parvin Asset Management, LLC | 2.197 | 202 | ||||||
| 2026-02-06 | 13F | Kingdom Financial Group LLC. | 273.745 | 144,29 | 25.146 | 155,37 | ||||
| 2026-01-27 | 13F | Regions Financial Corp | 2.418 | 0,00 | 222 | 4,72 | ||||
| 2025-11-12 | 13F | CIBC Bancorp USA Inc. | 16.113 | 1.416 | ||||||
| 2026-04-14 | 13F | Beacon Investment Advisory Services, Inc. | 90 | 8 | ||||||
| 2026-02-04 | 13F | JSF Financial, LLC | 274.344 | -0,58 | 25.201 | 3,93 | ||||
| 2026-01-21 | 13F | Newbridge Financial Services Group, Inc. | 39 | 4 | ||||||
| 2026-02-10 | 13F | REAP Financial Group, LLC | 4.348 | 0,07 | 399 | 4,72 | ||||
| 2026-02-13 | 13F | Morgan Stanley | 252.202 | 36,33 | 23.167 | 42,51 | ||||
| 2026-02-13 | 13F | Venture Visionary Partners LLC | 15.017 | 0,23 | 1.379 | 4,79 | ||||
| 2026-02-17 | 13F | Warren Averett Asset Management, LLC | 205.791 | -0,90 | 18.904 | 3,59 | ||||
| 2026-02-17 | 13F | Captrust Financial Advisors | 7.501 | 0,00 | 689 | 4,55 | ||||
| 2026-04-20 | 13F | McKinley Carter Wealth Services, Inc. | 10.590 | 0,00 | 981 | 0,93 | ||||
| 2026-02-05 | 13F | Allworth Financial LP | 186 | 0,00 | 17 | 6,25 | ||||
| 2026-02-13 | 13F | Stifel Financial Corp | 10.921 | 3,02 | 1.003 | 7,73 | ||||
| 2026-01-13 | 13F | Synergy Financial Management, LLC | 3.145 | -6,20 | 289 | -2,04 | ||||
| 2026-02-13 | 13F | Sterling Capital Management LLC | 194.236 | -22,17 | 17.843 | -18,64 | ||||
| 2026-02-26 | 13F | Anchor Investment Management, LLC | 500 | 25,00 | 46 | 28,57 | ||||
| 2026-04-10 | 13F | Linden Thomas Advisory Services, LLC | 4.748 | -77,45 | 440 | -77,30 | ||||
| 2026-04-07 | 13F | Eastern Bank | 1.993 | 0,00 | 185 | 0,55 | ||||
| 2026-01-20 | 13F | Signaturefd, Llc | 0 | -100,00 | 0 | |||||
| 2026-01-21 | 13F | MBL Wealth, LLC | 5.000 | 0,00 | 459 | 4,56 | ||||
| 2026-02-05 | 13F | AlphaCore Capital LLC | 270 | 0,00 | 25 | 4,35 | ||||
| 2026-04-13 | 13F | St Germain D J Co Inc | 294 | 0,00 | 27 | 0,00 | ||||
| 2026-01-26 | 13F | Wbh Advisory Inc | 2.263 | 208 | ||||||
| 2026-02-02 | 13F | Cornerstone Planning Group LLC | 258 | 25 | ||||||
| 2026-04-20 | 13F | MBM Wealth Consultants, LLC | 68 | 6 | ||||||
| 2026-02-10 | 13F | One Capital Management, LLC | 79.573 | 7.310 | ||||||
| 2026-04-17 | 13F | Brown, Lisle/cummings, Inc. | 143 | 13 | ||||||
| 2026-02-02 | 13F | Truist Financial Corp | 179.794 | -2,36 | 16.516 | 2,06 | ||||
| 2026-02-13 | 13F | Colony Group, LLC | 2.785 | 0,00 | 256 | 4,51 | ||||
| 2026-02-10 | 13F | Anchor Capital Advisors Llc | 2.540 | -1,17 | 233 | 3,56 | ||||
| 2025-11-12 | 13F | Creekmur Asset Management LLC | 1 | 0,00 | 0 | |||||
| 2026-04-17 | 13F | AdvisorNet Financial, Inc | 1.175 | -20,34 | 109 | -20,00 | ||||
| 2026-02-12 | 13F | Financial Engines Advisors L.L.C. | 2.744 | 8,67 | 252 | 14,03 | ||||
| 2026-02-17 | 13F | Signature Equity Partners, LLC | 1.259 | 116 | ||||||
| 2026-04-13 | 13F | Creative Financial Designs Inc /adv | 67 | 6 | ||||||
| 2026-02-11 | 13F | Vermillion Wealth Management, Inc. | 0 | -100,00 | 0 | |||||
| 2026-02-18 | 13F | GWM Advisors LLC | 187.453 | 12,58 | 17.219 | 17,68 | ||||
| 2026-04-13 | 13F | Cyndeo Wealth Partners, LLC | 3.411 | 0,00 | 316 | 0,96 | ||||
| 2026-01-20 | 13F | Stratos Wealth Advisors, LLC | 12.848 | 10,90 | 1.180 | 15,91 | ||||
| 2026-01-15 | 13F | Victory Financial Group, Llc | 8.132 | -3,84 | 747 | 0,54 | ||||
| 2026-04-15 | 13F | Silverlake Wealth Management Llc | 3.540 | 0,63 | 328 | 1,55 | ||||
| 2026-02-04 | 13F | Global Wealth Management Investment Advisory, Inc. | 22.477 | -7,30 | 2.065 | -3,10 | ||||
| 2025-10-30 | 13F | Gibbs Wealth Management | 0 | -100,00 | 0 | |||||
| 2026-01-07 | 13F | Sagespring Wealth Partners, Llc | 3.086 | 0,00 | 283 | 4,43 | ||||
| 2026-01-07 | 13F | Harbor Investment Advisory, Llc | 50.283 | -0,32 | 4.619 | 4,20 | ||||
| 2026-02-11 | 13F | Franklin Resources Inc | 7.895 | -4,94 | 725 | -0,55 | ||||
| 2026-02-12 | 13F | Brinker Capital Investments, LLC | 361.960 | 33.250 | ||||||
| 2026-04-13 | 13F | Richard P Slaughter Associates Inc | 488.545 | 18,73 | 45.273 | 19,78 | ||||
| 2026-04-16 | 13F | Heck Capital Advisors, LLC | 15.125 | -12,38 | 1.402 | -11,61 | ||||
| 2026-04-15 | 13F | Merit Financial Group, LLC | 7.652 | 0,00 | 709 | 1,00 | ||||
| 2026-02-12 | 13F | Brown Brothers Harriman & Co | 4.564 | 0,00 | 419 | 4,49 | ||||
| 2026-02-10 | 13F | Foundations Investment Advisors, LLC | 11.664 | -13,09 | 1.071 | -9,16 | ||||
| 2026-02-13 | 13F | First National Bank Of Omaha | 18.226 | 1.685 | ||||||
| 2026-02-13 | 13F | Gts Securities Llc | 0 | -100,00 | 0 | |||||
| 2026-02-12 | 13F | Index Technologies Group LLC | 6.874 | 631 | ||||||
| 2026-02-11 | 13F | Janney Montgomery Scott LLC | 3.077 | -1,54 | 0 | |||||
| 2026-01-27 | 13F | Horst & Graben Wealth Management LLC | 132.912 | 13,55 | 12.215 | 18,75 | ||||
| 2026-02-06 | 13F | New Millennium Group LLC | 95 | 0,00 | 9 | 0,00 | ||||
| 2026-02-12 | 13F | Tripletail Wealth Management, LLC | 0 | -100,00 | 0 | |||||
| 2026-04-14 | 13F | Compton Wealth Advisory Group, LLC | 245.302 | -1,90 | 22.847 | -0,54 | ||||
| 2026-02-04 | 13F | Ameritas Advisory Services, LLC | 0 | -100,00 | 0 | |||||
| 2026-02-13 | 13F | Pine Valley Investments Ltd Liability Co | 0 | -100,00 | 0 | |||||
| 2026-02-18 | 13F | EP Wealth Advisors, Inc. | 0 | -100,00 | 0 | |||||
| 2026-04-17 | 13F | Boston Private Wealth Llc | 459.948 | -9,53 | 42.623 | -8,73 | ||||
| 2026-02-14 | 13F | Rockefeller Capital Management L.P. | 20.080 | -1,02 | 1.845 | 3,48 | ||||
| 2026-04-10 | 13F | RTD Financial Advisors, Inc. | 269.988 | 11,40 | 25.020 | 12,38 | ||||
| 2026-01-21 | 13F | Sound Income Strategies, LLC | 1.007 | -24,29 | 96 | -18,80 | ||||
| 2026-02-10 | 13F | Envestnet Asset Management Inc | 3.083.814 | 3.723,18 | 283.279 | 3.896,60 | ||||
| 2026-04-14 | 13F | Prospera Financial Services Inc | 10.264 | 0,00 | 951 | 0,96 | ||||
| 2026-02-17 | 13F | Bank Of America Corp /de/ | 237.414 | 0,01 | 21.809 | 4,53 | ||||
| 2026-02-03 | 13F | Alta Wealth Advisors LLC | 2.400 | 0,00 | 220 | 4,76 | ||||
| 2026-01-12 | 13F | GenWealth Group, Inc. | 5.836 | 0,00 | 550 | 7,23 | ||||
| 2026-01-29 | 13F | UBS Group AG | 341.122 | 7,74 | 31.335 | 12,61 | ||||
| 2026-02-06 | 13F | Csenge Advisory Group | 57.257 | -1,26 | 5.260 | 3,20 | ||||
| 2026-02-11 | 13F | SOUTH STATE Corp | 1.013 | 0,00 | 93 | 4,49 | ||||
| 2026-04-07 | 13F | CoreCap Advisors, LLC | 1.385 | 34,21 | 128 | 36,17 | ||||
| 2026-01-30 | 13F | Us Bancorp \de\ | 3.078 | 247,40 | 283 | 266,23 | ||||
| 2026-01-30 | 13F | Laurel Wealth Advisors LLC | 3.900 | 0,00 | 358 | 4,68 | ||||
| 2026-02-05 | 13F | Cambridge Investment Research Advisors, Inc. | 84.138 | 7,09 | 8 | 16,67 | ||||
| 2026-02-17 | 13F | Raymond James Financial Inc | 136.000 | 5,23 | 12.493 | 9,99 | ||||
| 2025-11-04 | 13F | Pineridge Advisors LLC | 4.564 | 7,44 | 401 | 12,32 | ||||
| 2026-02-11 | 13F | Strategic Advocates LLC | 70 | 6 | ||||||
| 2026-04-15 | 13F | Trust Co Of Toledo Na /oh/ | 48 | 0,00 | 4 | 0,00 | ||||
| 2026-02-13 | 13F | 1832 Asset Management L.P. | 3.045 | 0,00 | 280 | 4,49 | ||||
| 2026-02-04 | 13F | Pensionmark Financial Group, Llc | 38.078 | 656 | ||||||
| 2026-02-11 | 13F | Greykasell Wealth Strategies, Inc. | 203 | 0,00 | 19 | 5,88 | ||||
| 2026-01-30 | 13F | Simplicity Wealth,LLC | 98.409 | 4,70 | 9.040 | 9,44 | ||||
| 2026-02-05 | 13F | Mason & Associates Inc | 8.420 | 0,00 | 773 | 4,60 | ||||
| 2026-01-28 | 13F | Confluence Wealth Services, Inc. | 5.924 | 0,00 | 544 | 4,62 | ||||
| 2026-02-13 | 13F | MAI Capital Management | 3.869 | 0,00 | 355 | 4,41 | ||||
| 2026-02-11 | 13F | Howard Bailey Securities, Llc | 191.245 | 5,00 | 17.568 | 9,75 | ||||
| 2026-02-12 | 13F | Granite Islands Private Wealth, Llc | 2.220 | 203 | ||||||
| 2026-02-17 | 13F | Maripau Wealth Management Llc | 3.156 | -5,23 | 290 | -1,03 | ||||
| 2026-01-22 | 13F | Yoder Wealth Management, Inc. | 3.741 | 0,00 | 344 | 4,57 | ||||
| 2026-02-10 | 13F | SCS Capital Management LLC | 8.851 | 0,00 | 813 | 4,63 | ||||
| 2026-02-11 | 13F | J.w. Cole Advisors, Inc. | 0 | -100,00 | 0 | |||||
| 2026-02-13 | 13F | Granville Capital, Inc. | 30.778 | 2.827 | ||||||
| 2025-11-04 | 13F | Guerra Advisors Inc | 1.210 | 106 | ||||||
| 2026-04-07 | 13F | Farther Finance Advisors, LLC | 7.920 | 3,87 | 738 | 5,29 | ||||
| 2026-01-26 | 13F | BLB&B Advisors, LLC | 2.387 | 0,00 | 219 | 4,78 | ||||
| 2026-01-14 | 13F | Pallas Capital Advisors LLC | 3.768 | 0,00 | 346 | 4,53 | ||||
| 2026-02-17 | 13F | Equitable Holdings, Inc. | 7.552 | -8,65 | 694 | -4,55 | ||||
| 2026-01-23 | 13F | Assetmark, Inc | 87 | 141,67 | 8 | 133,33 | ||||
| 2026-02-11 | 13F | LPL Financial LLC | 640.842 | 654,70 | 58.868 | 688,89 | ||||
| 2026-04-17 | 13F | Signal Advisors Wealth, LLC | 19.116 | -2,59 | 1.771 | -1,72 | ||||
| 2026-01-30 | 13F | First Citizens Investor Services, Inc. | 442.953 | 0,27 | 40.690 | 4,81 | ||||
| 2026-02-05 | 13F | Atria Investments Llc | 4.740 | 435 | ||||||
| 2026-04-14 | 13F | SigFig Wealth Management, LLC | 40.777 | -20,59 | 3.779 | -19,91 | ||||
| 2026-02-17 | 13F | Advisor Group Holdings, Inc. | 113.899 | 1.807,22 | 10.463 | 1.904,41 | ||||
| 2026-01-28 | 13F | Family Wealth Group, LLC | 30.767 | 1,28 | 2.826 | 5,88 | ||||
| 2026-02-11 | 13F | Cerity Partners LLC | 3.101 | 17,42 | 285 | 22,41 | ||||
| 2026-04-10 | 13F | Waldron Private Wealth LLC | 21.097 | 21,89 | 1.955 | 23,03 | ||||
| 2026-01-26 | 13F | Private Trust Co Na | 3.017 | 0,00 | 277 | 4,53 | ||||
| 2026-04-21 | 13F | Decker Retirement Planning Inc. | 12.636 | 3,58 | 1.171 | 4,46 | ||||
| 2026-04-10 | 13F | Armstrong Advisory Group, Inc | 171 | 16 | ||||||
| 2026-02-10 | 13F | Lido Advisors, LLC | 973.669 | -1,99 | 89.332 | 2,32 | ||||
| 2026-02-17 | 13F | RMB Capital Management, LLC | 20.368 | 0,03 | 1.871 | 4,53 | ||||
| 2026-02-17 | 13F | Clark Capital Management Group, Inc. | 722.045 | 66.327 | ||||||
| 2026-02-17 | 13F | Prosperity Consulting Group, LLC | 3.105 | 0,00 | 285 | 4,78 | ||||
| 2026-01-23 | 13F | Legacy Advisory Services, LLC | 67.824 | 0,54 | 6.230 | 5,09 | ||||
| 2026-01-29 | 13F | Ashton Thomas Private Wealth, LLC | 19.247 | -37,25 | 1.768 | -34,40 | ||||
| 2026-02-10 | 13F | Evolution Wealth Management Inc. | 47 | -65,69 | 4 | -66,67 | ||||
| 2026-02-17 | 13F | Royal Bank Of Canada | 110.130 | -4,26 | 10.117 | 0,09 | ||||
| 2026-02-17 | 13F | Perennial Investment Advisors, LLC | 2.415 | 0,00 | 222 | 4,25 | ||||
| 2026-04-13 | 13F | Massmutual Trust Co Fsb/adv | 775 | -22,50 | 72 | -21,98 | ||||
| 2026-02-17 | 13F | Cresset Asset Management, LLC | 13.238 | 18,16 | 1.216 | 23,58 | ||||
| 2026-02-17 | 13F | Glenmede Trust Co Na | 4.399 | -19,15 | 404 | -9,62 | ||||
| 2026-04-17 | 13F | First Citizens Asset Management, Inc. | 513.728 | 5,38 | 47.607 | 6,31 | ||||
| 2026-02-02 | 13F | Legacy Edge Advisors, LLC | 2.848 | 262 | ||||||
| 2026-02-17 | 13F | Qube Research & Technologies Ltd | 492 | -64,17 | 45 | -62,50 | ||||
| 2026-02-10 | 13F/A | Northwestern Mutual Wealth Management Co | 25.852 | 1,20 | 2.375 | 5,79 | ||||
| 2026-02-13 | 13F | Ieq Capital, Llc | 3.277 | 301 | ||||||
| 2026-02-19 | 13F | Atomi Financial Group, Inc. | 8.293 | 762 | ||||||
| 2026-01-21 | 13F | Leo Wealth, LLC | 4.850 | 446 | ||||||
| 2026-01-22 | 13F | Centennial Advisors, LLC | 11.981 | 1.101 | ||||||
| 2026-01-30 | 13F | Kohmann Bosshard Financial Services, LLC | 9.398 | 0,00 | 863 | 4,61 | ||||
| 2026-02-12 | 13F | Rossby Financial, LCC | 43 | 4 | ||||||
| 2026-02-13 | 13F | Parkside Financial Bank & Trust | 632 | 0,00 | 58 | 5,45 | ||||
| 2026-02-17 | 13F | Ameriprise Financial Inc | 434.573 | 30,46 | 39.916 | 36,27 | ||||
| 2026-02-06 | 13F | HighTower Advisors, LLC | 50.237 | 238,11 | 4.615 | 253,56 | ||||
| 2026-01-26 | 13F | AE Wealth Management LLC | 1.081.107 | 3,16 | 99.311 | 7,84 | ||||
| 2026-02-13 | 13F | Wells Fargo & Company/mn | 132.660 | -1,28 | 12.186 | 3,20 | ||||
| 2026-02-17 | 13F | Pacific Financial Group Inc | 2.384 | 0,04 | 219 | 4,78 | ||||
| 2026-02-17 | 13F | Jones Financial Companies Lllp | 13.416 | 1,64 | 1.232 | 6,48 | ||||
| 2026-02-02 | 13F | One Wealth Advisors, LLC | 2.556 | -44,36 | 235 | -41,94 | ||||
| 2026-02-13 | 13F | Advyzon Investment Management, LLC | 6.015 | 553 | ||||||
| 2025-11-12 | 13F | Fisher Asset Management, LLC | 0 | -100,00 | 0 | |||||
| 2025-11-05 | 13F | Prime Buchholz LLC | 0 | -100,00 | 0 | |||||
| 2026-01-28 | 13F | Geneos Wealth Management Inc. | 9.214 | 3.499,22 | 846 | 3.745,45 | ||||
| 2026-02-10 | 13F | Argent Trust Co | 2.822 | 0,00 | 259 | 4,86 | ||||
| 2026-02-09 | 13F | Fidelis Capital Partners, LLC | 14.645 | -6,59 | 1.345 | -2,32 | ||||
| 2026-02-17 | 13F | Cetera Investment Advisers | 263.019 | 399,68 | 24.161 | 422,38 | ||||
| 2026-02-12 | 13F | CIBC Private Wealth Group, LLC | 15.885 | -1,42 | 1.459 | 3,04 | ||||
| 2026-02-12 | 13F | Commonwealth Equity Services, Llc | 58.073 | -3,90 | 5.335 | 106.580,00 | ||||
| 2026-02-02 | 13F | Fifth Third Bancorp | 6.664 | -12,55 | 612 | -8,52 | ||||
| 2026-04-09 | 13F | C2P Capital Advisory Group, LLC d.b.a. Prosperity Capital Advisors | 10.197 | 945 | ||||||
| 2026-02-17 | 13F | Cape Investment Advisory, Inc. | 127 | 12 | ||||||
| 2026-02-13 | 13F | Resources Investment Advisors, LLC. | 7.132 | 27,84 | 655 | 33,67 | ||||
| 2026-02-17 | 13F | Susquehanna International Group, Llp | 7.956 | -28,32 | 731 | -25,13 | ||||
| 2026-04-20 | 13F | Kestra Private Wealth Services, Llc | 182.574 | 0,40 | 16.919 | 1,29 | ||||
| 2026-02-03 | 13F | Centerpoint Advisory Group | 16.533 | 11,20 | 1.519 | 16,23 | ||||
| 2026-04-08 | 13F | Miracle Mile Advisors, LLC | 3.402 | -0,67 | 315 | 0,32 | ||||
| 2026-02-09 | 13F | Harbour Investments, Inc. | 829 | 101,70 | 76 | 111,11 | ||||
| 2026-02-12 | 13F | BRYN MAWR TRUST Co | 505.899 | 3,82 | 46.472 | 8,52 | ||||
| 2026-02-04 | 13F | Wsfs Capital Management, Llc | 257.834 | 3,49 | 23.685 | 8,18 | ||||
| 2026-02-13 | 13F | Citigroup Inc | 1.320 | -4,00 | 121 | 0,83 | ||||
| 2026-02-17 | 13F | Citadel Advisors Llc | 16.960 | 21,82 | 1.558 | 27,31 | ||||
| 2026-02-10 | 13F | Root Financial Partners, LLC | 26 | -53,57 | 2 | -50,00 | ||||
| 2026-02-06 | 13F | EverSource Wealth Advisors, LLC | 1.026 | 94 | ||||||
| 2026-02-03 | 13F | We Are One Seven, LLC | 2.462 | 226 | ||||||
| 2026-02-17 | 13F | Align Financial, LLC | 428.343 | 428 | ||||||
| 2026-02-02 | 13F | Oppenheimer & Co Inc | 41.450 | 5,78 | 3.808 | 10,57 | ||||
| 2026-04-13 | 13F | Kelly Financial Services LLC | 7.096 | -17,23 | 658 | -16,52 | ||||
| 2026-02-12 | 13F | BlackRock, Inc. | 4.214 | 0,00 | 387 | 4,59 | ||||
| 2026-02-17 | 13F | Pinnacle Financial Partners, Inc. | 10.811 | 993 | ||||||
| 2026-04-16 | 13F | Brookstone Capital Management | 0 | -100,00 | 0 | |||||
| 2026-02-17 | 13F | Claro Advisors LLC | 9.945 | 21,90 | 914 | 27,51 | ||||
| 2026-04-07 | 13F | Park Avenue Securities Llc | 0 | -100,00 | 0 | |||||
| 2026-01-30 | 13F/A | M&t Bank Corp | 4.753 | 0,00 | 437 | 4,56 | ||||
| 2026-02-13 | 13F | Golden State Wealth Management, LLC | 103 | 0,00 | 9 | 0,00 | ||||
| 2026-02-02 | 13F | FSA Advisors, Inc. | 0 | -100,00 | 0 | -100,00 | ||||
| 2026-01-30 | 13F | Sigma Planning Corp | 3.790 | 47,24 | 348 | 53,98 | ||||
| 2026-01-29 | 13F | Comerica Bank | 2.439 | 0,00 | 224 | 4,67 | ||||
| 2026-02-02 | 13F | Vantage Point Financial LLC | 4.516 | 0,02 | 415 | 4,55 | ||||
| 2026-02-17 | 13F | Aqr Capital Management Llc | 5.862 | 55,57 | 538 | 62,54 | ||||
| 2026-04-20 | 13F | Ronald Blue Trust, Inc. | 2.372 | -25,08 | 220 | -24,48 | ||||
| 2026-02-12 | 13F | Colonial Trust Co / SC | 1.435 | 0,00 | 132 | 3,97 | ||||
| 2026-02-13 | 13F | Integrated Wealth Concepts LLC | 50.543 | 54,49 | 4.643 | 61,46 | ||||
| 2026-01-27 | 13F | First Horizon Corp | 421 | -3,00 | 39 | 0,00 | ||||
| 2026-04-20 | 13F | Jfs Wealth Advisors, Llc | 3.676 | 241,32 | 341 | 246,94 | ||||
| 2026-02-13 | 13F | Veridan Wealth LLC | 0 | -100,00 | 0 | |||||
| 2026-04-20 | 13F | KFA Private Wealth Group, LLC | 5.137 | 90,05 | 476 | 91,94 | ||||
| 2026-04-16 | 13F | Triad Wealth Partners, LLC | 13.972 | 1.295 | ||||||
| 2026-02-09 | 13F | LifePlan Investment Advisors, Inc. | 3.064 | -0,10 | 281 | 4,46 | ||||
| 2026-02-10 | 13F | Goldman Sachs Group Inc | 164.473 | 425,93 | 15.108 | 449,78 | ||||
| 2026-02-11 | 13F | Jpmorgan Chase & Co | 261.280 | 0,13 | 24.001 | 4,67 | ||||
| 2026-02-13 | 13F | Kestra Advisory Services, LLC | 0 | -100,00 | 0 | |||||
| 2026-01-26 | 13F | Cwm, Llc | 15.392 | 150,72 | 1 | |||||
| 2025-11-12 | 13F | Transce3nd, LLC | 0 | -100,00 | 0 | |||||
| 2026-02-17 | 13F | Creative Planning | 2.837 | 14,53 | 261 | 19,82 | ||||
| 2026-02-12 | 13F | Custom Index Systems, Llc | 8.364 | -24,87 | 768 | -21,47 | ||||
| 2025-11-07 | 13F | Beacon Capital Management, LLC | 0 | -100,00 | 0 | |||||
| 2026-01-20 | 13F | FLP Wealth Management, LLC | 9.278 | 9,97 | 980 | 32,12 | ||||
| 2026-02-10 | 13F | Sentinus, LLC | 2.267 | -3,33 | 208 | 0,97 | ||||
| 2026-02-13 | 13F | Smartleaf Asset Management LLC | 8.511 | 0,00 | 787 | 5,36 | ||||
| 2026-02-17 | 13F | Two Sigma Investments, Lp | 0 | -100,00 | 0 | |||||
| 2026-02-17 | 13F | Fmr Llc | 14.870 | 6,73 | 1.366 | 11,52 | ||||
| 2026-02-06 | 13F | Evoke Wealth, Llc | 3.072 | -8,11 | 282 | -3,75 | ||||
| 2026-02-11 | 13F | O'shaughnessy Asset Management, Llc | 6.426 | 1,10 | 590 | 5,73 | ||||
| 2026-02-11 | 13F | First American Trust, Fsb | 24.802 | 2.278 | ||||||
| 2026-02-13 | 13F | Mml Investors Services, Llc | 132.439 | 193,80 | 12.166 | 207,12 | ||||
| 2026-02-12 | 13F | Principal Securities, Inc. | 220.752 | 229.850,00 | 20.278 | 253.375,00 | ||||
| 2025-11-06 | 13F | Financial Advocates Investment Management | 0 | -100,00 | 0 | |||||
| 2026-02-13 | 13F | Aptus Capital Advisors, LLC | 28 | 0,00 | 3 | 0,00 | ||||
| 2026-02-17 | 13F | Private Advisor Group, LLC | 33.123 | 89,24 | 3.043 | 97,79 | ||||
| 2026-02-10 | 13F | CFS Investment Advisory Services, LLC | 17.284 | -1,63 | 1.588 | 1,08 |