Grundlæggende statistik
| Institutionelle ejere | 131 total, 131 long only, 0 short only, 0 long/short - change of 6,45% MRQ |
| Gennemsnitlig porteføljeallokering | 0.2408 % - change of -11,68% MRQ |
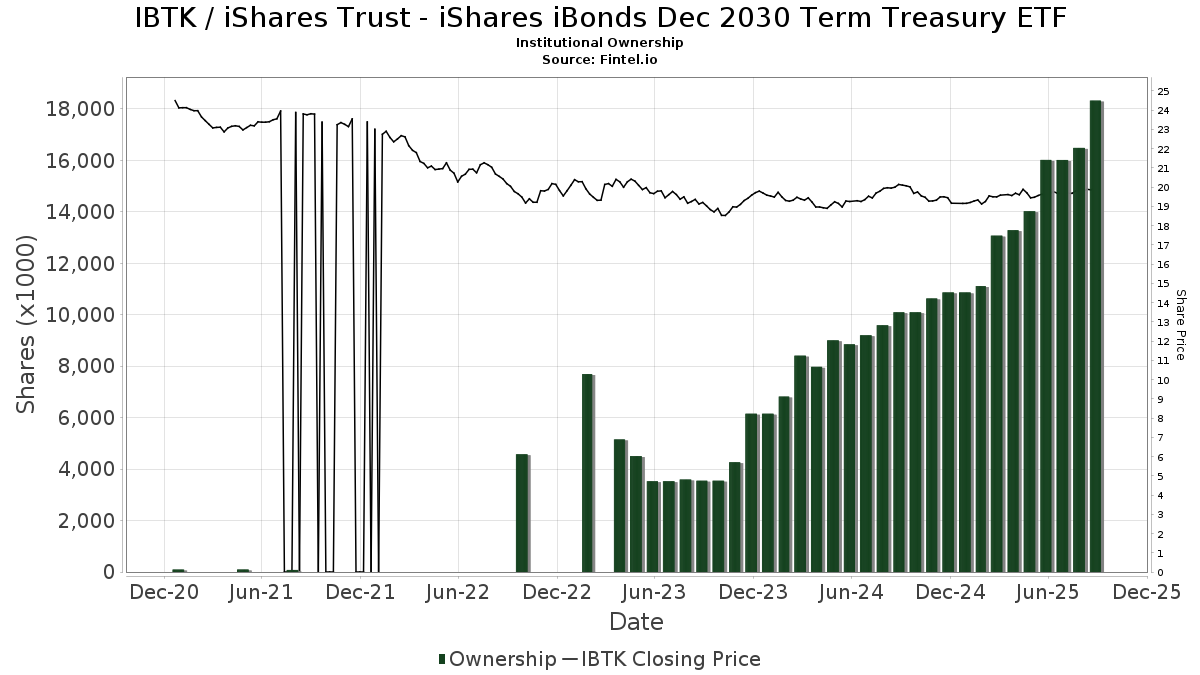
| Institutionelle aktier (lange) | 18.321.871 (ex 13D/G) - change of 2,31MM shares 14,40% MRQ |
| Institutionel værdi (lang) | $ 350.101 USD ($1000) |
Institutionelt ejerskab og aktionærer
iShares Trust - iShares iBonds Dec 2030 Term Treasury ETF (US:IBTK) har 131 institutionelle ejere og aktionærer, der har indsendt 13D/G- eller 13F-formularer til Securities Exchange Commission (SEC). Disse institutioner har i alt 18,321,871 aktier. Største aktionærer omfatter Wells Fargo & Company/mn, Bank Of America Corp /de/, Envestnet Asset Management Inc, Titleist Asset Management, Llc, D.a. Davidson & Co., Mercer Global Advisors Inc /adv, Royal Bank Of Canada, Waycross Investment Management Co, Legacy Private Trust Co., and Probity Advisors, Inc. .
iShares Trust - iShares iBonds Dec 2030 Term Treasury ETF (NasdaqGM:IBTK) institutionel ejerskabsstruktur viser aktuelle positioner i virksomheden efter institutioner og fonde, samt seneste ændringer i positionsstørrelse. Større aktionærer kan omfatte individuelle investorer, investeringsforeninger, hedgefonde eller institutioner. Skema 13D angiver, at investoren besidder (eller besidder) mere end 5 % af virksomheden og har til hensigt (eller har til hensigt at) aktivt at forfølge en ændring i forretningsstrategi. Skema 13G indikerer en passiv investering på over 5%.
The share price as of September 12, 2025 is 19,93 / share. Previously, on September 13, 2024, the share price was 20,16 / share. This represents a decline of 1,12% over that period.
Fondens stemningsscore
Fund Sentiment Score (fka Ownership Accumulation Score) finder de aktier, der bliver mest købt af fonde. Det er resultatet af en sofistikeret, multi-faktor kvantitativ model, der identificerer virksomheder med de højeste niveauer af institutionel akkumulering. Scoringsmodellen bruger en kombination af den samlede stigning i oplyste ejere, ændringerne i porteføljeallokeringer i disse ejere og andre målinger. Tallet går fra 0 til 100, hvor højere tal indikerer et højere niveau af akkumulering for sine jævnaldrende, og 50 er gennemsnittet.
Opdateringsfrekvens: Dagligt
Se Ownership Explorer, som giver en liste over højest rangerende virksomheder.
Institutionel Put/Call-forhold
Ud over at indberette standardaktie- og gældsudstedelser skal institutter med mere end 100 mill. aktiver under forvaltning også oplyse deres put- og call-optionsbeholdninger. Da salgsoptioner generelt indikerer negativ stemning, og købsoptioner indikerer positiv stemning, kan vi få en fornemmelse af den overordnede institutionelle stemning ved at plotte forholdet mellem put og kald. Diagrammet til højre viser det historiske put/call-forhold for dette instrument.
Brug af Put/Call Ratio som en indikator for investorernes stemning overvinder en af de vigtigste mangler ved at bruge totalt institutionelt ejerskab, som er, at en betydelig mængde af aktiver under forvaltning investeres passivt for at spore indekser. Passivt forvaltede fonde køber typisk ikke optioner, så indikatoren for put/call-forholdet følger mere nøje følelsen af aktivt forvaltede fonde.
13F og NPORT arkivering
Detaljer om 13F-arkivering er gratis. Detaljer om NP-ansøgninger kræver et premium-medlemskab. Grønne rækker angiver nye positioner. Røde rækker angiver lukkede positioner. Klik på linket ikon for at se den fulde transaktionshistorik.
Opgrader
for at låse premium-data op og eksportere til Excel ![]() .
.
| Fil dato | Kilde | Investor | Type | Gennemsnitlig pris (Øst) |
Aktier | Δ Aktier (%) |
Rapporteret Værdi ($1000) |
Δ Værdi (%) |
Port Alloc (%) |
|
|---|---|---|---|---|---|---|---|---|---|---|
| 2025-08-12 | 13F | Reliant Wealth Planning | 17.629 | 44,98 | 350 | 46,03 | ||||
| 2025-04-22 | 13F | Mendota Financial Group, LLC | 0 | -100,00 | 0 | |||||
| 2025-07-16 | 13F | Old Port Advisors | 40.959 | 813 | ||||||
| 2025-08-14 | 13F | Susquehanna International Group, Llp | 0 | -100,00 | 0 | |||||
| 2025-07-08 | 13F | FF Advisors,LLC | 81.087 | 4,12 | 1.609 | 4,82 | ||||
| 2025-08-07 | 13F | Allworth Financial LP | 57.294 | 5.341,03 | 1.137 | 5.580,00 | ||||
| 2025-07-14 | 13F | UMA Financial Services, Inc. | 7.935 | 0,00 | 157 | 0,64 | ||||
| 2025-07-24 | 13F/A | TFR Capital, LLC. | 10.162 | -12,48 | 202 | -11,84 | ||||
| 2025-07-08 | 13F | Apella Capital, LLC | 20.845 | 0,11 | 409 | 0,49 | ||||
| 2025-07-30 | 13F | Granite Harbor Advisors, Inc. | 18.721 | 0,00 | 371 | 0,82 | ||||
| 2025-08-06 | 13F | Commonwealth Equity Services, Llc | 133.536 | 1,01 | 3 | 0,00 | ||||
| 2025-08-14 | 13F | Jane Street Group, Llc | 86.295 | 200,15 | 1.712 | 203,01 | ||||
| 2025-08-11 | 13F | United Capital Financial Advisers, Llc | 141.633 | 98,76 | 2.810 | 100,64 | ||||
| 2025-05-12 | 13F | Fmr Llc | 0 | -100,00 | 0 | |||||
| 2025-07-28 | 13F | Harbour Investments, Inc. | 12.940 | 564,61 | 257 | 573,68 | ||||
| 2025-07-08 | 13F | Parallel Advisors, LLC | 139.395 | 12,02 | 2.766 | 13,04 | ||||
| 2025-07-11 | 13F | Compass Ion Advisors, LLC | 26.997 | 0,00 | 536 | 0,94 | ||||
| 2025-08-13 | 13F | Flow Traders U.s. Llc | 0 | -100,00 | 0 | |||||
| 2025-08-01 | 13F | Logan Capital Management Inc | 330 | 7 | ||||||
| 2025-07-17 | 13F | Stockman Wealth Management, Inc. | 208.753 | 6,86 | 4.142 | 7,84 | ||||
| 2025-09-04 | 13F/A | Advisor Group Holdings, Inc. | 21.130 | -50,76 | 419 | -50,30 | ||||
| 2025-08-15 | 13F | Howland Capital Management Llc | 125.243 | 0,44 | 2.485 | 1,35 | ||||
| 2025-08-15 | 13F | Captrust Financial Advisors | 30.499 | 20,11 | 605 | 21,24 | ||||
| 2025-07-15 | 13F | BCS Wealth Management | 0 | -100,00 | 0 | |||||
| 2025-05-07 | 13F | Spectrum Wealth Counsel, LLC | 2.542 | 0,00 | 50 | 2,08 | ||||
| 2025-08-11 | 13F | Principal Securities, Inc. | 1.095 | 0,00 | 22 | 0,00 | ||||
| 2025-08-14 | 13F | Eight 31 Financial Llc | 81.485 | -25,32 | 1.617 | -24,66 | ||||
| 2025-08-14 | 13F | Smartleaf Asset Management LLC | 84.418 | -1,60 | 1.671 | -0,83 | ||||
| 2025-08-12 | 13F | Jpmorgan Chase & Co | 0 | -100,00 | 0 | |||||
| 2025-08-15 | 13F | Kestra Advisory Services, LLC | 74.067 | 17,82 | 1.469 | 18,95 | ||||
| 2025-08-11 | 13F | Guidance Point Advisors, LLC | 15.391 | 5,79 | 305 | 6,64 | ||||
| 2025-07-23 | 13F | Country Club Bank /gfn | 101.284 | -5,89 | 2.004 | -5,11 | ||||
| 2025-07-23 | 13F | Waycross Investment Management Co | 543.723 | 0,18 | 10.787 | 1,10 | ||||
| 2025-08-01 | 13F | Bank of Jackson Hole Trust | 3.745 | 0,00 | 74 | 1,37 | ||||
| 2025-08-14 | 13F | Financial Engines Advisors L.L.C. | 58.608 | 0,44 | 1.163 | 1,39 | ||||
| 2025-08-01 | 13F | Liberty Wealth Management Llc | 14.017 | 278 | ||||||
| 2025-07-08 | 13F | Lowe Wealth Advisors, LLC | 4.937 | -19,50 | 98 | -19,17 | ||||
| 2025-08-04 | 13F | Creative Financial Designs Inc /adv | 196 | 0,00 | 4 | 0,00 | ||||
| 2025-08-11 | 13F | Atlantic Private Wealth, LLC | 39.594 | -54,01 | 786 | -53,61 | ||||
| 2025-07-14 | 13F | U.S. Capital Wealth Advisors, LLC | 45.454 | 5,53 | 902 | 6,50 | ||||
| 2025-07-30 | 13F | Journey Advisory Group, LLC | 165.083 | 186,62 | 3.275 | 189,31 | ||||
| 2025-07-30 | 13F | Bogart Wealth, LLC | 3.560 | 0,00 | 71 | 1,45 | ||||
| 2025-08-12 | 13F | Proequities, Inc. | 0 | 0 | ||||||
| 2025-07-07 | 13F | Trust Co | 409.469 | -0,21 | 8.124 | 0,71 | ||||
| 2025-08-14 | 13F | Comerica Bank | 8.216 | -24,38 | 163 | -23,47 | ||||
| 2025-08-14 | 13F | Hilltop Holdings Inc. | 11.706 | 232 | ||||||
| 2025-08-14 | 13F | UBS Group AG | 280.525 | 0,19 | 5.566 | 1,11 | ||||
| 2025-07-23 | 13F | Valmark Advisers, Inc. | 51.049 | 15,80 | 1.013 | 16,86 | ||||
| 2025-08-12 | 13F | Waterloo Capital, L.P. | 11.900 | 0,00 | 236 | 1,29 | ||||
| 2025-07-08 | 13F | Legacy Private Trust Co. | 514.453 | 0,49 | 10.207 | 1,40 | ||||
| 2025-07-29 | 13F | Accretive Wealth Partners, LLC | 163.473 | 4,81 | 3.243 | 5,74 | ||||
| 2025-08-14 | 13F | Ameriprise Financial Inc | 116.555 | 4,46 | 2.312 | 5,43 | ||||
| 2025-08-13 | 13F | Hamel Associates, Inc. | 12.044 | 239 | ||||||
| 2025-07-30 | 13F | Strategic Blueprint, LLC | 38.443 | 763 | ||||||
| 2025-07-11 | 13F | First PREMIER Bank | 849 | -5,88 | 0 | |||||
| 2025-07-08 | 13F | Nbc Securities, Inc. | 41.632 | -3,81 | 1 | |||||
| 2025-08-13 | 13F | Holos Integrated Wealth LLC | 2.078 | 0,00 | 41 | 2,50 | ||||
| 2025-08-12 | 13F | Passive Capital Management, LLC. | 15.941 | 0,00 | 314 | 0,32 | ||||
| 2025-07-25 | 13F | Cwm, Llc | 17.570 | 28,84 | 0 | |||||
| 2025-07-14 | 13F | Mechanics Bank Trust Department | 94.500 | 5,29 | 1.875 | 6,24 | ||||
| 2025-07-24 | 13F | Leo Wealth, LLC | 25.096 | 1,76 | 498 | 2,69 | ||||
| 2025-08-12 | 13F | BlackRock, Inc. | 214.153 | 4.249 | ||||||
| 2025-08-07 | 13F | CENTRAL TRUST Co | 255.197 | 8,93 | 5.063 | 9,95 | ||||
| 2025-08-14 | 13F | Citadel Advisors Llc | 30.726 | -52,34 | 610 | -51,93 | ||||
| 2025-08-14 | 13F | Mml Investors Services, Llc | 24.934 | 137,15 | 0 | |||||
| 2025-08-05 | 13F | Cherry Tree Wealth Management, LLC | 4.963 | 14,12 | 98 | 15,29 | ||||
| 2025-08-14 | 13F | STAR Financial Bank | 106.985 | 10,92 | 2.123 | 11,92 | ||||
| 2025-08-18 | 13F/A | National Bank Of Canada /fi/ | 735 | 15 | ||||||
| 2025-07-09 | 13F | Krilogy Financial LLC | 372.535 | -0,08 | 7.391 | 0,83 | ||||
| 2025-07-14 | 13F | Park Avenue Securities Llc | 82.109 | 2 | ||||||
| 2025-08-15 | 13F | Morgan Stanley | 114.256 | 123,27 | 2.267 | 125,25 | ||||
| 2025-07-22 | 13F | Yoder Wealth Management, Inc. | 40.302 | 3,20 | 800 | 4,17 | ||||
| 2025-04-21 | 13F | Community Bank, N.A. | 0 | -100,00 | 0 | |||||
| 2025-07-24 | 13F | IFP Advisors, Inc | 125.270 | -3,11 | 2.485 | -2,20 | ||||
| 2025-08-01 | 13F | Envestnet Asset Management Inc | 1.152.213 | 83,76 | 22.860 | 85,44 | ||||
| 2025-08-07 | 13F | PFG Advisors | 47.524 | 943 | ||||||
| 2025-08-14 | 13F | Royal Bank Of Canada | 583.163 | 79,32 | 11.571 | 80,97 | ||||
| 2025-08-13 | 13F | Capital Analysts, Inc. | 2.354 | 0,00 | 0 | |||||
| 2025-05-06 | 13F | Venturi Wealth Management, LLC | 0 | -100,00 | 0 | |||||
| 2025-08-14 | 13F | GWM Advisors LLC | 7.352 | -83,09 | 146 | -83,02 | ||||
| 2025-08-18 | 13F/A | Kestra Investment Management, LLC | 17.745 | -49,58 | 352 | -49,06 | ||||
| 2025-07-29 | 13F | Mb, Levis & Associates, Llc | 848 | 0,95 | 17 | 0,00 | ||||
| 2025-04-29 | 13F | Element Wealth, LLC | 0 | -100,00 | 0 | |||||
| 2025-08-14 | 13F | Mercer Global Advisors Inc /adv | 639.493 | 886,29 | 12.688 | 895,84 | ||||
| 2025-08-14 | 13F | Integrated Wealth Concepts LLC | 62.996 | 0,24 | 1.250 | 1,13 | ||||
| 2025-08-13 | 13F | Cary Street Partners Financial Llc | 36.551 | 0,00 | 725 | 0,97 | ||||
| 2025-07-17 | 13F/A | Capital Investment Advisors, LLC | 14.720 | 25,03 | 292 | 26,41 | ||||
| 2025-08-14 | 13F | Stifel Financial Corp | 60.955 | 56,90 | 1.209 | 58,45 | ||||
| 2025-07-31 | 13F | Keeler THomas Management LLC | 79.894 | 28,12 | 1.585 | 29,39 | ||||
| 2025-08-07 | 13F | Parkside Financial Bank & Trust | 524 | 0,96 | 10 | 0,00 | ||||
| 2025-08-12 | 13F | Titleist Asset Management, Llc | 1.029.829 | 139,22 | 20.432 | 141,42 | ||||
| 2025-07-21 | 13F | Barrett & Company, Inc. | 4.163 | 125,03 | 83 | 127,78 | ||||
| 2025-08-11 | 13F | Private Advisor Group, LLC | 84.418 | -1,60 | 1.675 | -0,71 | ||||
| 2025-08-08 | 13F | Pnc Financial Services Group, Inc. | 71 | 0,00 | 1 | 0,00 | ||||
| 2025-07-16 | 13F | Rebalance, Llc | 11.274 | 224 | ||||||
| 2025-07-23 | 13F | Evexia Wealth Llc | 71.419 | 58,71 | 1.404 | 59,43 | ||||
| 2025-08-14 | 13F | Bank Of America Corp /de/ | 1.379.043 | 15,69 | 27.360 | 16,75 | ||||
| 2025-07-10 | 13F | Wealth Enhancement Advisory Services, Llc | 185.263 | 5,95 | 3.640 | 5,91 | ||||
| 2025-08-14 | 13F | AllSquare Wealth Management LLC | 22.266 | 0,69 | 442 | 1,61 | ||||
| 2025-07-17 | 13F | Chatham Capital Group, Inc. | 95.395 | 18,30 | 1.893 | 19,37 | ||||
| 2025-08-12 | 13F | Richmond Investment Services, LLC | 39.152 | 97,76 | 777 | 99,49 | ||||
| 2025-08-13 | 13F | Cerity Partners LLC | 23.884 | -0,37 | 474 | 0,42 | ||||
| 2025-08-08 | 13F | TD Capital Management LLC | 2.220 | 1,00 | 44 | 2,33 | ||||
| 2025-08-13 | 13F | Boston Family Office Llc | 99.546 | 24,46 | 2 | 0,00 | ||||
| 2025-08-14 | 13F | Goldman Sachs Group Inc | 0 | -100,00 | 0 | |||||
| 2025-08-19 | 13F | Asset Dedication, LLC | 3.384 | 13,63 | 67 | 15,52 | ||||
| 2025-07-21 | 13F | Crews Bank & Trust | 1.200 | 0,00 | 24 | 0,00 | ||||
| 2025-08-14 | 13F | Wells Fargo & Company/mn | 2.689.736 | 2,50 | 53.364 | 3,44 | ||||
| 2025-07-31 | 13F | Leavell Investment Management, Inc. | 13.725 | 272 | ||||||
| 2025-08-12 | 13F | Steward Partners Investment Advisory, Llc | 1.470 | 55,72 | 29 | 61,11 | ||||
| 2025-07-24 | 13F | Ronald Blue Trust, Inc. | 408 | 0,00 | 8 | 0,00 | ||||
| 2025-08-05 | 13F | Fullcircle Wealth Llc | 13.813 | 0,00 | 274 | 0,00 | ||||
| 2025-08-14 | 13F | Snowden Capital Advisors LLC | 427.386 | -0,25 | 8.479 | 0,66 | ||||
| 2025-05-02 | 13F | Whittier Trust Co | 0 | -100,00 | 0 | |||||
| 2025-08-12 | 13F | Associated Banc-corp | 50.546 | 15,98 | 1.003 | 17,06 | ||||
| 2025-07-01 | 13F | Confluence Investment Management Llc | 393.507 | -0,49 | 7.807 | 0,42 | ||||
| 2025-07-11 | 13F | Prosperity Planning, Inc. | 308 | 5,14 | ||||||
| 2025-05-12 | 13F | C2P Capital Advisory Group, LLC d.b.a. Prosperity Capital Advisors | 0 | -100,00 | 0 | -100,00 | ||||
| 2025-04-14 | 13F | Farther Finance Advisors, LLC | 0 | -100,00 | 0 | |||||
| 2025-07-08 | 13F | Atwood & Palmer Inc | 99.110 | -91,22 | 1.966 | -91,14 | ||||
| 2025-08-01 | 13F | James Investment Research Inc | 14.350 | 0,00 | 285 | 0,71 | ||||
| 2025-08-12 | 13F | LPL Financial LLC | 203.772 | -16,83 | 4.043 | -16,07 | ||||
| 2025-08-06 | 13F | AE Wealth Management LLC | 8 | 0 | ||||||
| 2025-08-08 | 13F | Cetera Investment Advisers | 253.494 | 4,51 | 5.029 | 5,47 | ||||
| 2025-07-30 | 13F | D.a. Davidson & Co. | 745.879 | 146,59 | 14.798 | 148,87 | ||||
| 2025-08-08 | 13F | Mv Capital Management, Inc. | 43.300 | 13,42 | 859 | 14,53 | ||||
| 2025-07-30 | 13F | Probity Advisors, Inc. | 435.300 | 4,57 | 8.636 | 5,54 | ||||
| 2025-07-21 | 13F | Cliftonlarsonallen Wealth Advisors, Llc | 82.180 | 111,74 | 1.630 | 113,63 | ||||
| 2025-08-08 | 13F | Thoroughbred Financial Services, Llc | 121.018 | -8,59 | 2 | 0,00 | ||||
| 2025-05-12 | 13F | Kohmann Bosshard Financial Services, LLC | 0 | -100,00 | 0 | |||||
| 2025-08-12 | 13F | Jaffetilchin Investment Partners, LLC | 13.369 | 0,98 | 265 | 1,92 | ||||
| 2025-08-08 | 13F | WASHINGTON TRUST Co | 0 | -100,00 | 0 | |||||
| 2025-08-12 | 13F | Coldstream Capital Management Inc | 14.739 | 0,00 | 292 | 1,04 | ||||
| 2025-07-17 | 13F | Janney Montgomery Scott LLC | 134.320 | 0,54 | 3 | 0,00 | ||||
| 2025-08-15 | 13F | Equitable Holdings, Inc. | 19.878 | 1,04 | 394 | 2,07 | ||||
| 2025-08-11 | 13F | HighTower Advisors, LLC | 145.363 | 1,79 | 2.884 | 2,74 | ||||
| 2025-07-16 | 13F | Signaturefd, Llc | 39.619 | 106,01 | 786 | 107,94 | ||||
| 2025-07-21 | 13F | Exchange Capital Management, Inc. | 16.239 | 2,26 | 322 | 3,21 | ||||
| 2025-07-24 | 13F | Us Bancorp \de\ | 3.360 | 61,54 | 67 | 65,00 | ||||
| 2025-08-14 | 13F | Raymond James Financial Inc | 402.086 | -19,20 | 7.977 | -18,46 | ||||
| 2025-08-14 | 13F | Colony Group, LLC | 32.307 | 10,15 | 641 | 11,11 | ||||
| 2025-08-12 | 13F | Jacobi Capital Management LLC | 19.219 | 6,30 | 381 | 7,32 | ||||
| 2025-07-31 | 13F | United Community Bank | 13.060 | 0,00 | 259 | 1,17 | ||||
| 2025-07-11 | 13F | Shelton Wealth Management, Llc | 385.684 | 4,88 | 7.652 | 5,84 | ||||
| 2025-07-30 | 13F | DecisionMap Wealth Management, LLC | 17.228 | 21,38 | 342 | 22,22 | ||||
| 2025-07-15 | 13F | Garrett Investment Advisors LLC | 13.602 | 0,56 | 270 | 1,51 | ||||
| 2025-07-31 | 13F | Cambridge Investment Research Advisors, Inc. | 11.958 | -28,67 | 0 | |||||
| 2025-08-13 | 13F | Northwestern Mutual Wealth Management Co | 83.733 | 11,59 | 1.661 | 12,61 |