Grundlæggende statistik
| Institutionelle ejere | 118 total, 118 long only, 0 short only, 0 long/short - change of 55,26% MRQ |
| Gennemsnitlig porteføljeallokering | 0.4785 % - change of 19,25% MRQ |
| Institutionelle aktier (lange) | 10.221.747 (ex 13D/G) - change of 6,03MM shares 144,03% MRQ |
| Institutionel værdi (lang) | $ 330.115 USD ($1000) |
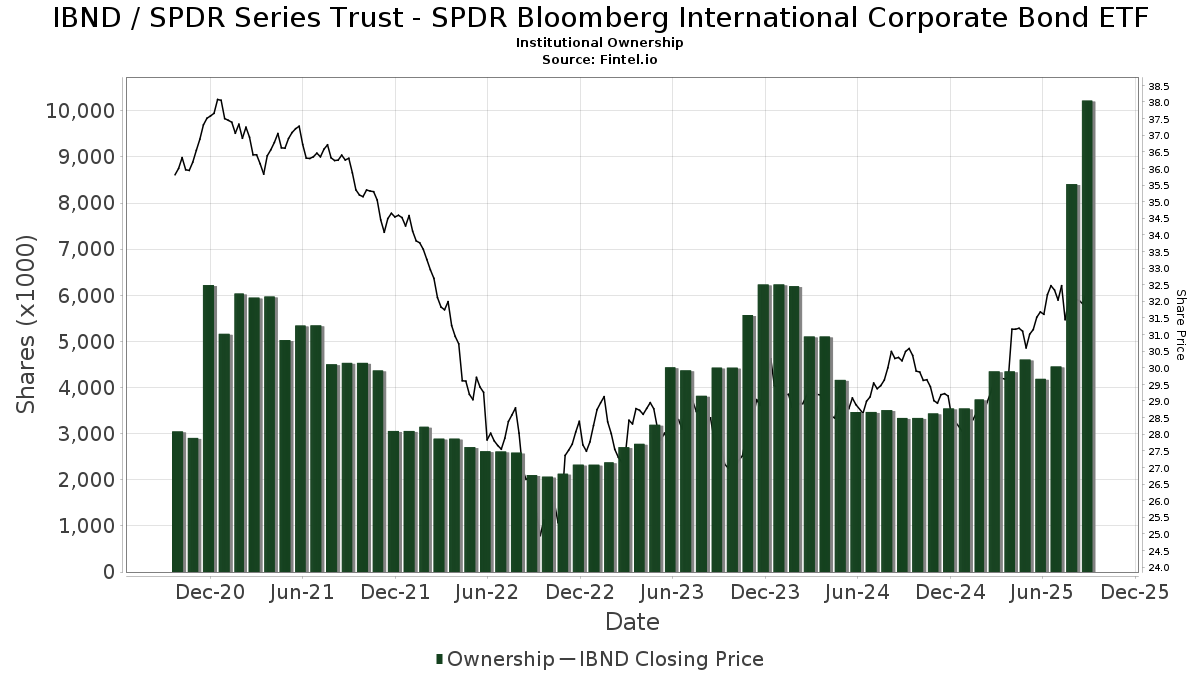
Institutionelt ejerskab og aktionærer
SPDR Series Trust - SPDR Bloomberg International Corporate Bond ETF (US:IBND) har 118 institutionelle ejere og aktionærer, der har indsendt 13D/G- eller 13F-formularer til Securities Exchange Commission (SEC). Disse institutioner har i alt 10,221,747 aktier. Største aktionærer omfatter Mainstay Capital Management Llc /adv, Checchi Capital Advisers, LLC, Lodestar Private Asset Management Llc, Redhawk Wealth Advisors, Inc., Cambria Investment Management, L.P., Leuthold Group, Llc, GAL - SPDR SSGA Global Allocation ETF, NewSquare Capital LLC, Ameritas Investment Partners, Inc., and Lam Group, Inc. .
SPDR Series Trust - SPDR Bloomberg International Corporate Bond ETF (ARCA:IBND) institutionel ejerskabsstruktur viser aktuelle positioner i virksomheden efter institutioner og fonde, samt seneste ændringer i positionsstørrelse. Større aktionærer kan omfatte individuelle investorer, investeringsforeninger, hedgefonde eller institutioner. Skema 13D angiver, at investoren besidder (eller besidder) mere end 5 % af virksomheden og har til hensigt (eller har til hensigt at) aktivt at forfølge en ændring i forretningsstrategi. Skema 13G indikerer en passiv investering på over 5%.
The share price as of September 15, 2025 is 32,46 / share. Previously, on September 16, 2024, the share price was 30,59 / share. This represents an increase of 6,11% over that period.
Fondens stemningsscore
Fund Sentiment Score (fka Ownership Accumulation Score) finder de aktier, der bliver mest købt af fonde. Det er resultatet af en sofistikeret, multi-faktor kvantitativ model, der identificerer virksomheder med de højeste niveauer af institutionel akkumulering. Scoringsmodellen bruger en kombination af den samlede stigning i oplyste ejere, ændringerne i porteføljeallokeringer i disse ejere og andre målinger. Tallet går fra 0 til 100, hvor højere tal indikerer et højere niveau af akkumulering for sine jævnaldrende, og 50 er gennemsnittet.
Opdateringsfrekvens: Dagligt
Se Ownership Explorer, som giver en liste over højest rangerende virksomheder.
Institutionel Put/Call-forhold
Ud over at indberette standardaktie- og gældsudstedelser skal institutter med mere end 100 mill. aktiver under forvaltning også oplyse deres put- og call-optionsbeholdninger. Da salgsoptioner generelt indikerer negativ stemning, og købsoptioner indikerer positiv stemning, kan vi få en fornemmelse af den overordnede institutionelle stemning ved at plotte forholdet mellem put og kald. Diagrammet til højre viser det historiske put/call-forhold for dette instrument.
Brug af Put/Call Ratio som en indikator for investorernes stemning overvinder en af de vigtigste mangler ved at bruge totalt institutionelt ejerskab, som er, at en betydelig mængde af aktiver under forvaltning investeres passivt for at spore indekser. Passivt forvaltede fonde køber typisk ikke optioner, så indikatoren for put/call-forholdet følger mere nøje følelsen af aktivt forvaltede fonde.
13F og NPORT arkivering
Detaljer om 13F-arkivering er gratis. Detaljer om NP-ansøgninger kræver et premium-medlemskab. Grønne rækker angiver nye positioner. Røde rækker angiver lukkede positioner. Klik på linket ikon for at se den fulde transaktionshistorik.
Opgrader
for at låse premium-data op og eksportere til Excel ![]() .
.
| Fil dato | Kilde | Investor | Type | Gennemsnitlig pris (Øst) |
Aktier | Δ Aktier (%) |
Rapporteret Værdi ($1000) |
Δ Værdi (%) |
Port Alloc (%) |
|
|---|---|---|---|---|---|---|---|---|---|---|
| 2025-08-13 | 13F | Capital Analysts, Inc. | 971 | 0,00 | 0 | |||||
| 2025-08-06 | 13F | Prospera Financial Services Inc | 95.347 | 3.107 | ||||||
| 2025-08-18 | 13F | Front Row Advisors LLC | 400 | 0,00 | 13 | 18,18 | ||||
| 2025-07-30 | 13F | Roman Butler Fullerton & Co | 8.385 | 271 | ||||||
| 2025-05-09 | 13F | Commonwealth Equity Services, Llc | 0 | -100,00 | 0 | |||||
| 2025-05-16 | 13F | Coppell Advisory Solutions LLC | 0 | -100,00 | 0 | -100,00 | ||||
| 2025-08-12 | 13F | Wayfinding Financial, LLC | 0 | -100,00 | 0 | |||||
| 2025-07-17 | 13F | Tempus Wealth Planning, LLC | 34.835 | 1,36 | 1.135 | 12,04 | ||||
| 2025-08-13 | 13F | RPg Family Wealth Advisory, LLC | 10.626 | -5,45 | 346 | 4,53 | ||||
| 2025-07-30 | 13F | Insight Advisors, LLC/ PA | 39.171 | -0,65 | 1.277 | 9,81 | ||||
| 2025-06-27 | NP | TRTY - Cambria Trinity ETF | 69.280 | 2.161 | ||||||
| 2025-07-21 | 13F | DHJJ Financial Advisors, Ltd. | 10 | 0 | ||||||
| 2025-08-08 | 13F | Davies Financial Advisors, Inc. | 16.929 | -11,03 | 552 | -1,78 | ||||
| 2025-07-24 | 13F | VanderPol Investments L.L.C. | 38.865 | 1.267 | ||||||
| 2025-08-14 | 13F | Jane Street Group, Llc | 148.387 | 160,48 | 4.836 | 187,97 | ||||
| 2025-08-05 | 13F | NewSquare Capital LLC | 235.831 | 7.686 | ||||||
| 2025-08-12 | 13F | Steward Partners Investment Advisory, Llc | 23.192 | 71,45 | 756 | 89,70 | ||||
| 2025-08-19 | 13F | Newbridge Financial Services Group, Inc. | 62 | 0,00 | 2 | 100,00 | ||||
| 2025-07-17 | 13F | Sound Income Strategies, LLC | 5.921 | 65.688,89 | 193 | |||||
| 2025-08-11 | 13F | Nomura Asset Management Co Ltd | 22.351 | 69,60 | 728 | 87,63 | ||||
| 2025-07-31 | 13F | TSA Wealth Managment LLC | 6.302 | 205 | ||||||
| 2025-08-04 | 13F | Integrity Alliance, Llc. | 10.074 | 328 | ||||||
| 2025-08-01 | 13F | Austin Private Wealth, LLC | 6.534 | 213 | ||||||
| 2025-08-14 | 13F | Stifel Financial Corp | 6.874 | 224 | ||||||
| 2025-08-01 | 13F | Envestnet Asset Management Inc | 66.231 | 175,02 | 2.158 | 203,94 | ||||
| 2025-08-05 | 13F | GPS Wealth Strategies Group, LLC | 502 | 16 | ||||||
| 2025-08-14 | 13F | Destination Wealth Management | 8.531 | 278 | ||||||
| 2025-08-14 | 13F | Raymond James Financial Inc | 38.105 | 1.242 | ||||||
| 2025-08-28 | NP | TFAFX - Tactical Growth Allocation Fund Class I | 10.083 | 24,48 | 329 | 32,79 | ||||
| 2025-07-24 | 13F | IFP Advisors, Inc | 2.702 | 7.405,56 | 88 | 8.700,00 | ||||
| 2025-05-12 | 13F | Citigroup Inc | 0 | -100,00 | 0 | |||||
| 2025-08-26 | NP | LCR - Leuthold Core ETF | 22.920 | -7,12 | 747 | 2,61 | ||||
| 2025-08-05 | 13F | Milestone Asset Management, Llc | 15.772 | 514 | ||||||
| 2025-08-13 | 13F | First Trust Advisors Lp | 54.007 | 1.760 | ||||||
| 2025-08-14 | 13F/A | Bank Julius Baer & Co. Ltd, Zurich | 38.911 | 20,49 | 1.268 | 17,84 | ||||
| 2025-08-13 | 13F | Vance Wealth, Inc. | 6.387 | 208 | ||||||
| 2025-04-22 | 13F | Castleview Partners, Llc | 0 | -100,00 | 0 | -100,00 | ||||
| 2025-08-01 | 13F | Brookwood Investment Group LLC | 13.851 | 451 | ||||||
| 2025-08-12 | 13F | Jpmorgan Chase & Co | 46.327 | -6,40 | 1.510 | 3,43 | ||||
| 2025-08-14 | 13F | Goldman Sachs Group Inc | 47.625 | 1.552 | ||||||
| 2025-08-14 | 13F | Federation des caisses Desjardins du Quebec | 225 | 0,00 | 7 | 16,67 | ||||
| 2025-05-13 | 13F | Bank Of Montreal /can/ | 0 | -100,00 | 0 | |||||
| 2025-07-21 | 13F | Ameritas Advisory Services, LLC | 6.141 | 200 | ||||||
| 2025-08-12 | 13F | Ameritas Investment Partners, Inc. | 234.433 | 3,20 | 7.640 | 14,05 | ||||
| 2025-05-08 | 13F | Plante Moran Financial Advisors, LLC | 0 | -100,00 | 0 | |||||
| 2025-04-17 | 13F | Janney Montgomery Scott LLC | 0 | -100,00 | 0 | |||||
| 2025-07-21 | 13F | Synergy Financial Management, LLC | 117.248 | 3.821 | ||||||
| 2025-08-14 | 13F | UBS Group AG | 12.032 | 60,36 | 392 | 77,38 | ||||
| 2025-08-28 | NP | NDOW - Anydrus Advantage ETF | 25.970 | 18,41 | 846 | 30,96 | ||||
| 2025-08-04 | 13F | AMG National Trust Bank | 13.527 | 31,55 | 441 | 45,21 | ||||
| 2025-08-14 | 13F | Transamerica Financial Advisors, Inc. | 27.146 | 20.008,15 | 885 | |||||
| 2025-07-09 | 13F | Breakwater Investment Management | 248 | 0,00 | 8 | 14,29 | ||||
| 2025-07-16 | 13F | Cambridge Advisors Inc. | 10.400 | 0,00 | 339 | 10,46 | ||||
| 2025-08-11 | 13F | HighTower Advisors, LLC | 61.653 | 774,26 | 2.009 | 870,53 | ||||
| 2025-08-13 | 13F | Rsm Us Wealth Management Llc | 6.326 | 206 | ||||||
| 2025-07-31 | 13F | Brighton Jones Llc | 9.151 | 298 | ||||||
| 2025-08-07 | 13F | Allworth Financial LP | 1.342 | 67.000,00 | 44 | |||||
| 2025-07-28 | 13F | Harbour Investments, Inc. | 458 | 11,17 | 15 | 16,67 | ||||
| 2025-08-13 | 13F | Leuthold Group, Llc | 256.592 | 86,91 | 8.362 | 106,57 | ||||
| 2025-08-15 | 13F | Tower Research Capital LLC (TRC) | 0 | -100,00 | 0 | |||||
| 2025-07-31 | 13F | Glass Jacobson Investment Advisors llc | 0 | -100,00 | 0 | -100,00 | ||||
| 2025-08-13 | 13F | Guggenheim Capital Llc | 83.171 | 0,13 | 2.711 | 10,66 | ||||
| 2025-08-12 | 13F | Proequities, Inc. | 0 | 0 | ||||||
| 2025-06-27 | NP | GMOM - Cambria Global Momentum ETF | 198.563 | 6.193 | ||||||
| 2025-08-08 | 13F | Foundations Investment Advisors, LLC | 74.608 | 2.431 | ||||||
| 2025-07-09 | 13F | Client First Investment Management LLC | 24.513 | 799 | ||||||
| 2025-07-14 | 13F | AdvisorNet Financial, Inc | 2.185 | 0,00 | 71 | 10,94 | ||||
| 2025-08-18 | 13F | N.E.W. Advisory Services LLC | 0 | -100,00 | 0 | |||||
| 2025-08-12 | 13F | Pathstone Holdings, LLC | 11.010 | 359 | ||||||
| 2025-08-13 | 13F | Cambria Investment Management, L.P. | 267.843 | 8.712 | ||||||
| 2025-04-22 | 13F/A | NorthRock Partners, LLC | 0 | -100,00 | 0 | -100,00 | ||||
| 2025-07-21 | 13F | Pflug Koory, LLC | 163 | 0,00 | 5 | 25,00 | ||||
| 2025-09-04 | 13F/A | Advisor Group Holdings, Inc. | 27.330 | 65,21 | 891 | 82,75 | ||||
| 2025-07-24 | 13F | Mainstay Capital Management Llc /adv | 3.413.828 | 111.257 | ||||||
| 2025-08-26 | NP | FIRST TRUST VARIABLE INSURANCE TRUST - First Trust Dorsey Wright Tactical Core Portfolio Class I This fund is a listed as child fund of First Trust Advisors Lp and if that institution has disclosed ownership in this security, then these positions will not be double counted when calculating total shares and total value | 54.007 | 1.760 | ||||||
| 2025-08-13 | 13F | Baird Financial Group, Inc. | 24.071 | 784 | ||||||
| 2025-08-26 | NP | LCORX - Leuthold Core Investment Fund Retail Class | 97.222 | 3.168 | ||||||
| 2025-08-08 | 13F | Kingsview Wealth Management, LLC | 7.295 | 238 | ||||||
| 2025-08-15 | 13F | Urban Financial Advisory Corp | 891 | 0,56 | 29 | 11,54 | ||||
| 2025-08-08 | 13F | Cetera Investment Advisers | 11.998 | -5,83 | 391 | 4,27 | ||||
| 2025-05-02 | 13F | Transcendent Capital Group LLC | 0 | -100,00 | 0 | |||||
| 2025-08-14 | 13F | Bank Of America Corp /de/ | 128.864 | -40,45 | 4.200 | -34,20 | ||||
| 2025-08-26 | NP | GLBIX - Leuthold Global Fund Institutional Class | 4.949 | 161 | ||||||
| 2025-08-11 | 13F | Sykon Capital Llc | 170.004 | 336,08 | 5.540 | 382,16 | ||||
| 2025-08-12 | 13F | LPL Financial LLC | 144.021 | 73,47 | 4.694 | 91,71 | ||||
| 2025-08-14 | 13F | Great Valley Advisor Group, Inc. | 83.316 | 2.715 | ||||||
| 2025-08-14 | 13F | State Street Corp | 181.850 | -1,22 | 5.926 | 9,15 | ||||
| 2025-08-11 | 13F | Independent Advisor Alliance | 7.472 | 244 | ||||||
| 2025-07-16 | 13F | MJT & Associates Financial Advisory Group, Inc. | 0 | -100,00 | 0 | |||||
| 2025-07-31 | 13F | Hobart Private Capital, LLC | 141.731 | 4.619 | ||||||
| 2025-08-13 | 13F | Beacon Pointe Advisors, LLC | 20.401 | 3,16 | 665 | 13,89 | ||||
| 2025-04-16 | 13F | BTS Asset Management, Inc. | 0 | -100,00 | 0 | |||||
| 2025-08-13 | 13F | F/M Investments LLC | 35.676 | 0,00 | 1.163 | 10,67 | ||||
| 2025-08-12 | 13F | MAI Capital Management | 4.743 | -4,03 | 155 | 6,21 | ||||
| 2025-08-04 | 13F | Haven Private, LLC | 26.289 | 25,47 | 857 | 38,74 | ||||
| 2025-08-07 | 13F | Rathbone Brothers plc | 139.938 | 26,84 | 4.561 | 40,18 | ||||
| 2025-08-28 | NP | GAL - SPDR SSGA Global Allocation ETF This fund is a listed as child fund of State Street Corp and if that institution has disclosed ownership in this security, then these positions will not be double counted when calculating total shares and total value | 242.543 | -2,11 | 7.904 | 8,19 | ||||
| 2025-07-03 | 13F | Lam Group, Inc. | 228.190 | 70,38 | 7.437 | 88,30 | ||||
| 2025-07-30 | 13F | Patten Group, Inc. | 10.071 | 328 | ||||||
| 2025-08-07 | 13F | Montag A & Associates Inc | 1.608 | 0,00 | 52 | 10,64 | ||||
| 2025-04-23 | 13F | Creative Financial Designs Inc /adv | 0 | -100,00 | 0 | |||||
| 2025-07-15 | 13F | Retireful, LLC | 25.970 | 846 | ||||||
| 2025-08-14 | 13F | Royal Bank Of Canada | 133.165 | 48,69 | 4.340 | 64,33 | ||||
| 2025-05-14 | 13F | Kestra Advisory Services, LLC | 0 | -100,00 | 0 | -100,00 | ||||
| 2025-08-14 | 13F | Sunbelt Securities, Inc. | 494 | 0,00 | 14 | 0,00 | ||||
| 2025-08-19 | 13F | Cape Investment Advisory, Inc. | 50 | 0,00 | 2 | 0,00 | ||||
| 2025-07-25 | 13F | Lodestar Private Asset Management Llc | 409.110 | 17,02 | 13.333 | 29,31 | ||||
| 2025-08-15 | 13F | Morgan Stanley | 201.422 | 29,02 | 6.564 | 42,60 | ||||
| 2025-08-19 | 13F | Advisory Services Network, LLC | 11.706 | 369 | ||||||
| 2025-07-21 | 13F | Financial Services Advisory Inc | 9.881 | 322 | ||||||
| 2025-08-06 | 13F | AE Wealth Management LLC | 61.433 | 40,79 | 2.002 | 55,68 | ||||
| 2025-08-13 | 13F | Congress Wealth Management LLC / DE / | 9.548 | -1,88 | 311 | 8,74 | ||||
| 2025-08-14 | 13F | Wells Fargo & Company/mn | 129.398 | 704,81 | 4.217 | 789,66 | ||||
| 2025-08-12 | 13F | Global Retirement Partners, LLC | 28.434 | 927 | ||||||
| 2025-08-01 | 13F | Red Lighthouse Investment Management, Llc | 3.731 | -49,16 | 122 | -43,19 | ||||
| 2025-08-18 | 13F/A | National Bank Of Canada /fi/ | 460 | 0,00 | 15 | 7,69 | ||||
| 2025-07-18 | 13F | PFG Investments, LLC | 13.376 | 436 | ||||||
| 2025-08-08 | 13F | Omega Financial Group, LLC | 16.391 | -15,08 | 534 | -6,15 | ||||
| 2025-05-15 | 13F | Citadel Advisors Llc | 0 | -100,00 | 0 | |||||
| 2025-07-08 | 13F | Strategic Advocates LLC | 12.020 | -0,77 | 392 | 9,52 | ||||
| 2025-08-14 | 13F | GWM Advisors LLC | 4.581 | -48,41 | 149 | -42,91 | ||||
| 2025-07-10 | 13F | Redhawk Wealth Advisors, Inc. | 344.874 | 11.239 | ||||||
| 2025-07-31 | 13F | Cambridge Investment Research Advisors, Inc. | 51.011 | 151,31 | 2 | |||||
| 2025-07-30 | 13F | D.a. Davidson & Co. | 16.476 | 537 | ||||||
| 2025-08-18 | 13F | Geneos Wealth Management Inc. | 1.500 | 0,00 | 49 | 9,09 | ||||
| 2025-07-22 | 13F | Checchi Capital Advisers, LLC | 649.084 | -42,87 | 21.154 | -36,86 | ||||
| 2025-05-02 | 13F | Capital A Wealth Management, LLC | 0 | -100,00 | 0 | |||||
| 2025-07-29 | 13F | International Assets Investment Management, Llc | 7.160 | 233 | ||||||
| 2025-08-08 | 13F | Good Life Advisors, LLC | 61.061 | 1.990 | ||||||
| 2025-08-13 | 13F | Idaho Trust Bank | 155.668 | 19,13 | 5.073 | 31,70 | ||||
| 2025-08-13 | 13F | Jones Financial Companies Lllp | 840 | -26,51 | 27 | -18,18 | ||||
| 2025-08-14 | 13F | Mml Investors Services, Llc | 25.790 | 1 | ||||||
| 2025-08-14 | 13F | Fmr Llc | 31 | 210,00 | 1 | |||||
| 2025-08-28 | NP | TFAZX - TFA Tactical Income Fund Class I | 25.931 | -11,78 | 845 | -6,01 | ||||
| 2025-08-14 | 13F | Obsido Oy | 113.055 | -3,73 | 3.684 | 6,38 | ||||
| 2025-08-07 | 13F | LFA - Lugano Financial Advisors SA | 124.430 | 4.038 | ||||||
| 2025-05-14 | 13F | Flow Traders U.s. Llc | 0 | -100,00 | 0 | |||||
| 2025-08-13 | 13F | Fisher Asset Management, LLC | 46.234 | 0,08 | 1.507 | 10,57 | ||||
| 2025-08-14 | 13F | Gerber Kawasaki Wealth & Investment Management | 18.425 | 600 |