Grundlæggende statistik
| Institutionelle ejere | 86 total, 86 long only, 0 short only, 0 long/short - change of -13,13% MRQ |
| Gennemsnitlig porteføljeallokering | 0.4433 % - change of -0,26% MRQ |
| Institutionelle aktier (lange) | 14.399.568 (ex 13D/G) - change of -0,14MM shares -0,93% MRQ |
| Institutionel værdi (lang) | $ 397.500 USD ($1000) |
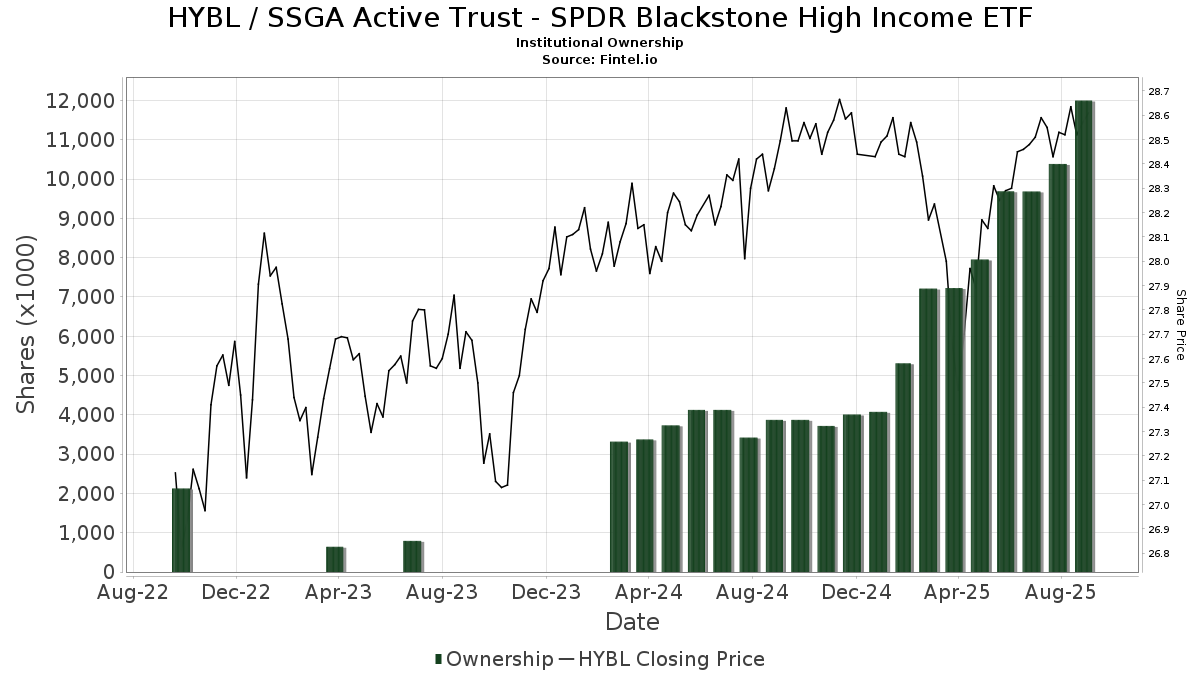
Institutionelt ejerskab og aktionærer
SSGA Active Trust - State Street Blackstone High Income ETF (US:HYBL) har 86 institutionelle ejere og aktionærer, der har indsendt 13D/G- eller 13F-formularer til Securities Exchange Commission (SEC). Disse institutioner har i alt 14,399,568 aktier. Største aktionærer omfatter ZEGA Investments, LLC, Concord Wealth Partners, Morgan Stanley, Concord Asset Management, LLC/VA, UBS Group AG, Raymond James Financial Inc, LPL Financial LLC, Luken Investment Analytics, LLC, Bank Of America Corp /de/, and Wells Fargo & Company/mn .
SSGA Active Trust - State Street Blackstone High Income ETF (BATS:HYBL) institutionel ejerskabsstruktur viser aktuelle positioner i virksomheden efter institutioner og fonde, samt seneste ændringer i positionsstørrelse. Større aktionærer kan omfatte individuelle investorer, investeringsforeninger, hedgefonde eller institutioner. Skema 13D angiver, at investoren besidder (eller besidder) mere end 5 % af virksomheden og har til hensigt (eller har til hensigt at) aktivt at forfølge en ændring i forretningsstrategi. Skema 13G indikerer en passiv investering på over 5%.
The share price as of March 27, 2026 is 27,61 / share. Previously, on March 31, 2025, the share price was 28,12 / share. This represents a decline of 1,81% over that period.
Fondens stemningsscore
Fund Sentiment Score (fka Ownership Accumulation Score) finder de aktier, der bliver mest købt af fonde. Det er resultatet af en sofistikeret, multi-faktor kvantitativ model, der identificerer virksomheder med de højeste niveauer af institutionel akkumulering. Scoringsmodellen bruger en kombination af den samlede stigning i oplyste ejere, ændringerne i porteføljeallokeringer i disse ejere og andre målinger. Tallet går fra 0 til 100, hvor højere tal indikerer et højere niveau af akkumulering for sine jævnaldrende, og 50 er gennemsnittet.
Opdateringsfrekvens: Dagligt
Se Ownership Explorer, som giver en liste over højest rangerende virksomheder.
AI+ Ask Fintel’s AI assistant about SSGA Active Trust - State Street Blackstone High Income ETF.
Select a question to share a public post with an AI-crafted answer.
Thinking of good questions…
Institutionel Put/Call-forhold
Ud over at indberette standardaktie- og gældsudstedelser skal institutter med mere end 100 mill. aktiver under forvaltning også oplyse deres put- og call-optionsbeholdninger. Da salgsoptioner generelt indikerer negativ stemning, og købsoptioner indikerer positiv stemning, kan vi få en fornemmelse af den overordnede institutionelle stemning ved at plotte forholdet mellem put og kald. Diagrammet til højre viser det historiske put/call-forhold for dette instrument.
Brug af Put/Call Ratio som en indikator for investorernes stemning overvinder en af de vigtigste mangler ved at bruge totalt institutionelt ejerskab, som er, at en betydelig mængde af aktiver under forvaltning investeres passivt for at spore indekser. Passivt forvaltede fonde køber typisk ikke optioner, så indikatoren for put/call-forholdet følger mere nøje følelsen af aktivt forvaltede fonde.
13F og NPORT arkivering
Detaljer om 13F-arkivering er gratis. Detaljer om NP-ansøgninger kræver et premium-medlemskab. Grønne rækker angiver nye positioner. Røde rækker angiver lukkede positioner. Klik på linket ikon for at se den fulde transaktionshistorik.
Opgrader
for at låse premium-data op og eksportere til Excel ![]() .
.
| Fil dato | Kilde | Investor | Type | Gennemsnitlig pris (Øst) |
Aktier | Δ Aktier (%) |
Rapporteret Værdi ($1000) |
Δ Værdi (%) |
Port Alloc (%) |
|
|---|---|---|---|---|---|---|---|---|---|---|
| 2026-02-12 | 13F | Jane Street Group, Llc | 65.891 | -52,30 | 1.874 | -52,67 | ||||
| 2026-02-11 | 13F | LPL Financial LLC | 792.466 | -0,44 | 22.538 | -1,17 | ||||
| 2026-02-17 | 13F | Wealth Watch Advisors, INC | 32.907 | 354,39 | 936 | 351,69 | ||||
| 2026-01-09 | 13F | Marshall Financial Group LLC | 16.040 | 30,65 | 456 | 29,91 | ||||
| 2026-02-05 | 13F | Cambridge Investment Research Advisors, Inc. | 246.907 | 58,49 | 7 | 75,00 | ||||
| 2026-01-29 | 13F | UBS Group AG | 997.998 | 5,47 | 28.383 | 4,70 | ||||
| 2026-01-29 | 13F | Concord Asset Management, LLC/VA | 1.076.804 | 3,62 | 30.624 | 2,86 | ||||
| 2026-02-17 | 13F | Raymond James Financial Inc | 940.910 | -0,85 | 26.759 | -1,57 | ||||
| 2026-02-10 | 13F | Envestnet Asset Management Inc | 51.900 | -90,93 | 1.476 | -90,99 | ||||
| 2026-02-13 | 13F | Aptus Capital Advisors, LLC | 0 | -100,00 | 0 | |||||
| 2026-02-06 | 13F | HighTower Advisors, LLC | 16.804 | 0,83 | 478 | 0,00 | ||||
| 2026-02-13 | 13F | Fairman Group, LLC | 5.275 | 0,00 | 150 | -0,66 | ||||
| 2026-01-15 | 13F | Archford Capital Strategies, LLC | 7.794 | 0,00 | 222 | -0,90 | ||||
| 2026-01-21 | 13F | Woodmont Investment Counsel Llc | 15.556 | 99,46 | 442 | 98,21 | ||||
| 2026-02-11 | 13F | Eldridge Investment Advisors, Inc. | 66.392 | -42,71 | 1.888 | -43,13 | ||||
| 2026-01-12 | 13F | Thompson Davis & Co., Inc. | 44.027 | 3,68 | 1.252 | 2,96 | ||||
| 2026-01-20 | 13F | Sheets Smith Wealth Management | 29.207 | 2,15 | 831 | 1,34 | ||||
| 2026-02-17 | 13F | Bank Of America Corp /de/ | 558.508 | 43,70 | 15.884 | 42,64 | ||||
| 2026-01-22 | 13F | Glass Jacobson Investment Advisors llc | 9.169 | 261 | ||||||
| 2026-02-17 | 13F | Old Mission Capital Llc | 26.610 | 206,85 | 757 | 204,84 | ||||
| 2026-01-23 | 13F | Hedeker Wealth, LLC | 210.468 | -12,98 | 5.986 | -13,62 | ||||
| 2026-01-05 | 13F | Park Avenue Securities Llc | 20.963 | -52,73 | 1 | -100,00 | ||||
| 2026-02-09 | 13F | Atlantic Trust, LLC | 1.373 | -57,33 | 39 | -57,61 | ||||
| 2026-02-17 | 13F | VestGen Advisors, LLC | 7.757 | -49,86 | 221 | -50,34 | ||||
| 2026-01-23 | 13F | Farther Finance Advisors, LLC | 1.215 | 35 | ||||||
| 2026-02-17 | 13F | Gotham Asset Management, LLC | 34.192 | 168,03 | 972 | 166,30 | ||||
| 2026-02-06 | 13F | Authentikos Wealth Advisory, LLC | 14.964 | 12,42 | 426 | 11,55 | ||||
| 2026-02-06 | 13F | Redmont Wealth Advisors Llc | 8.850 | 4,59 | 252 | 3,72 | ||||
| 2026-02-17 | 13F | Coppell Advisory Solutions LLC | 132.557 | 9,08 | 3.769 | 8,18 | ||||
| 2026-02-17 | 13F | Hanover Advisors Inc | 21.522 | -51,81 | 612 | -52,15 | ||||
| 2026-02-17 | 13F | Advisory Services Network, LLC | 7.908 | -79,25 | 225 | -79,47 | ||||
| 2026-02-17 | 13F | Creative Planning | 29.069 | -38,36 | 827 | -38,86 | ||||
| 2026-02-17 | 13F | Toronto Dominion Bank | 0 | -100,00 | 0 | |||||
| 2026-02-09 | 13F | Allen Capital Group, LLC | 7.303 | 0,00 | 208 | -0,96 | ||||
| 2026-02-05 | 13F | ORBA Wealth Advisors, L.L.C. | 73.778 | 15,33 | 2.098 | 14,52 | ||||
| 2026-01-26 | 13F | Cwm, Llc | 115.217 | -9,69 | 3 | 0,00 | ||||
| 2026-02-13 | 13F | Morgan Stanley | 1.085.063 | 79,57 | 30.859 | 78,26 | ||||
| 2026-02-17 | 13F | Pinnacle Family Advisors, LLC | 7.343 | 209 | ||||||
| 2026-02-18 | 13F | GWM Advisors LLC | 26.706 | 21,05 | 760 | 20,09 | ||||
| 2026-01-27 | 13F | Portfolio Strategies, Inc. | 19.988 | 2,53 | 568 | 1,79 | ||||
| 2026-02-11 | 13F | OneAscent Family Office, LLC | 52.448 | 60,10 | 1.492 | 58,96 | ||||
| 2026-02-04 | 13F | Ameritas Advisory Services, LLC | 0 | -100,00 | 0 | |||||
| 2026-02-13 | 13F | Stifel Financial Corp | 37.647 | -1,59 | 1.071 | -2,37 | ||||
| 2026-02-06 | 13F | Larson Financial Group LLC | 500 | 0,00 | 14 | 0,00 | ||||
| 2026-01-29 | 13F | Comerica Bank | 13.062 | -9,92 | 371 | -10,60 | ||||
| 2026-01-29 | 13F | Spurstone Advisory Services, LLC | 4 | 0,00 | 0 | |||||
| 2026-02-12 | 13F | Insigneo Advisory Services, Llc | 7.307 | 0,00 | 208 | -0,96 | ||||
| 2026-02-06 | 13F/A | Rathbone Brothers plc | 436.000 | 0,00 | 12.400 | -0,74 | ||||
| 2026-02-13 | 13F | Wells Fargo & Company/mn | 509.088 | 33,82 | 14.478 | 32,84 | ||||
| 2026-01-09 | 13F | Tactive Advisors, LLC | 0 | -100,00 | 0 | |||||
| 2026-02-11 | 13F | OneAscent Wealth Management LLC | 160.175 | 5,07 | 4.555 | 4,31 | ||||
| 2025-11-14 | 13F | Luminist Capital LLC | 0 | -100,00 | 0 | |||||
| 2026-02-11 | 13F | Gateway Wealth Partners, LLC | 8.752 | 6,86 | 249 | 5,98 | ||||
| 2026-01-12 | 13F | Optivise Advisory Services LLC | 0 | -100,00 | 0 | |||||
| 2026-02-06 | 13F | GPS Wealth Strategies Group, LLC | 0 | -100,00 | 0 | |||||
| 2026-01-15 | 13F | Saxony Capital Management, LLC | 31.107 | 885 | ||||||
| 2026-02-13 | 13F | Inspire Advisors, LLC | 158.169 | -11,15 | 4.498 | -11,80 | ||||
| 2026-01-16 | 13F | BayBridge Capital Group, LLC | 15.285 | 2,04 | 435 | 1,17 | ||||
| 2026-01-29 | 13F | Concord Wealth Partners | 1.140.550 | 4,15 | 32.437 | 3,38 | ||||
| 2026-02-17 | 13F | Jones Financial Companies Lllp | 5.296 | 27,15 | 151 | 26,05 | ||||
| 2026-02-02 | 13F | Breakwater Investment Management | 695 | 20 | ||||||
| 2026-01-26 | 13F | Private Trust Co Na | 0 | -100,00 | 0 | |||||
| 2026-01-26 | 13F | AE Wealth Management LLC | 1.278 | -2,07 | 36 | -2,70 | ||||
| 2026-01-27 | 13F | ZEGA Investments, LLC | 1.685.210 | 31,69 | 47.927 | 30,73 | ||||
| 2026-02-04 | 13F | Pensionmark Financial Group, Llc | 37.405 | -62,95 | 675 | -76,69 | ||||
| 2026-02-23 | 13F | Virtu Financial LLC | 0 | -100,00 | 0 | |||||
| 2025-11-05 | 13F | Fullcircle Wealth Llc | 13.583 | 0,00 | 385 | -0,52 | ||||
| 2026-02-03 | 13F | SBI Securities Co., Ltd. | 194 | -70,61 | 6 | -72,22 | ||||
| 2026-02-14 | 13F | Rockefeller Capital Management L.P. | 233.006 | 4,05 | 6.627 | 3,29 | ||||
| 2026-02-17 | 13F | Equitable Holdings, Inc. | 189.711 | 7,23 | 5.395 | 6,45 | ||||
| 2026-01-12 | 13F | Auour Investments LLC | 77.250 | 12,75 | 2.197 | 11,98 | ||||
| 2026-02-06 | 13F | Envestnet Portfolio Solutions, Inc. | 0 | -100,00 | 0 | |||||
| 2026-02-02 | 13F | Truist Financial Corp | 14.058 | 34,73 | 400 | 33,89 | ||||
| 2026-02-12 | 13F | Steward Partners Investment Advisory, Llc | 0 | -100,00 | 0 | |||||
| 2026-01-21 | 13F | Sound Income Strategies, LLC | 350 | 10 | ||||||
| 2026-01-26 | 13F | Merit Financial Group, LLC | 0 | -100,00 | 0 | |||||
| 2026-02-09 | 13F | Collaborative Wealth Managment Inc. | 110.511 | 18,53 | 3.143 | 17,63 | ||||
| 2026-02-17 | 13F | Advisor Group Holdings, Inc. | 168.029 | -44,40 | 4.779 | -44,81 | ||||
| 2026-02-13 | 13F | Kestra Advisory Services, LLC | 0 | -100,00 | 0 | |||||
| 2026-02-17 | 13F | IHT Wealth Management, LLC | 9.469 | 22,10 | 269 | 21,17 | ||||
| 2026-01-12 | 13F | M.e. Allison & Co., Inc. | 14.000 | 0,00 | 398 | -0,75 | ||||
| 2026-02-13 | 13F | Mariner, LLC | 116.337 | -4,21 | 3.309 | -4,92 | ||||
| 2026-02-17 | 13F | Private Advisor Group, LLC | 25.059 | 137,84 | 713 | 136,54 | ||||
| 2026-02-11 | 13F | OneAscent Financial Services LLC | 241.243 | 145,56 | 6.861 | 143,78 | ||||
| 2026-01-30 | 13F | SK Wealth Management, LLC | 136.142 | -21,91 | 3.880 | -21,65 | ||||
| 2026-02-25 | 13F | Tempo Wealth, LLC | 15.712 | 447 | ||||||
| 2026-02-10 | 13F | Goldman Sachs Group Inc | 0 | -100,00 | 0 | |||||
| 2026-02-17 | 13F | Royal Bank Of Canada | 191.401 | -2,60 | 5.443 | -3,32 | ||||
| 2026-02-10 | 13F | Moors & Cabot, Inc. | 18.696 | 0,00 | 532 | -0,75 | ||||
| 2026-01-08 | 13F | Cooper Financial Group | 0 | -100,00 | 0 | |||||
| 2026-02-05 | 13F | Atria Investments Llc | 33.019 | -16,04 | 939 | -16,61 | ||||
| 2026-02-12 | 13F | Brinker Capital Investments, LLC | 0 | -100,00 | 0 | |||||
| 2026-02-17 | 13F/A | BluePath Capital Management, LLC | 0 | -100,00 | 0 | -100,00 | ||||
| 2026-01-14 | 13F | Pallas Capital Advisors LLC | 467.436 | 9,84 | 13.294 | 9,03 | ||||
| 2026-01-14 | 13F | Wealthcare Advisory Partners LLC | 0 | -100,00 | 0 | |||||
| 2026-01-15 | 13F | Wright Fund Managment, LLC | 81.800 | 0,00 | 2.326 | -0,73 | ||||
| 2026-02-03 | 13F | Luken Investment Analytics, LLC | 577.598 | 3,77 | 16.427 | 3,01 | ||||
| 2026-02-11 | 13F | Janney Montgomery Scott LLC | 24.980 | 2,04 | 1 | |||||
| 2026-01-21 | 13F | Newbridge Financial Services Group, Inc. | 738 | 96,80 | 21 | 100,00 | ||||
| 2026-01-20 | 13F | Savvy Advisors, Inc. | 21.438 | 610 | ||||||
| 2026-01-13 | 13F | Sharkey, Howes & Javer | 130.338 | -38,05 | 3.707 | -38,51 | ||||
| 2026-02-05 | 13F | L & S Advisors Inc | 19.546 | 0,85 | 556 | 0,00 | ||||
| 2025-11-06 | 13F | BTC Capital Management, Inc. | 0 | -100,00 | 0 | -100,00 | ||||
| 2025-10-23 | 13F | Kingswood Wealth Advisors, Llc | 0 | -100,00 | 0 | |||||
| 2026-02-10 | 13F/A | Northwestern Mutual Wealth Management Co | 651 | -84,36 | 19 | -84,87 | ||||
| 2026-01-06 | 13F | Advance Capital Management, Inc. | 339.894 | -32,41 | 9.667 | -32,91 |