Grundlæggende statistik
| Institutionelle aktier (lange) | 48.886.198 - 43,52% (ex 13D/G) - change of -20,01MM shares -29,04% MRQ |
| Institutionel værdi (lang) | $ 125.789 USD ($1000) |
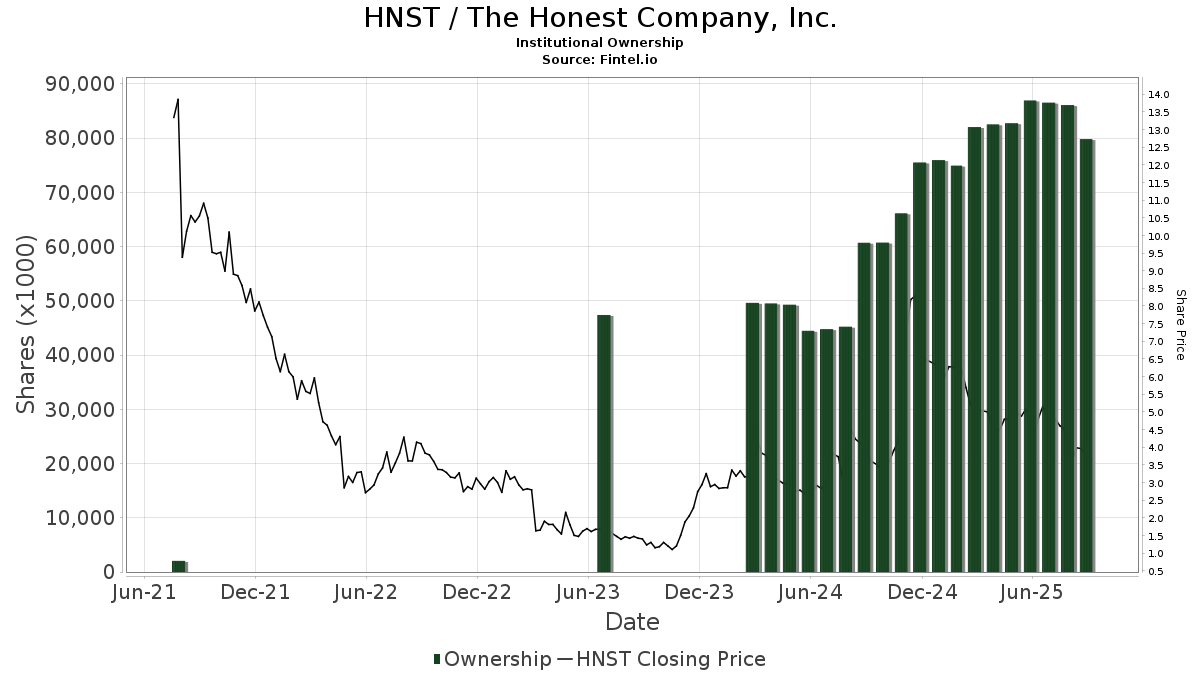
Institutionelt ejerskab og aktionærer
The Honest Company, Inc. (US:HNST) har 147 institutionelle ejere og aktionærer, der har indsendt 13D/G- eller 13F-formularer til Securities Exchange Commission (SEC). Disse institutioner har i alt 48,886,198 aktier. Største aktionærer omfatter BlackRock, Inc., Vanguard Group Inc, Portolan Capital Management, LLC, Mak Capital One Llc, ArrowMark Colorado Holdings LLC, Geode Capital Management, Llc, Balyasny Asset Management Llc, State Street Corp, Dimensional Fund Advisors Lp, and Goldman Sachs Group Inc .
The Honest Company, Inc. (NasdaqGS:HNST) institutionel ejerskabsstruktur viser aktuelle positioner i virksomheden efter institutioner og fonde, samt seneste ændringer i positionsstørrelse. Større aktionærer kan omfatte individuelle investorer, investeringsforeninger, hedgefonde eller institutioner. Skema 13D angiver, at investoren besidder (eller besidder) mere end 5 % af virksomheden og har til hensigt (eller har til hensigt at) aktivt at forfølge en ændring i forretningsstrategi. Skema 13G indikerer en passiv investering på over 5%.
The share price as of April 24, 2026 is 3,57 / share. Previously, on April 28, 2025, the share price was 4,79 / share. This represents a decline of 25,47% over that period.
Fondens stemningsscore
Fund Sentiment Score (fka Ownership Accumulation Score) finder de aktier, der bliver mest købt af fonde. Det er resultatet af en sofistikeret, multi-faktor kvantitativ model, der identificerer virksomheder med de højeste niveauer af institutionel akkumulering. Scoringsmodellen bruger en kombination af den samlede stigning i oplyste ejere, ændringerne i porteføljeallokeringer i disse ejere og andre målinger. Tallet går fra 0 til 100, hvor højere tal indikerer et højere niveau af akkumulering for sine jævnaldrende, og 50 er gennemsnittet.
Opdateringsfrekvens: Dagligt
Se Ownership Explorer, som giver en liste over højest rangerende virksomheder.
AI+ Ask Fintel’s AI assistant about The Honest Company, Inc..
Select a question to share a public post with an AI-crafted answer.
Thinking of good questions…
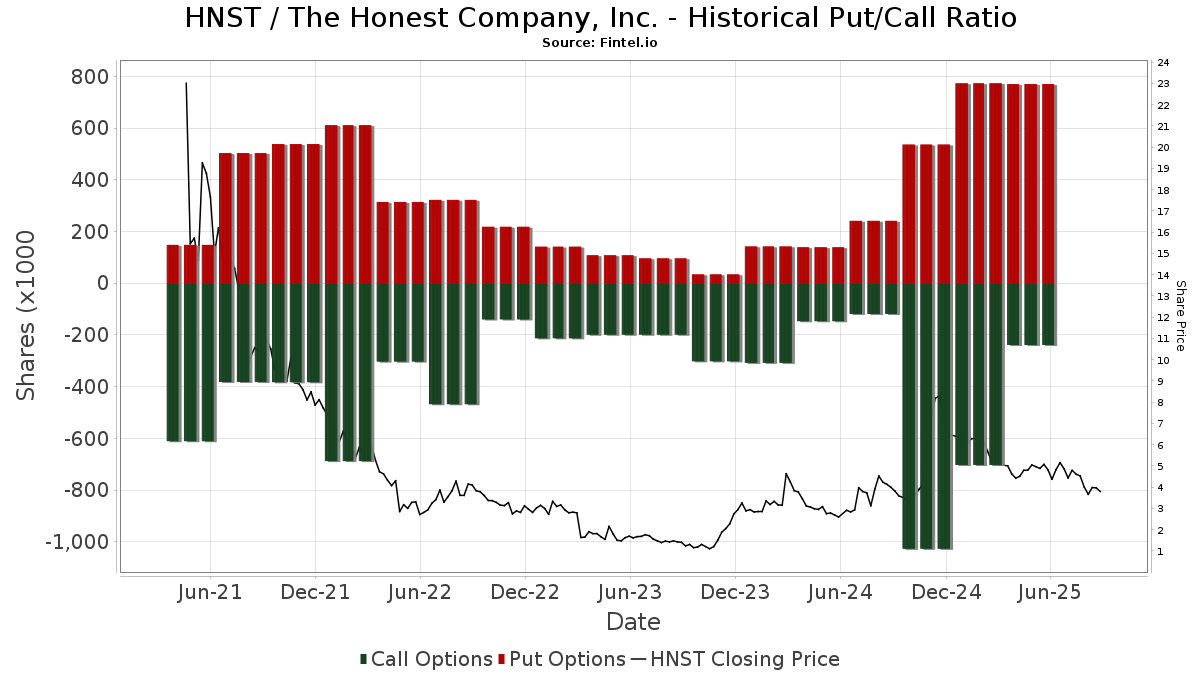
Institutionel Put/Call-forhold
Ud over at indberette standardaktie- og gældsudstedelser skal institutter med mere end 100 mill. aktiver under forvaltning også oplyse deres put- og call-optionsbeholdninger. Da salgsoptioner generelt indikerer negativ stemning, og købsoptioner indikerer positiv stemning, kan vi få en fornemmelse af den overordnede institutionelle stemning ved at plotte forholdet mellem put og kald. Diagrammet til højre viser det historiske put/call-forhold for dette instrument.
Brug af Put/Call Ratio som en indikator for investorernes stemning overvinder en af de vigtigste mangler ved at bruge totalt institutionelt ejerskab, som er, at en betydelig mængde af aktiver under forvaltning investeres passivt for at spore indekser. Passivt forvaltede fonde køber typisk ikke optioner, så indikatoren for put/call-forholdet følger mere nøje følelsen af aktivt forvaltede fonde.
13D/G-arkivering
Vi præsenterer 13D/G ansøgninger separat fra 13F ansøgninger på grund af den forskellige behandling af SEC. 13D/G-ansøgninger kan indgives af grupper af investorer (med én ledende), hvorimod 13F-ansøgninger ikke kan. Dette resulterer i situationer, hvor en investor kan indsende en 13D/G, der rapporterer én værdi for de samlede aktier (der repræsenterer alle de aktier, der ejes af investorgruppen), men derefter indsender en 13F, der rapporterer en anden værdi for de samlede aktier (der udelukkende repræsenterer deres egne) ejendomsret). Det betyder, at aktieejerskab af 13D/G-arkiver og 13F-arkiveringer ofte ikke er direkte sammenlignelige, så vi præsenterer dem separat.
Bemærk: Fra den 16. maj 2021 viser vi ikke længere ejere, der ikke har indsendt en 13D/G inden for det seneste år. Tidligere viste vi den fulde historie af 13D/G-arkiver. Generelt skal enheder, der er forpligtet til at indgive 13D/G-ansøgninger, indgive mindst årligt, før de indsender en afsluttende ansøgning. Dog forlader fonde nogle gange positioner uden at indsende en afsluttende ansøgning (dvs. de afvikler), så visning af den fulde historie resulterede nogle gange i forvirring om det nuværende ejerskab. For at undgå forvirring viser vi nu kun 'aktuelle' ejere - det vil sige - ejere, der har anmeldt inden for det seneste år.
Upgrade to unlock premium data.
| Fil dato | Form | Investor | Forrige Aktier |
Seneste Aktier |
Δ Aktier (Procent) |
Ejendomsret (Procent) |
Δ Ejerskab (Procent) |
|
|---|---|---|---|---|---|---|---|---|
| 2026-03-27 | VANGUARD GROUP INC | 6,374,635 | 0 | -100.00 | 0.00 | -100.00 | ||
| 2026-02-17 | Portolan Capital Management, LLC | 5,359,001 | 4,804,206 | -10.35 | 4.30 | -19.02 | ||
| 2026-02-17 | Warren Jessica | 6,306,820 | 5.40 | -16.92 | ||||
| 2025-05-15 | Divisadero Street Capital Management, LP | 5,531,931 | 2,830,724 | -48.83 | 2.60 | -52.73 |
13F og NPORT arkivering
Detaljer om 13F-arkivering er gratis. Detaljer om NP-ansøgninger kræver et premium-medlemskab. Grønne rækker angiver nye positioner. Røde rækker angiver lukkede positioner. Klik på linket ikon for at se den fulde transaktionshistorik.
Opgrader
for at låse premium-data op og eksportere til Excel ![]() .
.
| Fil dato | Kilde | Investor | Type | Gennemsnitlig pris (Øst) |
Aktier | Δ Aktier (%) |
Rapporteret Værdi ($1000) |
Δ Værdi (%) |
Port Alloc (%) |
|
|---|---|---|---|---|---|---|---|---|---|---|
| 2026-02-13 | 13F | Colony Group, LLC | 284.252 | 0,00 | 733 | -29,92 | ||||
| 2026-02-10 | 13F | IAG Wealth Partners, LLC | 0 | -100,00 | 0 | |||||
| 2025-11-13 | 13F | Sei Investments Co | 0 | -100,00 | 0 | |||||
| 2026-02-12 | 13F | Counterpoint Mutual Funds LLC | 0 | -100,00 | 0 | |||||
| 2026-02-11 | 13F | Jpmorgan Chase & Co | 95.658 | -57,18 | 247 | -70,07 | ||||
| 2026-04-22 | 13F | Sterling Capital Management LLC | 1.848 | -38,24 | 5 | -28,57 | ||||
| 2026-02-17 | 13F | ArrowMark Colorado Holdings LLC | 2.548.546 | -15,04 | 6.575 | -40,43 | ||||
| 2026-02-12 | 13F | Commonwealth Equity Services, Llc | 10.655 | -3,15 | 27 | |||||
| 2026-02-13 | 13F | JustInvest LLC | 13.230 | 15,10 | 34 | -19,05 | ||||
| 2026-01-29 | 13F | Vanguard Group Inc | 6.374.635 | 19,98 | 16.447 | -15,89 | ||||
| 2026-02-13 | 13F | Ieq Capital, Llc | 80.978 | 0,00 | 209 | -29,97 | ||||
| 2026-02-10 | 13F | Bank of New York Mellon Corp | 458.935 | 12,10 | 1.184 | -21,38 | ||||
| 2026-04-13 | 13F | Wolff Wiese Magana Llc | 100 | 0,00 | 0 | |||||
| 2026-04-17 | 13F | Vermillion Wealth Management, Inc. | 0 | -100,00 | 0 | |||||
| 2026-02-17 | 13F | Two Sigma Investments, Lp | 0 | -100,00 | 0 | |||||
| 2026-02-17 | 13F | Fmr Llc | 903.613 | 15,13 | 2.331 | -19,29 | ||||
| 2026-02-17 | 13F | Captrust Financial Advisors | 53.573 | 180,00 | 138 | 97,14 | ||||
| 2026-02-17 | 13F | SageView Advisory Group, LLC | 200 | 1 | ||||||
| 2025-11-04 | 13F | State of Wyoming | 0 | -100,00 | 0 | |||||
| 2025-11-13 | 13F | Heritage Wealth Advisors | 0 | -100,00 | 0 | |||||
| 2026-02-13 | 13F | Pinnacle Wealth Planning Services, Inc. | 2.454 | 6 | ||||||
| 2026-02-17 | 13F | Qube Research & Technologies Ltd | 0 | -100,00 | 0 | |||||
| 2025-11-13 | 13F | Marshall Wace, Llp | 292.060 | -62,97 | 1.075 | -73,24 | ||||
| 2026-02-13 | 13F | American Century Companies Inc | 176.564 | 8,90 | 456 | -23,66 | ||||
| 2026-02-17 | 13F | Abel Hall, LLC | 23.420 | 60 | ||||||
| 2025-11-17 | 13F | Jacobs Levy Equity Management, Inc | 0 | -100,00 | 0 | |||||
| 2026-04-23 | 13F | CWM Advisors, LLC | 174.670 | -3,54 | 514 | 9,85 | ||||
| 2026-02-13 | 13F | Wells Fargo & Company/mn | 133.676 | 67,67 | 345 | 17,41 | ||||
| 2025-11-13 | 13F | Acadian Asset Management Llc | 0 | -100,00 | 0 | |||||
| 2026-02-03 | 13F | B. Riley Financial, Inc. | 0 | -100,00 | 0 | -100,00 | ||||
| 2026-02-11 | 13F | Group One Trading, L.p. | 44.309 | 15,95 | 114 | -18,57 | ||||
| 2025-10-30 | 13F | Strs Ohio | 0 | -100,00 | 0 | |||||
| 2026-02-13 | 13F | Walleye Capital LLC | Call | 0 | -100,00 | 0 | ||||
| 2026-02-17 | 13F | Two Sigma Securities, Llc | 57.018 | 147 | ||||||
| 2026-01-26 | 13F | Whittier Trust Co | 2.165 | 0,00 | 6 | -28,57 | ||||
| 2026-04-15 | 13F | Merit Financial Group, LLC | 11.430 | 34 | ||||||
| 2026-02-17 | 13F | Brevan Howard Capital Management LP | 24.235 | -82,98 | 63 | -88,15 | ||||
| 2026-04-24 | 13F | Root Financial Partners, LLC | 54.798 | 0,73 | 161 | 15,00 | ||||
| 2026-02-06 | 13F | Larson Financial Group LLC | 0 | -100,00 | 0 | |||||
| 2025-11-14 | 13F | Walleye Trading LLC | Call | 0 | -100,00 | 0 | -100,00 | |||
| 2026-02-10 | 13F | Bnp Paribas Arbitrage, Sa | 20.350 | 12,20 | 53 | -21,21 | ||||
| 2026-02-05 | 13F | Amalgamated Bank | 2.934 | 5,88 | 0 | |||||
| 2026-02-17 | 13F | Mak Capital One Llc | 3.528.704 | 9.104 | ||||||
| 2026-02-13 | 13F | State Street Corp | 1.863.639 | 6,25 | 4.808 | -25,50 | ||||
| 2026-02-17 | 13F | Optiver Holding B.V. | 693 | -10,70 | 2 | -50,00 | ||||
| 2025-11-14 | 13F | Wexford Capital Lp | 0 | -100,00 | 0 | |||||
| 2026-02-13 | 13F | National Bank Of Canada /fi/ | 250 | 0,00 | 1 | |||||
| 2026-02-11 | 13F | Simplex Trading, Llc | 0 | -100,00 | 0 | |||||
| 2026-02-17 | 13F | Polymer Capital Management (US) LLC | 0 | -100,00 | 0 | |||||
| 2026-02-09 | 13F | Hartland & Co., LLC | 3 | -86,36 | 0 | |||||
| 2026-02-17 | 13F | Voleon Capital Management Lp | 12.305 | 32 | ||||||
| 2026-02-17 | 13F | Alpine Global Management, LLC | 33.395 | 86 | ||||||
| 2026-02-17 | 13F | Advisor Group Holdings, Inc. | 5.423 | -66,76 | 14 | -79,37 | ||||
| 2026-02-11 | 13F | Cerity Partners LLC | 14.585 | -18,12 | 38 | -43,08 | ||||
| 2026-02-13 | 13F | Police & Firemen's Retirement System of New Jersey | 24.284 | 0,00 | 63 | -30,34 | ||||
| 2026-02-11 | 13F | Franklin Resources Inc | 0 | -100,00 | 0 | |||||
| 2026-02-17 | 13F | Lotus Technology Management, LP | 254.780 | 657 | ||||||
| 2026-02-12 | 13F | Federation des caisses Desjardins du Quebec | 12.700 | 30,93 | 33 | -8,57 | ||||
| 2026-02-12 | 13F | Renaissance Technologies Llc | 628.600 | -70,42 | 1.622 | -79,27 | ||||
| 2026-02-13 | 13F | Walleye Capital LLC | 0 | -100,00 | 0 | |||||
| 2026-02-17 | 13F | Advisory Services Network, LLC | 23.027 | 0,12 | 59 | -29,76 | ||||
| 2026-02-17 | 13F | D. E. Shaw & Co., Inc. | 0 | -100,00 | 0 | |||||
| 2026-01-15 | 13F | Nisa Investment Advisors, Llc | 0 | -100,00 | 0 | |||||
| 2026-02-13 | 13F | Verition Fund Management LLC | 253.812 | 48,51 | 655 | 4,14 | ||||
| 2026-02-17 | 13F | Sherbrooke Park Advisers Llc | 0 | -100,00 | 0 | |||||
| 2025-11-13 | 13F | Jump Financial, LLC | 0 | -100,00 | 0 | |||||
| 2026-02-17 | 13F | Aquatic Capital Management LLC | 0 | -100,00 | 0 | |||||
| 2025-10-30 | 13F | Covestor Ltd | 0 | -100,00 | 0 | |||||
| 2025-10-31 | 13F | Y-Intercept (Hong Kong) Ltd | 0 | -100,00 | 0 | |||||
| 2025-11-06 | 13F | Templeton & Phillips Capital Management, LLC | 0 | -100,00 | 0 | -100,00 | ||||
| 2026-02-17 | 13F | Millennium Management Llc | 41.130 | -95,35 | 106 | -96,74 | ||||
| 2026-02-10 | 13F | Tidemark, LLC | 401 | 0,00 | 1 | 0,00 | ||||
| 2026-02-12 | 13F | CIBC Private Wealth Group, LLC | 0 | -100,00 | 0 | |||||
| 2026-04-21 | 13F | Echo Wealth Management, LLC | 181.182 | 1,35 | 533 | 15,40 | ||||
| 2026-02-05 | 13F | Allworth Financial LP | 381 | -28,65 | 1 | -100,00 | ||||
| 2025-11-14 | 13F | Wolverine Trading, Llc | 0 | -100,00 | 0 | -100,00 | ||||
| 2026-02-10 | 13F | Envestnet Asset Management Inc | 13.303 | -81,71 | 34 | -87,27 | ||||
| 2026-02-13 | 13F | Morgan Stanley | 408.993 | -67,71 | 1.055 | -77,37 | ||||
| 2026-02-13 | 13F | Squarepoint Ops LLC | 38.892 | -87,79 | 100 | -91,47 | ||||
| 2026-04-21 | 13F | Vise Technologies, Inc. | 54.694 | 0,00 | 141 | 0,00 | ||||
| 2026-02-13 | 13F | Manufacturers Life Insurance Company, The | 0 | -100,00 | 0 | |||||
| 2025-11-14 | 13F | Quantinno Capital Management LP | 0 | -100,00 | 0 | |||||
| 2026-04-14 | 13F | Amicus Financial Advisors, LLC | 11.340 | 2,16 | 33 | 17,86 | ||||
| 2026-02-17 | 13F | Creative Planning | 38.919 | -5,57 | 100 | -33,77 | ||||
| 2026-02-13 | 13F | Transamerica Financial Advisors, Inc. | 29 | 0 | ||||||
| 2026-01-20 | 13F | AdvisorNet Financial, Inc | 0 | -100,00 | 0 | |||||
| 2026-02-12 | 13F | Hollencrest Capital Management | 600 | 0,00 | 2 | -50,00 | ||||
| 2025-11-13 | 13F | Healthcare Of Ontario Pension Plan Trust Fund | 0 | -100,00 | 0 | -100,00 | ||||
| 2025-11-13 | 13F | Norges Bank | 0 | -100,00 | 0 | |||||
| 2026-02-12 | 13F | EntryPoint Capital, LLC | 136.810 | 44,06 | 353 | 0,86 | ||||
| 2025-10-30 | 13F | Keebeck Alpha, LP | 0 | -100,00 | 0 | |||||
| 2026-02-13 | 13F | MAI Capital Management | 65 | -81,94 | 0 | -100,00 | ||||
| 2026-02-06 | 13F | EverSource Wealth Advisors, LLC | 1.978 | 141,51 | 5 | 66,67 | ||||
| 2026-04-24 | 13F | ProShare Advisors LLC | 13.729 | -19,54 | 40 | -9,09 | ||||
| 2025-11-14 | 13F | Skopos Labs, Inc. | 0 | -100,00 | 0 | |||||
| 2026-02-12 | 13F | Nuveen, LLC | 252.817 | -61,81 | 652 | -73,22 | ||||
| 2026-02-17 | 13F | Alliancebernstein L.p. | 83.200 | 0,00 | 215 | -30,07 | ||||
| 2026-02-17 | 13F | Northern Trust Corp | 686.757 | -6,38 | 1.772 | -34,38 | ||||
| 2026-02-17 | 13F | Engineers Gate Manager LP | 0 | -100,00 | 0 | |||||
| 2026-02-12 | 13F | Dimensional Fund Advisors Lp | 1.750.274 | -22,54 | 4.516 | -45,69 | ||||
| 2026-02-13 | 13F | Panagora Asset Management Inc | 0 | -100,00 | 0 | |||||
| 2026-02-05 | 13F | Td Private Client Wealth Llc | 0 | -100,00 | 0 | |||||
| 2026-02-12 | 13F | Jane Street Group, Llc | Put | 0 | -100,00 | 0 | -100,00 | |||
| 2026-02-17 | 13F | Two Sigma Advisers, Lp | 39.800 | -47,84 | 103 | -63,57 | ||||
| 2025-11-07 | 13F | Beacon Capital Management, LLC | 0 | -100,00 | 0 | |||||
| 2026-02-10 | 13F | Quantbot Technologies LP | 14.746 | 38 | ||||||
| 2025-11-13 | 13F | Clear Street Markets Llc | 0 | -100,00 | 0 | |||||
| 2026-02-17 | 13F | Aqr Capital Management Llc | 75.577 | -78,77 | 195 | -85,19 | ||||
| 2026-04-16 | 13F | SG Americas Securities, LLC | 0 | -100,00 | 0 | |||||
| 2026-04-23 | 13F | SJS Investment Consulting Inc. | 166 | 0 | ||||||
| 2026-02-12 | 13F | Quadrant Capital Group Llc | 167 | 0 | ||||||
| 2026-02-09 | 13F | Nia Impact Advisors, Llc | 0 | -100,00 | 0 | |||||
| 2026-02-17 | 13F | Ameriprise Financial Inc | 1.400.711 | 13,77 | 3.614 | -20,24 | ||||
| 2026-02-12 | 13F | Hibernia Wealth Partners, LLC | 12.538 | 32 | ||||||
| 2026-02-12 | 13F | MetLife Investment Management, LLC | 36.175 | -35,87 | 93 | -55,07 | ||||
| 2026-02-10 | 13F | Rothschild Investment Llc | 207 | 176,00 | 1 | |||||
| 2026-02-17 | 13F | MIRAE ASSET GLOBAL ETFS HOLDINGS Ltd. | 43.372 | -0,89 | 112 | -31,06 | ||||
| 2026-01-23 | 13F | Westside Investment Management, Inc. | 1.000 | 3 | ||||||
| 2026-02-17 | 13F | Royal Bank Of Canada | 2.950 | -98,66 | 8 | -99,01 | ||||
| 2026-02-10 | 13F | Intech Investment Management Llc | 38.164 | -9,66 | 98 | -36,77 | ||||
| 2026-02-12 | 13F | Hrt Financial Lp | 48.645 | 0 | ||||||
| 2026-02-13 | 13F | Rhumbline Advisers | 114.508 | -12,60 | 295 | -38,80 | ||||
| 2025-11-03 | 13F | GPS Wealth Strategies Group, LLC | 0 | -100,00 | 0 | |||||
| 2026-02-17 | 13F | California State Teachers Retirement System | 5.747 | -1,68 | 15 | -33,33 | ||||
| 2025-11-14 | 13F | Walleye Capital LLC | Put | 0 | -100,00 | 0 | -100,00 | |||
| 2025-11-12 | 13F | Brinker Capital Investments, LLC | 0 | -100,00 | 0 | |||||
| 2026-02-12 | 13F | New York State Common Retirement Fund | 25.200 | 0,00 | 65 | -29,35 | ||||
| 2025-11-06 | 13F | Ameritas Advisory Services, LLC | 0 | -100,00 | 0 | |||||
| 2026-02-17 | 13F | Portolan Capital Management, LLC | 4.804.206 | -30,66 | 12.395 | -51,39 | ||||
| 2026-02-17 | 13F | Atom Investors LP | 10.891 | -70,64 | 28 | -79,41 | ||||
| 2025-11-10 | 13F | Hillsdale Investment Management Inc. | 0 | -100,00 | 0 | -100,00 | ||||
| 2025-11-06 | 13F | Cornerstone Investment Partners, LLC | 0 | -100,00 | 0 | |||||
| 2026-04-13 | 13F | IFP Advisors, Inc | 2 | -93,10 | 0 | |||||
| 2026-01-29 | 13F | UBS Group AG | 1.014.939 | 77,31 | 2.619 | 24,31 | ||||
| 2026-02-11 | 13F | Deutsche Bank Ag\ | 73.108 | -85,06 | 189 | -89,56 | ||||
| 2026-02-17 | 13F | Jones Financial Companies Lllp | 2.786 | 51,74 | 7 | 16,67 | ||||
| 2025-11-05 | 13F | Bessemer Group Inc | 0 | -100,00 | 0 | |||||
| 2026-02-13 | 13F | Citigroup Inc | 893.511 | 211,57 | 2.305 | 118,48 | ||||
| 2026-02-12 | 13F | BlackRock, Inc. | 6.564.839 | 1,23 | 16.937 | -29,03 | ||||
| 2026-02-17 | 13F | Signature Equity Partners, LLC | 60 | 0 | ||||||
| 2026-02-13 | 13F | Caitong International Asset Management Co., Ltd | 6.333 | -10,46 | 16 | -38,46 | ||||
| 2026-02-17 | 13F | XTX Topco Ltd | 48.115 | -45,47 | 124 | -61,73 | ||||
| 2026-01-30 | 13F | Us Bancorp \de\ | 0 | -100,00 | 0 | |||||
| 2025-11-14 | 13F | Anchor Investment Management, LLC | 0 | -100,00 | 0 | |||||
| 2026-01-26 | 13F | Equity Wealth Partners, LLC | 10.087 | 0,00 | 26 | -29,73 | ||||
| 2026-02-10 | 13F | Axq Capital, Lp | 21.905 | -71,85 | 57 | -80,42 | ||||
| 2025-11-10 | 13F | Options Solutions, Llc | 0 | -100,00 | 0 | |||||
| 2025-11-14 | 13F | DRW Securities, LLC | 0 | -100,00 | 0 | -100,00 | ||||
| 2026-04-14 | 13F | Wealthcare Advisory Partners LLC | 13.559 | 10,09 | 40 | 25,81 | ||||
| 2026-02-13 | 13F | Pathstone Holdings, LLC | 168.607 | 0,15 | 435 | -29,73 | ||||
| 2026-02-13 | 13F | Barclays Plc | 146.330 | 11,32 | 378 | -21,95 | ||||
| 2026-02-12 | 13F | Voya Investment Management Llc | 16.623 | 0,00 | 43 | -31,15 | ||||
| 2025-11-21 | 13F | Nebula Research & Development LLC | 0 | -100,00 | 0 | |||||
| 2026-02-17 | 13F | Balyasny Asset Management Llc | 2.006.646 | 796,21 | 5.177 | 529,04 | ||||
| 2026-02-04 | 13F | Twin Lakes Capital Management, LLC | 6.008 | 0,00 | 16 | -31,82 | ||||
| 2026-02-17 | 13F | Citadel Advisors Llc | Put | 103.500 | 77,84 | 267 | 24,77 | |||
| 2026-02-17 | 13F | Price T Rowe Associates Inc /md/ | 49.636 | 0,00 | 0 | |||||
| 2026-02-17 | 13F | Crawford Fund Management, LLC | Put | 139.000 | -21,02 | 359 | -44,67 | |||
| 2025-11-14 | 13F | Tudor Investment Corp Et Al | 0 | -100,00 | 0 | |||||
| 2026-02-17 | 13F | Citadel Advisors Llc | Call | 15.900 | 41 | |||||
| 2026-02-17 | 13F | Citadel Advisors Llc | 940.680 | -27,66 | 2.427 | -49,30 | ||||
| 2026-02-12 | 13F | Jasper Ridge Partners, L.P. | 43.532 | 0,00 | 112 | -30,00 | ||||
| 2026-01-21 | 13F | Flagship Harbor Advisors, Llc | 250 | 1 | ||||||
| 2025-11-14 | 13F | Prelude Capital Management, Llc | 0 | -100,00 | 0 | -100,00 | ||||
| 2026-02-17 | 13F | Canada Pension Plan Investment Board | 13.600 | -2,16 | 35 | -31,37 | ||||
| 2026-02-12 | 13F | Cibc World Markets Corp | 0 | -100,00 | 0 | |||||
| 2026-04-22 | 13F | Coston, McIsaac & Partners | 100 | 0 | ||||||
| 2026-02-10 | 13F/A | Northwestern Mutual Wealth Management Co | 15.416 | 0,00 | 40 | -30,36 | ||||
| 2026-02-17 | 13F | State Of Wisconsin Investment Board | 43.300 | -55,50 | 112 | -68,99 | ||||
| 2025-11-13 | 13F | Landscape Capital Management, L.l.c. | 0 | -100,00 | 0 | |||||
| 2026-02-09 | 13F | Legal & General Group Plc | 9.081 | -3,79 | 23 | -32,35 | ||||
| 2026-02-12 | 13F | Principal Securities, Inc. | 0 | -100,00 | 0 | |||||
| 2026-04-15 | 13F | Fortitude Family Office, LLC | 179 | 0,00 | 1 | |||||
| 2026-02-13 | 13F | Charles Schwab Investment Management Inc | 285.822 | 4,00 | 737 | -27,10 | ||||
| 2026-02-13 | 13F | Peak6 Llc | 0 | -100,00 | 0 | |||||
| 2026-01-29 | 13F | Comerica Bank | 98 | 0 | ||||||
| 2026-02-13 | 13F | SRS Capital Advisors, Inc. | 3.053 | -30,17 | 8 | -56,25 | ||||
| 2026-02-13 | 13F | Walleye Trading LLC | Put | 0 | -100,00 | 0 | ||||
| 2026-02-14 | 13F | Rockefeller Capital Management L.P. | 5.700 | 9,62 | 15 | -26,32 | ||||
| 2025-11-14 | 13F | Graham Capital Management, L.P. | 0 | -100,00 | 0 | |||||
| 2026-04-13 | 13F | True Wealth Design, LLC | 230 | 1 | ||||||
| 2026-02-17 | 13F | Susquehanna International Group, Llp | 1.046.284 | 63,34 | 2.699 | 14,51 | ||||
| 2026-02-12 | 13F | Jane Street Group, Llc | Call | 109.400 | 164,89 | 282 | 86,75 | |||
| 2026-02-06 | 13F | Gsa Capital Partners Llp | 34.098 | -92,95 | 0 | -100,00 | ||||
| 2026-02-12 | 13F | Jane Street Group, Llc | 500.416 | -0,78 | 1.291 | -30,40 | ||||
| 2026-02-17 | 13F | Susquehanna International Group, Llp | Put | 71.300 | -55,10 | 184 | -68,66 | |||
| 2026-02-17 | 13F | Susquehanna International Group, Llp | Call | 247.800 | -31,70 | 639 | -52,13 | |||
| 2026-02-17 | 13F | Bank Of America Corp /de/ | 173.757 | 113,18 | 448 | 49,83 | ||||
| 2026-02-17 | 13F | Tower Research Capital LLC (TRC) | 20.435 | 154,90 | 53 | 79,31 | ||||
| 2026-02-09 | 13F | Harbour Investments, Inc. | 19.521 | 876,05 | 50 | 614,29 | ||||
| 2025-11-03 | 13F | Summit Global Investments | 0 | -100,00 | 0 | |||||
| 2026-01-30 | 13F | Wealthfront Advisers Llc | 25.177 | 24,00 | 65 | -13,51 | ||||
| 2026-02-17 | 13F | Russell Investments Group, Ltd. | 9.996 | -59,97 | 26 | -72,53 | ||||
| 2025-11-13 | 13F | Connor, Clark & Lunn Investment Management Ltd. | 0 | -100,00 | 0 | |||||
| 2026-04-23 | 13F | Rexford Capital Inc | 30 | 0 | ||||||
| 2026-02-06 | 13F | Global Retirement Partners, LLC | 2.014 | 0,00 | 5 | -28,57 | ||||
| 2026-04-20 | 13F | State of Alaska, Department of Revenue | 4.454 | 0,00 | 0 | |||||
| 2025-11-12 | 13F | CIBC Bancorp USA Inc. | 10.639 | 39 | ||||||
| 2026-02-13 | 13F | Prudential Financial Inc | 0 | -100,00 | 0 | |||||
| 2026-01-20 | 13F | Ethos Financial Group, LLC | 0 | -100,00 | 0 | -100,00 | ||||
| 2026-02-13 | 13F | Walleye Trading LLC | 0 | -100,00 | 0 | |||||
| 2026-01-29 | 13F | IMC-Chicago, LLC | 0 | -100,00 | 0 | |||||
| 2026-02-19 | 13F | Invesco Ltd. | 186.991 | 45,85 | 482 | 2,34 | ||||
| 2026-02-23 | 13F | Virtu Financial LLC | 173.782 | 0 | ||||||
| 2026-02-10 | 13F | Goldman Sachs Group Inc | 1.520.331 | 70,29 | 3.922 | 19,39 | ||||
| 2026-04-17 | 13F | Mainstream Capital Management LLC | 236.061 | 0,00 | 694 | 13,96 | ||||
| 2026-02-11 | 13F | Ameritas Investment Partners, Inc. | 9.534 | 25 | ||||||
| 2026-04-07 | 13F | Green Alpha Advisors, LLC | 301.292 | -0,10 | 886 | 13,75 | ||||
| 2025-11-12 | 13F | Polen Capital Management Llc | 0 | -100,00 | 0 | |||||
| 2026-02-11 | 13F | LPL Financial LLC | 20.607 | 9,82 | 53 | -23,19 | ||||
| 2026-04-08 | 13F | Wealth Enhancement Advisory Services, Llc | 29.917 | 84 | ||||||
| 2026-02-13 | 13F | Victory Capital Management Inc | 724.326 | -68,94 | 1.869 | -78,23 | ||||
| 2026-04-07 | 13F | Farther Finance Advisors, LLC | 1.051 | 4.904,76 | 3 | |||||
| 2026-02-17 | 13F | Raymond James Financial Inc | 48.665 | -2,85 | 126 | -32,07 | ||||
| 2026-01-12 | 13F | Rialto Wealth Management, LLC | 0 | -100,00 | 0 | |||||
| 2026-02-13 | 13F | Centiva Capital, LP | 0 | -100,00 | 0 | |||||
| 2025-11-14 | 13F | Moors & Cabot, Inc. | 0 | -100,00 | 0 | -100,00 | ||||
| 2026-04-06 | 13F | GAMMA Investing LLC | 1.372 | -23,14 | 4 | 0,00 | ||||
| 2025-11-14 | 13F | Sofos Investments, Inc. | 0 | -100,00 | 0 | |||||
| 2026-02-06 | 13F | Pnc Financial Services Group, Inc. | 202 | 1.022,22 | 1 | |||||
| 2026-02-17 | 13F | Algert Global Llc | 62.550 | -25,96 | 0 | |||||
| 2025-11-14 | 13F | Aigen Investment Management, Lp | 0 | -100,00 | 0 | |||||
| 2025-11-14 | 13F | Wolverine Trading, Llc | Call | 97.900 | 658,91 | 363 | 485,48 | |||
| 2025-11-14 | 13F | Wolverine Trading, Llc | Put | 20.200 | 20,24 | 75 | -8,64 | |||
| 2026-01-26 | 13F | Cwm, Llc | 3.635 | -86,71 | 0 | |||||
| 2026-02-03 | 13F | SBI Securities Co., Ltd. | 3.447 | -3,58 | 9 | -38,46 | ||||
| 2026-02-13 | 13F | Mariner, LLC | 95.137 | 659,39 | 245 | 432,61 | ||||
| 2026-02-09 | 13F | Geode Capital Management, Llc | 2.323.572 | 1,25 | 5.996 | -29,01 |