Grundlæggende statistik
| Institutionelle aktier (lange) | 33.227.909 - 56,74% (ex 13D/G) - change of -12,11MM shares -26,70% MRQ |
| Institutionel værdi (lang) | $ 2.602.306 USD ($1000) |
Institutionelt ejerskab og aktionærer
Acushnet Holdings Corp. (US:GOLF) har 319 institutionelle ejere og aktionærer, der har indsendt 13D/G- eller 13F-formularer til Securities Exchange Commission (SEC). Disse institutioner har i alt 33,227,909 aktier. Største aktionærer omfatter Kayne Anderson Rudnick Investment Management Llc, BlackRock, Inc., Vanguard Group Inc, Dimensional Fund Advisors Lp, Capital Research Global Investors, Morgan Stanley, State Street Corp, Raymond James Financial Inc, Principal Financial Group Inc, and Wells Fargo & Company/mn .
Acushnet Holdings Corp. (NYSE:GOLF) institutionel ejerskabsstruktur viser aktuelle positioner i virksomheden efter institutioner og fonde, samt seneste ændringer i positionsstørrelse. Større aktionærer kan omfatte individuelle investorer, investeringsforeninger, hedgefonde eller institutioner. Skema 13D angiver, at investoren besidder (eller besidder) mere end 5 % af virksomheden og har til hensigt (eller har til hensigt at) aktivt at forfølge en ændring i forretningsstrategi. Skema 13G indikerer en passiv investering på over 5%.
The share price as of April 24, 2026 is 98,10 / share. Previously, on April 28, 2025, the share price was 63,56 / share. This represents an increase of 54,34% over that period.

Fondens stemningsscore
Fund Sentiment Score (fka Ownership Accumulation Score) finder de aktier, der bliver mest købt af fonde. Det er resultatet af en sofistikeret, multi-faktor kvantitativ model, der identificerer virksomheder med de højeste niveauer af institutionel akkumulering. Scoringsmodellen bruger en kombination af den samlede stigning i oplyste ejere, ændringerne i porteføljeallokeringer i disse ejere og andre målinger. Tallet går fra 0 til 100, hvor højere tal indikerer et højere niveau af akkumulering for sine jævnaldrende, og 50 er gennemsnittet.
Opdateringsfrekvens: Dagligt
Se Ownership Explorer, som giver en liste over højest rangerende virksomheder.
AI+ Ask Fintel’s AI assistant about Acushnet Holdings Corp..
Select a question to share a public post with an AI-crafted answer.
Thinking of good questions…
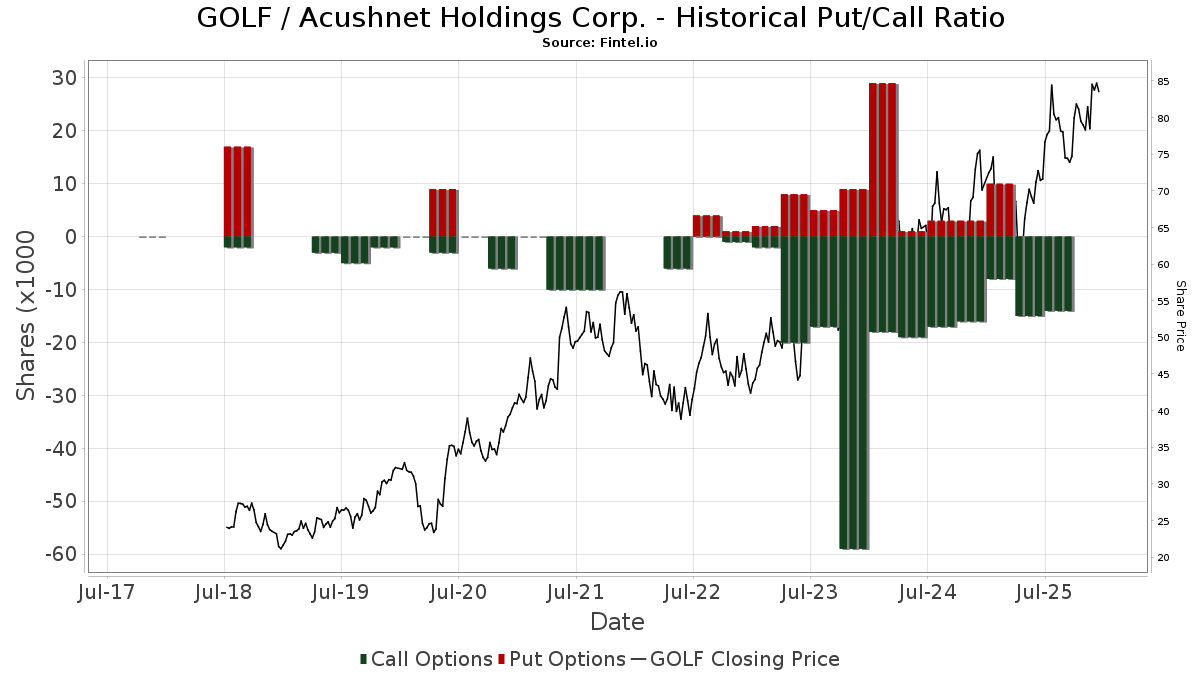
Institutionel Put/Call-forhold
Ud over at indberette standardaktie- og gældsudstedelser skal institutter med mere end 100 mill. aktiver under forvaltning også oplyse deres put- og call-optionsbeholdninger. Da salgsoptioner generelt indikerer negativ stemning, og købsoptioner indikerer positiv stemning, kan vi få en fornemmelse af den overordnede institutionelle stemning ved at plotte forholdet mellem put og kald. Diagrammet til højre viser det historiske put/call-forhold for dette instrument.
Brug af Put/Call Ratio som en indikator for investorernes stemning overvinder en af de vigtigste mangler ved at bruge totalt institutionelt ejerskab, som er, at en betydelig mængde af aktiver under forvaltning investeres passivt for at spore indekser. Passivt forvaltede fonde køber typisk ikke optioner, så indikatoren for put/call-forholdet følger mere nøje følelsen af aktivt forvaltede fonde.
13D/G-arkivering
Vi præsenterer 13D/G ansøgninger separat fra 13F ansøgninger på grund af den forskellige behandling af SEC. 13D/G-ansøgninger kan indgives af grupper af investorer (med én ledende), hvorimod 13F-ansøgninger ikke kan. Dette resulterer i situationer, hvor en investor kan indsende en 13D/G, der rapporterer én værdi for de samlede aktier (der repræsenterer alle de aktier, der ejes af investorgruppen), men derefter indsender en 13F, der rapporterer en anden værdi for de samlede aktier (der udelukkende repræsenterer deres egne) ejendomsret). Det betyder, at aktieejerskab af 13D/G-arkiver og 13F-arkiveringer ofte ikke er direkte sammenlignelige, så vi præsenterer dem separat.
Bemærk: Fra den 16. maj 2021 viser vi ikke længere ejere, der ikke har indsendt en 13D/G inden for det seneste år. Tidligere viste vi den fulde historie af 13D/G-arkiver. Generelt skal enheder, der er forpligtet til at indgive 13D/G-ansøgninger, indgive mindst årligt, før de indsender en afsluttende ansøgning. Dog forlader fonde nogle gange positioner uden at indsende en afsluttende ansøgning (dvs. de afvikler), så visning af den fulde historie resulterede nogle gange i forvirring om det nuværende ejerskab. For at undgå forvirring viser vi nu kun 'aktuelle' ejere - det vil sige - ejere, der har anmeldt inden for det seneste år.
Upgrade to unlock premium data.
| Fil dato | Form | Investor | Forrige Aktier |
Seneste Aktier |
Δ Aktier (Procent) |
Ejendomsret (Procent) |
Δ Ejerskab (Procent) |
|
|---|---|---|---|---|---|---|---|---|
| 2026-03-26 | VANGUARD GROUP INC | 3,090,666 | 0 | -100.00 | 0.00 | -100.00 | ||
| 2026-02-13 | KAYNE ANDERSON RUDNICK INVESTMENT MANAGEMENT LLC | 7,788,977 | 6,092,055 | -21.79 | 10.40 | -12.68 | ||
| 2025-04-24 | BlackRock, Inc. | 4,120,530 | 6.90 |
13F og NPORT arkivering
Detaljer om 13F-arkivering er gratis. Detaljer om NP-ansøgninger kræver et premium-medlemskab. Grønne rækker angiver nye positioner. Røde rækker angiver lukkede positioner. Klik på linket ikon for at se den fulde transaktionshistorik.
Opgrader
for at låse premium-data op og eksportere til Excel ![]() .
.
| Fil dato | Kilde | Investor | Type | Gennemsnitlig pris (Øst) |
Aktier | Δ Aktier (%) |
Rapporteret Værdi ($1000) |
Δ Værdi (%) |
Port Alloc (%) |
|
|---|---|---|---|---|---|---|---|---|---|---|
| 2026-02-10 | 13F | Amica Mutual Insurance Co | 68.816 | 0,00 | 5 | 0,00 | ||||
| 2026-04-10 | 13F | Impact Capital Partners LLC | 10.370 | -3,17 | 969 | 13,47 | ||||
| 2026-01-27 | 13F | TD Waterhouse Canada Inc. | 39 | 0,00 | 3 | 0,00 | ||||
| 2026-04-09 | 13F | Curated Wealth Partners LLC | 10.064 | -0,82 | 941 | 16,19 | ||||
| 2026-02-04 | 13F | Pensionmark Financial Group, Llc | 7.176 | -14,68 | 569 | -13,94 | ||||
| 2026-02-11 | 13F | Neumeier Poma Investment Counsel Llc | 384.424 | 51,69 | 30.685 | 54,25 | ||||
| 2026-02-12 | 13F | Pitcairn Co | 0 | -100,00 | 0 | |||||
| 2026-04-20 | 13F | Moody Aldrich Partners Llc | 62.179 | -1,03 | 5.812 | 15,92 | ||||
| 2025-11-14 | 13F | Walleye Capital LLC | 0 | -100,00 | 0 | |||||
| 2026-02-06 | 13F | Pnc Financial Services Group, Inc. | 6.962 | -1,19 | 556 | 0,36 | ||||
| 2026-02-05 | 13F | HFM Investment Advisors, LLC | 5 | 0,00 | 0 | |||||
| 2026-01-28 | 13F | Arizona State Retirement System | 8.131 | -6,49 | 649 | -4,84 | ||||
| 2026-02-10 | 13F/A | Northwestern Mutual Wealth Management Co | 1.384 | 117,95 | 110 | 124,49 | ||||
| 2026-02-11 | 13F | Simplex Trading, Llc | Call | 300 | 24 | |||||
| 2025-11-14 | 13F | Point72 Hong Kong Ltd | 262 | 21 | ||||||
| 2026-02-02 | 13F | Principal Financial Group Inc | 832.842 | -7,87 | 66.481 | -6,31 | ||||
| 2025-11-13 | 13F | Bank Of Montreal /can/ | 0 | -100,00 | 0 | |||||
| 2026-04-10 | 13F | PFW Advisors LLC | 3.274 | 0,00 | 306 | 17,24 | ||||
| 2026-02-17 | 13F | Signature Equity Partners, LLC | 10 | 1 | ||||||
| 2026-02-11 | 13F | Simplex Trading, Llc | 0 | -100,00 | 0 | |||||
| 2026-02-13 | 13F | SRS Capital Advisors, Inc. | 124 | -64,67 | 10 | -66,67 | ||||
| 2026-02-10 | 13F | Rothschild Investment Llc | 76 | 1,33 | 6 | 20,00 | ||||
| 2026-02-12 | 13F | New York State Common Retirement Fund | 9.156 | 0,00 | 731 | 1,67 | ||||
| 2026-02-13 | 13F | Umb Bank N A/mo | 288 | 4,35 | 23 | 4,76 | ||||
| 2025-11-21 | 13F/A | CIBC Bancorp USA Inc. | 2.943 | 231 | ||||||
| 2025-11-05 | 13F | AdvisorShares Investments LLC | 0 | -100,00 | 0 | -100,00 | ||||
| 2026-04-15 | 13F | Fortitude Family Office, LLC | 53 | 211,76 | 5 | 300,00 | ||||
| 2026-01-21 | 13F | Albion Financial Group /ut | 36 | 0,00 | 3 | 0,00 | ||||
| 2026-03-06 | 13F | Hsbc Holdings Plc | 0 | -100,00 | 0 | |||||
| 2026-02-13 | 13F | Landscape Capital Management, L.l.c. | 34.967 | 11,71 | 2.791 | 13,64 | ||||
| 2025-11-06 | 13F | Bryce Point Capital, LLC | 0 | -100,00 | 0 | |||||
| 2026-02-13 | 13F | Rhumbline Advisers | 74.190 | -7,47 | 5.922 | -5,91 | ||||
| 2026-02-11 | 13F | Hughes Financial Services, LLC | 100 | 0,00 | 8 | -12,50 | ||||
| 2026-02-17 | 13F | London Co Of Virginia | 0 | -100,00 | 0 | |||||
| 2026-02-13 | 13F | Edgestream Partners, L.P. | 35.712 | -56,29 | 2.851 | -55,56 | ||||
| 2026-02-12 | 13F | Ankerstar Wealth, LLC | 4 | 0 | ||||||
| 2025-11-06 | 13F | Ameritas Advisory Services, LLC | 0 | -100,00 | 0 | -100,00 | ||||
| 2026-02-12 | 13F | Steward Partners Investment Advisory, Llc | 5.779 | 2,39 | 461 | 4,06 | ||||
| 2026-02-13 | 13F | Cynosure Management, Llc | 5.566 | -14,12 | 444 | -12,60 | ||||
| 2026-02-13 | 13F | First Trust Advisors Lp | 81.962 | 172,04 | 6.542 | 176,73 | ||||
| 2026-02-12 | 13F | Federated Hermes, Inc. | 341 | -42,98 | 27 | -41,30 | ||||
| 2026-02-17 | 13F | Fmr Llc | 458.994 | 0,11 | 36.637 | 1,81 | ||||
| 2026-02-17 | 13F | ExodusPoint Capital Management, LP | 0 | -100,00 | 0 | -100,00 | ||||
| 2026-02-03 | 13F | Costello Asset Management, INC | 300 | 0,00 | 24 | 0,00 | ||||
| 2026-02-02 | 13F | Pittenger & Anderson Inc | 7 | 1 | ||||||
| 2026-01-30 | 13F | Us Bancorp \de\ | 5.982 | -9,81 | 477 | -8,27 | ||||
| 2026-02-12 | 13F | Voya Investment Management Llc | 286.584 | 1,31 | 22.875 | 3,03 | ||||
| 2026-02-17 | 13F | Russell Investments Group, Ltd. | 2.233 | -31,88 | 178 | -30,74 | ||||
| 2026-02-05 | 13F | Cambridge Investment Research Advisors, Inc. | 3.480 | 4,13 | 0 | |||||
| 2026-01-28 | 13F | Klp Kapitalforvaltning As | 6.300 | -10,00 | 503 | -8,56 | ||||
| 2026-02-11 | 13F | Cerity Partners LLC | 5.489 | -24,56 | 438 | -23,29 | ||||
| 2026-02-13 | 13F | Manufacturers Life Insurance Company, The | 0 | -100,00 | 0 | |||||
| 2026-02-09 | 13F | 12th Street Asset Management Company, LLC | 61.918 | 0,41 | 4.942 | 2,11 | ||||
| 2026-02-10 | 13F | Godfrey Financial Associates, Inc. | 8 | 1 | ||||||
| 2026-02-17 | 13F | Freestone Grove Partners LP | 4.633 | -60,06 | 370 | -59,45 | ||||
| 2026-01-28 | 13F | Teacher Retirement System Of Texas | 0 | -100,00 | 0 | |||||
| 2026-02-10 | 13F | Axq Capital, Lp | 5.063 | 404 | ||||||
| 2025-11-14 | 13F | Strategic Wealth Partners, Ltd. | 100 | 0,00 | 8 | 0,00 | ||||
| 2026-02-09 | 13F | Hartland & Co., LLC | 138 | 0,00 | 11 | 10,00 | ||||
| 2026-02-17 | 13F | Armistice Capital, Llc | 4.700 | -10,53 | 375 | -8,98 | ||||
| 2026-01-23 | 13F | Evolution Advisers, Inc. | 103 | 0,00 | 0 | |||||
| 2026-04-02 | 13F | MJT & Associates Financial Advisory Group, Inc. | 23 | -51,06 | 2 | -33,33 | ||||
| 2026-04-13 | 13F | IFP Advisors, Inc | 1.053 | 0,00 | 98 | 16,67 | ||||
| 2026-01-29 | 13F | Teachers Retirement System Of The State Of Kentucky | 6.949 | -7,49 | 1 | |||||
| 2026-02-12 | 13F | Hrt Financial Lp | 54.320 | 1.986,02 | 4 | |||||
| 2026-02-10 | 13F | Argent Trust Co | 3.318 | -17,42 | 265 | -16,19 | ||||
| 2026-02-19 | 13F | CI Private Wealth, LLC | 9.499 | 63,13 | 758 | 65,86 | ||||
| 2026-02-06 | 13F | Vestmark Advisory Solutions, Inc. | 43.632 | -5,65 | 3.483 | -4,05 | ||||
| 2026-02-17 | 13F | Ancora Advisors, LLC | 1.645 | 0,00 | 131 | 1,55 | ||||
| 2026-02-17 | 13F | Aqr Capital Management Llc | 34.173 | 22,21 | 2.728 | 24,29 | ||||
| 2026-01-28 | 13F | Salomon & Ludwin, LLC | 238 | 83,08 | 20 | 100,00 | ||||
| 2025-11-13 | 13F | Riggs Asset Managment Co. Inc. | 0 | -100,00 | 0 | |||||
| 2026-02-05 | 13F | Atria Investments Llc | 30.778 | -3,37 | 2.457 | -1,76 | ||||
| 2026-02-03 | 13F | Everence Capital Management Inc | 4.230 | 0,00 | 0 | |||||
| 2026-02-13 | 13F | Pathstone Holdings, LLC | 12.844 | -5,63 | 1.025 | -4,03 | ||||
| 2026-02-05 | 13F | Amalgamated Bank | 8.010 | 2,08 | 1 | |||||
| 2026-04-06 | 13F | GAMMA Investing LLC | 2.115 | 13,59 | 198 | 33,11 | ||||
| 2026-02-10 | 13F | Commonwealth Of Pennsylvania Public School Empls Retrmt Sys | 6.826 | -2,78 | 545 | -1,27 | ||||
| 2026-04-21 | 13F | Wesbanco Bank Inc | 9.159 | 0,00 | 856 | 17,10 | ||||
| 2026-04-07 | 13F | Farther Finance Advisors, LLC | 226 | 3,67 | 21 | 23,53 | ||||
| 2026-02-17 | 13F | Tudor Investment Corp Et Al | 73.115 | 6,63 | 5.836 | 8,44 | ||||
| 2026-02-13 | 13F | Verition Fund Management LLC | 18.119 | -70,99 | 1.446 | -70,51 | ||||
| 2025-11-14 | 13F | Zurich Insurance Group Ltd/FI | 0 | -100,00 | 0 | |||||
| 2026-02-12 | 13F | Federation des caisses Desjardins du Quebec | 9 | 0,00 | 1 | |||||
| 2026-02-17 | 13F | Schonfeld Strategic Advisors LLC | 3.179 | -88,74 | 254 | -88,58 | ||||
| 2025-11-06 | 13F | Whipplewood Advisors, LLC | 0 | -100,00 | 0 | |||||
| 2026-01-21 | 13F | Flagship Harbor Advisors, Llc | 268 | 21 | ||||||
| 2026-02-17 | 13F | State Of Wisconsin Investment Board | 7.581 | -18,82 | 605 | -17,46 | ||||
| 2026-02-12 | 13F | Wealthspire Advisors, LLC | 0 | -100,00 | 0 | |||||
| 2026-02-17 | 13F | Two Sigma Advisers, Lp | 101.100 | -7,25 | 8.070 | -5,68 | ||||
| 2025-11-14 | 13F | Point72 Europe (London) LLP | 1.065 | 84 | ||||||
| 2026-02-06 | 13F | Envestnet Portfolio Solutions, Inc. | 4.213 | 3,26 | 336 | 5,00 | ||||
| 2026-02-11 | 13F | Deutsche Bank Ag\ | 26.347 | -69,17 | 2.103 | -68,64 | ||||
| 2026-01-02 | 13F | Global Wealth Strategies & Associates | 0 | -100,00 | 0 | |||||
| 2026-02-10 | 13F | State of Wyoming | 3.729 | -28,59 | 298 | -27,38 | ||||
| 2025-11-14 | 13F | Texas Permanent School Fund | 0 | -100,00 | 0 | |||||
| 2026-02-12 | 13F | Brinker Capital Investments, LLC | 6.168 | -14,11 | 492 | -12,61 | ||||
| 2026-04-23 | 13F | SJS Investment Consulting Inc. | 10 | 42,86 | 1 | |||||
| 2025-10-30 | 13F | Twin Peaks Wealth Advisors, LLC | 0 | -100,00 | 0 | |||||
| 2026-02-12 | 13F | Cibc World Markets Corp | 0 | -100,00 | 0 | |||||
| 2026-02-13 | 13F | Quattro Advisors LLC | 66 | 5 | ||||||
| 2026-02-06 | 13F | Covestor Ltd | 2 | 0,00 | 0 | |||||
| 2026-02-13 | 13F | Quarry LP | 11 | -88,42 | 1 | -100,00 | ||||
| 2026-02-17 | 13F | Delaware Management Holdings, Inc. | 529.072 | 42.231 | ||||||
| 2025-11-14 | 13F | Natixis | 0 | -100,00 | 0 | |||||
| 2026-04-22 | 13F | Fort Washington Investment Advisors Inc /oh/ | 0 | -100,00 | 0 | |||||
| 2026-02-13 | 13F | Entropy Technologies, LP | 4.757 | 69,89 | 380 | 73,06 | ||||
| 2026-02-17 | 13F | Grantham, Mayo, Van Otterloo & Co. LLC | 186.909 | -40,95 | 14.919 | -39,95 | ||||
| 2026-02-06 | 13F | EverSource Wealth Advisors, LLC | 372 | -14,48 | 30 | -14,71 | ||||
| 2026-02-02 | 13F | Millstone Evans Group, LLC | 104 | 0,00 | 8 | 0,00 | ||||
| 2026-02-09 | 13F | Legal & General Group Plc | 74.466 | -4,71 | 5.944 | -3,10 | ||||
| 2026-01-21 | 13F | Azzad Asset Management Inc /adv | 14.631 | 2,71 | 1.168 | 4,38 | ||||
| 2025-11-13 | 13F | Mackenzie Financial Corp | 0 | -100,00 | 0 | |||||
| 2025-11-14 | 13F | Mount Yale Investment Advisors, LLC | 0 | -100,00 | 0 | -100,00 | ||||
| 2026-02-09 | 13F | Geode Capital Management, Llc | 638.414 | 0,24 | 50.968 | 1,94 | ||||
| 2026-02-12 | 13F | Quadrant Capital Group Llc | 190 | 0,00 | 15 | 7,14 | ||||
| 2026-02-13 | 13F | Police & Firemen's Retirement System of New Jersey | 7.317 | -6,24 | 584 | -4,58 | ||||
| 2026-01-29 | 13F | Comerica Bank | 28.299 | -10,99 | 2.259 | -9,50 | ||||
| 2026-02-13 | 13F | Fieldview Capital Management, LLC | 7.470 | -18,86 | 596 | -17,45 | ||||
| 2026-02-14 | 13F | Rockefeller Capital Management L.P. | 1.162 | 96,62 | 93 | 100,00 | ||||
| 2026-02-09 | 13F | Huntington National Bank | 1 | 0,00 | 0 | |||||
| 2026-02-13 | 13F | Great West Life Assurance Co /can/ | 24.040 | -28,37 | 2 | -50,00 | ||||
| 2026-02-11 | 13F | Heartland Advisors Inc | 37.803 | -11,70 | 3.017 | -10,21 | ||||
| 2026-02-17 | 13F | Susquehanna International Group, Llp | 3.622 | 289 | ||||||
| 2026-02-17 | 13F | Susquehanna International Group, Llp | Call | 3.500 | 279 | |||||
| 2026-02-17 | 13F | Price T Rowe Associates Inc /md/ | 26.851 | -2,63 | 2 | 0,00 | ||||
| 2026-02-17 | 13F | Voloridge Investment Management, Llc | 169.090 | -23,80 | 13.497 | -22,51 | ||||
| 2026-01-23 | 13F | Optima Capital Llc | 2 | 0 | ||||||
| 2026-02-17 | 13F | Public Employees Retirement System Of Ohio | 444 | -4,31 | 35 | -2,78 | ||||
| 2026-02-10 | 13F | Lummis Asset Management, LP | 42.932 | -2,98 | 3.427 | -1,35 | ||||
| 2026-02-06 | 13F | Tortoise Investment Management, LLC | 0 | -100,00 | 0 | |||||
| 2026-04-20 | 13F | Jfs Wealth Advisors, Llc | 80 | 6,67 | 7 | 40,00 | ||||
| 2026-02-17 | 13F | Kemnay Advisory Services Inc. | 1.017 | 81 | ||||||
| 2026-01-28 | 13F | Universal- Beteiligungs- und Servicegesellschaft mbH | 4.724 | -2,44 | 384 | 0,79 | ||||
| 2026-04-24 | 13F | Root Financial Partners, LLC | 271 | 23,18 | 25 | 47,06 | ||||
| 2025-11-14 | 13F | Skopos Labs, Inc. | 0 | -100,00 | 0 | |||||
| 2026-04-21 | 13F | First United Bank Trust/ | 35 | 0,00 | 3 | 50,00 | ||||
| 2025-11-17 | 13F | PDT Partners, LLC | 0 | -100,00 | 0 | |||||
| 2026-04-22 | 13F | Sterling Capital Management LLC | 179 | -0,56 | 17 | 14,29 | ||||
| 2026-02-10 | 13F | Bnp Paribas Arbitrage, Sa | 38.131 | -59,93 | 3.044 | -59,25 | ||||
| 2026-02-06 | 13F | Van Hulzen Asset Management, LLC | 15.631 | -9,43 | 1.248 | -7,90 | ||||
| 2026-02-13 | 13F | Macquarie Group Ltd | 0 | -100,00 | 0 | |||||
| 2026-02-17 | 13F | Occudo Quantitative Strategies Lp | 0 | -100,00 | 0 | |||||
| 2026-02-09 | 13F | Coldstream Capital Management Inc | 2.934 | 234 | ||||||
| 2026-02-11 | 13F | Sunrise Financial Services, LLC | 22 | 2 | ||||||
| 2026-04-20 | 13F | State of Alaska, Department of Revenue | 13.610 | -3,05 | 1 | 0,00 | ||||
| 2026-02-10 | 13F | CIBC Asset Management Inc | 0 | -100,00 | 0 | |||||
| 2026-01-29 | 13F | UBS Group AG | 182.692 | -2,96 | 14.582 | -1,31 | ||||
| 2026-02-13 | 13F | JustInvest LLC | 4.627 | -0,19 | 369 | 1,65 | ||||
| 2025-11-14 | 13F | Bayesian Capital Management, LP | 0 | -100,00 | 0 | |||||
| 2026-02-12 | 13F | State Board Of Administration Of Florida Retirement System | 8.841 | 0,00 | 706 | 1,73 | ||||
| 2026-04-06 | 13F | Versant Capital Management, Inc | 696 | 0,00 | 65 | 18,18 | ||||
| 2026-04-20 | 13F | Ronald Blue Trust, Inc. | 0 | -100,00 | 0 | |||||
| 2026-02-13 | 13F | Resources Investment Advisors, LLC. | 13.958 | -2,84 | 1.114 | -1,15 | ||||
| 2026-02-13 | 13F | Victory Capital Management Inc | 11.637 | -4,45 | 929 | -2,83 | ||||
| 2026-02-02 | 13F | Cornerstone Planning Group LLC | 68 | 655,56 | 6 | |||||
| 2026-04-22 | 13F | Janney Montgomery Scott LLC | 0 | -100,00 | 0 | |||||
| 2026-02-17 | 13F | Altshuler Shaham Ltd | 49 | -12,50 | 4 | -25,00 | ||||
| 2026-02-17 | 13F | Engineers Gate Manager LP | 5.489 | -56,70 | 438 | -55,98 | ||||
| 2026-02-10 | 13F | Natixis Advisors, L.p. | 17.002 | 24,14 | 1 | 0,00 | ||||
| 2026-02-12 | 13F | IFC Advisors LLC | 2.560 | -5,81 | 204 | -4,23 | ||||
| 2026-01-29 | 13F | Vanguard Group Inc | 2.937.552 | -0,62 | 234.475 | 1,07 | ||||
| 2026-01-20 | 13F | Wall Street Access Asset Management, LLC | 354 | 0,00 | 28 | 3,70 | ||||
| 2026-02-06 | 13F | Global Retirement Partners, LLC | 351 | -8,12 | 28 | -3,45 | ||||
| 2026-04-24 | 13F | Key FInancial Inc | 107 | 0,00 | 10 | 25,00 | ||||
| 2026-02-13 | 13F | Charles Schwab Investment Management Inc | 366.870 | -0,50 | 29.284 | 1,19 | ||||
| 2025-11-12 | 13F | Simplex Trading, Llc | Put | 0 | -100,00 | 0 | ||||
| 2026-02-17 | 13F | Mirabella Financial Services Llp | 2.955 | 236 | ||||||
| 2026-02-17 | 13F | Mercer Global Advisors Inc /adv | 11.475 | -6,59 | 916 | -5,08 | ||||
| 2026-02-13 | 13F | Lansdowne Partners (uk) Llp | 529.718 | -0,07 | 42.282 | 1,62 | ||||
| 2026-02-13 | 13F | Kestra Advisory Services, LLC | 2.209 | 176 | ||||||
| 2026-02-17 | 13F | Ameriprise Financial Inc | 63.645 | -5,33 | 5.080 | -3,71 | ||||
| 2026-02-13 | 13F | Barclays Plc | 44.311 | 12,01 | 3.537 | 13,88 | ||||
| 2026-02-17 | 13F | Raymond James Financial Inc | 833.698 | -8,97 | 67.236 | -6,47 | ||||
| 2026-02-13 | 13F | Citigroup Inc | 40.663 | 276,13 | 3.246 | 282,67 | ||||
| 2026-02-17 | 13F | Wellington Management Group Llp | 0 | -100,00 | 0 | |||||
| 2026-02-17 | 13F | Capstone Investment Advisors, Llc | 14.815 | -18,20 | 1.183 | -16,82 | ||||
| 2026-04-16 | 13F | Capital Advisors, Ltd. LLC | 10 | 0,00 | 0 | |||||
| 2026-02-17 | 13F | Atom Investors LP | 0 | -100,00 | 0 | |||||
| 2025-11-14 | 13F | Gotham Asset Management, LLC | 0 | -100,00 | 0 | -100,00 | ||||
| 2026-02-13 | 13F | Kayne Anderson Rudnick Investment Management Llc | 6.090.269 | -7,08 | 486.125 | -5,51 | ||||
| 2026-02-09 | 13F | Hantz Financial Services, Inc. | 656 | 320,51 | 0 | |||||
| 2025-11-14 | 13F | Uniplan Investment Counsel, Inc. | 0 | -100,00 | 0 | |||||
| 2026-02-17 | 13F | SageView Advisory Group, LLC | 41 | 3 | ||||||
| 2026-01-23 | 13F | Assetmark, Inc | 4 | 0,00 | 0 | |||||
| 2026-02-12 | 13F | Campbell & CO Investment Adviser LLC | 41.545 | 114,85 | 3.316 | 118,59 | ||||
| 2026-02-13 | 13F | Boyar Asset Management Inc. | 11.497 | -28,03 | 918 | -26,82 | ||||
| 2026-02-12 | 13F | BlackRock, Inc. | 4.022.536 | 1,22 | 321.079 | 2,94 | ||||
| 2026-01-26 | 13F | Private Trust Co Na | 283 | 14,57 | 23 | 15,79 | ||||
| 2026-01-26 | 13F | Cwm, Llc | 9.142 | -14,05 | 1 | |||||
| 2025-11-12 | 13F | Berry Wealth Group, LP | 0 | -100,00 | 0 | |||||
| 2025-12-18 | 13F | Danske Bank A/s | 0 | -100,00 | 0 | |||||
| 2026-04-20 | 13F | Louisiana State Employees Retirement System | 12.200 | -3,17 | 1.140 | 13,43 | ||||
| 2026-02-10 | 13F | Goldman Sachs Group Inc | 303.957 | 54,99 | 24.262 | 57,61 | ||||
| 2026-04-13 | 13F | True Wealth Design, LLC | 8 | 0,00 | 1 | |||||
| 2026-02-11 | 13F | Livforsakringsbolaget Skandia, Omsesidigt | 0 | -100,00 | 0 | |||||
| 2026-02-17 | 13F | Hancock Whitney Corp | 3.445 | 4,71 | 275 | 6,20 | ||||
| 2026-02-17 | 13F | Captrust Financial Advisors | 3.455 | 0,99 | 276 | 2,61 | ||||
| 2026-02-23 | 13F | Virtu Financial LLC | 7.980 | 1 | ||||||
| 2026-04-13 | 13F | Massmutual Trust Co Fsb/adv | 141 | 0,00 | 13 | 18,18 | ||||
| 2026-02-13 | 13F | Smartleaf Asset Management LLC | 1.665 | 2,71 | 136 | 8,80 | ||||
| 2026-02-17 | 13F | Glenmede Trust Co Na | 10.429 | 12,28 | 832 | 30,61 | ||||
| 2026-02-13 | 13F | Solstein Capital, LLC | 114 | 0,00 | 9 | 12,50 | ||||
| 2026-02-13 | 13F | Stifel Financial Corp | 64.095 | -7,52 | 5.116 | -5,94 | ||||
| 2026-01-23 | 13F | Burney Co/ | 37.407 | 0,13 | 2.986 | 1,81 | ||||
| 2026-02-09 | 13F | Quest Partners LLC | 3.531 | 65,00 | 282 | 68,26 | ||||
| 2026-04-22 | 13F | Pictet Asset Management Holding SA | 5.058 | 43,94 | 473 | 68,57 | ||||
| 2026-02-12 | 13F | CIBC Private Wealth Group, LLC | 106 | 6,00 | 8 | 14,29 | ||||
| 2026-02-12 | 13F | Brown Brothers Harriman & Co | 159 | -51,52 | 13 | -52,00 | ||||
| 2026-02-17 | 13F | Man Group plc | 0 | -100,00 | 0 | -100,00 | ||||
| 2026-02-12 | 13F | Jane Street Group, Llc | 0 | -100,00 | 0 | |||||
| 2026-02-17 | 13F | Maryland State Retirement & Pension System | 4.007 | 1,11 | 320 | 2,57 | ||||
| 2026-02-10 | 13F | Mutual Of America Capital Management Llc | 3.151 | 2,04 | 252 | 3,72 | ||||
| 2026-02-17 | 13F | Quantinno Capital Management LP | 9.110 | 74,39 | 727 | 77,32 | ||||
| 2026-01-30 | 13F | Bogart Wealth, LLC | 100 | 0,00 | 8 | 0,00 | ||||
| 2026-02-05 | 13F | Allworth Financial LP | 562 | 11,29 | 45 | 12,82 | ||||
| 2026-02-05 | 13F | WealthPlan Investment Management, LLC | 14.752 | -3,86 | 1.178 | -2,24 | ||||
| 2026-02-11 | 13F | Jpmorgan Chase & Co | 535.416 | -35,57 | 42.737 | -34,48 | ||||
| 2026-02-02 | 13F | Truist Financial Corp | 5.885 | 8,26 | 470 | 10,09 | ||||
| 2026-04-17 | 13F | Vermillion Wealth Management, Inc. | 4 | 0 | ||||||
| 2026-02-06 | 13F | Quantum Private Wealth, LLC | 11.683 | 0,00 | 933 | 1,75 | ||||
| 2026-02-12 | 13F | Callan Family Office, LLC | 86.832 | -1,54 | 6.931 | 0,12 | ||||
| 2026-02-06 | 13F | Bare Financial Services, Inc | 55 | 0,00 | 4 | 0,00 | ||||
| 2026-02-11 | 13F | Ameritas Investment Partners, Inc. | 2.307 | 184 | ||||||
| 2026-02-06 | 13F | Handelsbanken Fonder AB | 9.400 | 0,00 | 1 | |||||
| 2026-02-09 | 13F | Keating Financial Advisory Services, Inc. | 206 | 16 | ||||||
| 2026-01-15 | 13F | Nisa Investment Advisors, Llc | 624 | -2,19 | 50 | -2,00 | ||||
| 2026-02-02 | 13F | Fifth Third Bancorp | 75 | 11,94 | 6 | 0,00 | ||||
| 2026-01-27 | 13F | Zurcher Kantonalbank (Zurich Cantonalbank) | 6.842 | 13,96 | 546 | 15,92 | ||||
| 2026-02-17 | 13F | Lighthouse Investment Partners, LLC | 16.251 | 1.297 | ||||||
| 2026-02-17 | 13F | MIRAE ASSET GLOBAL ETFS HOLDINGS Ltd. | 12.836 | 0,08 | 1.025 | 1,79 | ||||
| 2026-02-11 | 13F | Parallel Advisors, LLC | 104 | 188,89 | 8 | 300,00 | ||||
| 2026-02-13 | 13F | Caitong International Asset Management Co., Ltd | 0 | -100,00 | 0 | |||||
| 2026-04-23 | 13F | Private Wealth Management Group, LLC | 62 | 0,00 | 6 | 25,00 | ||||
| 2026-02-13 | 13F | Neuberger Berman Group LLC | 429.674 | 279,00 | 34.297 | 285,43 | ||||
| 2026-02-05 | 13F | Dana Investment Advisors, Inc. | 11.043 | -12,06 | 881 | -10,56 | ||||
| 2026-02-17 | 13F | Balyasny Asset Management Llc | 46.451 | -52,22 | 3.708 | -51,42 | ||||
| 2026-02-12 | 13F | Nuveen, LLC | 67.450 | -2,76 | 5.384 | -1,12 | ||||
| 2026-02-17 | 13F | Optiver Holding B.V. | 6 | -94,69 | 0 | -100,00 | ||||
| 2026-02-17 | 13F | Qube Research & Technologies Ltd | 7.400 | 591 | ||||||
| 2026-02-10 | 13F | Norges Bank | 83.513 | 6.666 | ||||||
| 2026-04-07 | 13F | Signaturefd, Llc | 331 | 34,55 | 31 | 57,89 | ||||
| 2025-11-07 | 13F | Amica Retiree Medical Trust | 6.281 | 0,00 | 0 | |||||
| 2026-01-30 | 13F | New York State Teachers Retirement System | 6.131 | -1,60 | 0 | |||||
| 2026-02-13 | 13F | Mml Investors Services, Llc | 4.723 | 17,66 | 377 | 19,68 | ||||
| 2026-02-13 | 13F | Lord, Abbett & Co. Llc | 337.447 | -13,31 | 27 | -13,33 | ||||
| 2026-02-09 | 13F | Fisher Asset Management, LLC | 661.099 | -6,11 | 52.769 | -4,52 | ||||
| 2026-02-17 | 13F | Tower Research Capital LLC (TRC) | 2.265 | 85,96 | 181 | 89,47 | ||||
| 2026-02-03 | 13F | SBI Securities Co., Ltd. | 49 | 0,00 | 4 | 0,00 | ||||
| 2026-02-17 | 13F | Dark Forest Capital Management Lp | 0 | -100,00 | 0 | |||||
| 2026-02-17 | 13F | Millennium Management Llc | 55.228 | 1.041,31 | 4.408 | 1.063,06 | ||||
| 2026-02-12 | 13F | Marsico Capital Management Llc | 100.319 | 0,00 | 8.007 | 1,69 | ||||
| 2026-02-12 | 13F | MetLife Investment Management, LLC | 15.152 | -6,21 | 1.209 | -4,65 | ||||
| 2026-01-30 | 13F/A | M&t Bank Corp | 18.652 | -10,39 | 1.488 | -8,88 | ||||
| 2026-02-13 | 13F | Ubs Asset Management Americas Inc | 56.497 | -3,47 | 4.510 | -1,83 | ||||
| 2026-02-13 | 13F | BNP Paribas Asset Management Holding S.A. | 373 | 36,63 | 0 | |||||
| 2026-02-17 | 13F | Guggenheim Capital Llc | 7.189 | 574 | ||||||
| 2026-02-13 | 13F | Integrated Wealth Concepts LLC | 3.740 | -52,10 | 299 | -51,31 | ||||
| 2025-11-12 | 13F | NewSquare Capital LLC | 0 | -100,00 | 0 | |||||
| 2026-02-17 | 13F | Advisor Group Holdings, Inc. | 1.122 | -6,73 | 90 | -4,30 | ||||
| 2026-02-17 | 13F | Aquatic Capital Management LLC | 18.783 | -61,04 | 1.499 | -60,38 | ||||
| 2025-11-13 | 13F | Winton Capital Group Ltd | 0 | -100,00 | 0 | |||||
| 2026-04-08 | 13F | Heritage Family Offices, LLP | 0 | -100,00 | 0 | |||||
| 2026-02-13 | 13F | Pinnacle Wealth Planning Services, Inc. | 482 | 38 | ||||||
| 2026-02-17 | 13F | Lotus Technology Management, LP | 8.591 | 686 | ||||||
| 2026-01-26 | 13F | KBC Group NV | 1.209 | 0,00 | 0 | |||||
| 2026-02-03 | 13F | NewEdge Wealth, LLC | 44.564 | -5,35 | 3.557 | -3,53 | ||||
| 2026-02-06 | 13F | HighTower Advisors, LLC | 6.232 | -4,20 | 497 | -2,55 | ||||
| 2025-11-12 | 13F | Fox Run Management, L.l.c. | 0 | -100,00 | 0 | |||||
| 2025-11-14 | 13F | Teza Capital Management LLC | 0 | -100,00 | 0 | |||||
| 2026-02-12 | 13F | Colonial Trust Co / SC | 1.171 | 0,00 | 93 | 2,20 | ||||
| 2026-02-17 | 13F | Amundi | 4.631 | -2,91 | 370 | -4,40 | ||||
| 2025-11-07 | 13F | Readystate Asset Management Lp | 0 | -100,00 | 0 | |||||
| 2026-02-12 | 13F | Commonwealth Equity Services, Llc | 5.123 | -3,87 | 409 | |||||
| 2026-04-17 | 13F | Sovereign Financial Group, Inc. | 2.759 | 0,18 | 258 | 17,35 | ||||
| 2026-04-23 | 13F | Farmers & Merchants Investments Inc | 15 | 0,00 | 1 | 0,00 | ||||
| 2026-02-17 | 13F | Brevan Howard Capital Management LP | 0 | -100,00 | 0 | |||||
| 2026-02-13 | 13F | Kilter Group LLC | 31 | 0,00 | 2 | 0,00 | ||||
| 2026-02-18 | 13F | SkyView Investment Advisors, LLC | 17.101 | -0,50 | 1 | 0,00 | ||||
| 2026-02-18 | 13F | State of Tennessee, Treasury Department | 6.288 | -7,32 | 610 | 14,47 | ||||
| 2026-01-26 | 13F | Whittier Trust Co Of Nevada Inc | 1.404 | -1,82 | 122 | 5,22 | ||||
| 2026-02-10 | 13F | Bank of New York Mellon Corp | 268.169 | -19,87 | 21.405 | -18,51 | ||||
| 2026-02-02 | 13F | Benjamin Edwards Inc | 3.835 | 5,79 | 306 | 7,75 | ||||
| 2026-02-06 | 13F | ProShare Advisors LLC | 5.368 | 3,19 | 428 | 4,90 | ||||
| 2026-02-11 | 13F | Franklin Resources Inc | 24.320 | -95,00 | 1.941 | -92,61 | ||||
| 2026-04-22 | 13F | Apollon Wealth Management, LLC | 7.392 | -0,88 | 691 | 16,13 | ||||
| 2026-02-17 | 13F | Creative Planning | 13.334 | 59,73 | 1.064 | 62,44 | ||||
| 2026-02-10 | 13F | Intech Investment Management Llc | 21.423 | 93,40 | 1.710 | 96,66 | ||||
| 2026-02-17 | 13F | Jones Financial Companies Lllp | 1.338 | 284,48 | 107 | 307,69 | ||||
| 2026-02-17 | 13F | SummitTX Capital, L.P. | 14.418 | -34,80 | 1.151 | -33,72 | ||||
| 2026-02-13 | 13F | Prudential Financial Inc | 25.690 | -6,58 | 2.051 | -5,00 | ||||
| 2026-02-13 | 13F | American Century Companies Inc | 22.449 | -83,54 | 1.792 | -83,27 | ||||
| 2026-02-17 | 13F | California State Teachers Retirement System | 28.340 | -0,21 | 2.262 | 1,48 | ||||
| 2026-02-17 | 13F | Advisory Services Network, LLC | 3.755 | 300 | ||||||
| 2026-02-11 | 13F | Los Angeles Capital Management Llc | 166 | 13 | ||||||
| 2026-01-21 | 13F | Mayfair Advisory Group, LLC | 0 | -100,00 | 0 | |||||
| 2026-02-13 | 13F | Mariner, LLC | 8.822 | -11,89 | 702 | -10,57 | ||||
| 2026-02-06 | 13F | Gsa Capital Partners Llp | 0 | -100,00 | 0 | |||||
| 2025-11-13 | 13F | Clear Street Markets Llc | 0 | -100,00 | 0 | |||||
| 2026-02-17 | 13F | D. E. Shaw & Co., Inc. | 115.142 | -14,68 | 9.191 | -13,23 | ||||
| 2026-02-09 | 13F | CBIZ Investment Advisory Services, LLC | 122 | 10 | ||||||
| 2026-02-17 | 13F | Private Advisor Group, LLC | 2.536 | 202 | ||||||
| 2026-02-13 | 13F | Marshall Wace, Llp | 10.454 | 834 | ||||||
| 2026-01-21 | 13F | Sound Income Strategies, LLC | 114 | 11 | ||||||
| 2026-04-23 | 13F | Marquette Asset Management, LLC | 35 | 66,67 | 3 | 200,00 | ||||
| 2026-02-17 | 13F | Magnetar Financial LLC | 3.246 | 259 | ||||||
| 2026-01-14 | 13F | Hennion & Walsh Asset Management, Inc. | 4.047 | -1,32 | 323 | 0,62 | ||||
| 2026-02-12 | 13F | Principal Securities, Inc. | 0 | -100,00 | 0 | |||||
| 2026-02-11 | 13F | O'shaughnessy Asset Management, Llc | 9.305 | 12,42 | 743 | 14,33 | ||||
| 2026-02-17 | 13F | Janus Henderson Group Plc | 14.156 | 0,00 | 1.131 | 1,71 | ||||
| 2026-02-11 | 13F | Manchester Capital Management LLC | 23 | 2 | ||||||
| 2025-10-27 | 13F | Klingman & Associates, LLC | 0 | -100,00 | 0 | |||||
| 2026-02-17 | 13F | Bank Of America Corp /de/ | 251.332 | -7,92 | 20.061 | -6,35 | ||||
| 2026-04-08 | 13F | DiNuzzo Private Wealth, Inc. | 16 | 0,00 | 1 | 0,00 | ||||
| 2026-02-12 | 13F | Cloud Capital Management, LLC | 0 | -100,00 | 0 | |||||
| 2026-02-02 | 13F | Montag A & Associates Inc | 0 | -100,00 | 0 | |||||
| 2026-02-03 | 13F | McIlrath & Eck, LLC | 117 | 0,00 | 9 | 0,00 | ||||
| 2025-11-14 | 13F | Point72 (DIFC) Ltd | 3.700 | 290 | ||||||
| 2026-02-13 | 13F | State Street Corp | 1.051.378 | -1,28 | 83.921 | 0,39 | ||||
| 2026-02-05 | 13F | Thrivent Financial For Lutherans | 18.945 | -4,75 | 2 | 0,00 | ||||
| 2026-02-13 | 13F | Kennedy Capital Management, Inc. | 217.803 | 11,48 | 17.385 | 13,37 | ||||
| 2026-02-17 | 13F | Royal Bank Of Canada | 88.403 | -56,67 | 7.056 | -55,94 | ||||
| 2025-11-14 | 13F | WealthTrak Capital Management LLC | 0 | -100,00 | 0 | |||||
| 2026-02-10 | 13F | Quantbot Technologies LP | 10.968 | -72,22 | 875 | -71,76 | ||||
| 2025-11-21 | 13F | Nebula Research & Development LLC | 0 | -100,00 | 0 | |||||
| 2026-01-30 | 13F | Mitsubishi UFJ Trust & Banking Corp | 7.196 | -2,36 | 574 | -0,69 | ||||
| 2026-02-04 | 13F | LRI Investments, LLC | 110 | 0,00 | 9 | 0,00 | ||||
| 2026-02-11 | 13F | LPL Financial LLC | 39.387 | 1,05 | 3.144 | 2,75 | ||||
| 2026-02-13 | 13F | Squarepoint Ops LLC | 17.611 | -73,68 | 1.406 | -73,24 | ||||
| 2026-02-17 | 13F | Northern Trust Corp | 340.445 | -2,95 | 27.174 | -1,30 | ||||
| 2026-04-21 | 13F | Gilpin Wealth Management, Llc | 6 | 200,00 | 1 | |||||
| 2026-02-19 | 13F | Invesco Ltd. | 420.892 | -0,88 | 33.596 | 0,80 | ||||
| 2026-04-08 | 13F | Wealth Enhancement Advisory Services, Llc | 0 | -100,00 | 0 | |||||
| 2026-02-13 | 13F | Blueshift Asset Management, LLC | 4.676 | -80,51 | 373 | -80,18 | ||||
| 2026-01-30 | 13F | Simplicity Wealth,LLC | 4.185 | -4,73 | 334 | -2,91 | ||||
| 2025-11-14 | 13F | Weiss Asset Management LP | 0 | -100,00 | 0 | -100,00 | ||||
| 2026-02-17 | 13F | Susquehanna Portfolio Strategies, LLC | 47.805 | 3.816 | ||||||
| 2026-04-14 | 13F | Bay Harbor Wealth Management, LLC | 17 | 142,86 | 2 | |||||
| 2026-04-16 | 13F | SG Americas Securities, LLC | 15.412 | -29,82 | 1 | 0,00 | ||||
| 2026-01-14 | 13F | Spire Wealth Management | 0 | -100,00 | 0 | |||||
| 2026-04-24 | 13F | Petros Family Wealth, LLC | 3.569 | 5,50 | 334 | 23,33 | ||||
| 2026-02-04 | 13F | Atlantic Union Bankshares Corp | 2.224 | 0,00 | 178 | 1,72 | ||||
| 2026-01-12 | 13F | Rialto Wealth Management, LLC | 7 | 133,33 | 1 | |||||
| 2026-02-13 | 13F | First Washington CORP | 0 | -100,00 | 0 | |||||
| 2026-02-17 | 13F | Farringdon Capital, Ltd. | 3.044 | 243 | ||||||
| 2026-02-17 | 13F | Aster Capital Management (DIFC) Ltd | 969 | 10.666,67 | 77 | |||||
| 2026-02-10 | 13F | Envestnet Asset Management Inc | 210.749 | -13,97 | 16.822 | -12,51 | ||||
| 2026-02-17 | 13F | Wiley Bros.-aintree Capital, Llc | 48.770 | 2,83 | 3.893 | 4,45 | ||||
| 2026-02-17 | 13F | Point72 Asset Management, L.P. | 201.659 | -21,31 | 16.096 | -19,97 | ||||
| 2026-04-24 | 13F | Yousif Capital Management, Llc | 7.361 | -0,73 | 688 | 2,53 | ||||
| 2026-02-17 | 13F | Alliancebernstein L.p. | 53.363 | -2,30 | 4.259 | -0,65 | ||||
| 2026-02-13 | 13F | Wells Fargo & Company/mn | 796.217 | -3,41 | 63.554 | -1,77 | ||||
| 2026-02-13 | 13F | Sei Investments Co | 100.651 | -5,65 | 8.034 | -4,05 | ||||
| 2026-02-17 | 13F | Citadel Advisors Llc | Call | 10.500 | -25,00 | 838 | -23,68 | |||
| 2026-02-17 | 13F | Citadel Advisors Llc | 148.526 | 30,95 | 11.855 | 33,17 | ||||
| 2026-04-14 | 13F | Nbc Securities, Inc. | 5 | 0,00 | 0 | |||||
| 2025-10-28 | 13F | Leavell Investment Management, Inc. | 0 | -100,00 | 0 | |||||
| 2026-04-10 | 13F | Linden Thomas Advisory Services, LLC | 3.340 | -2,57 | 312 | 14,29 | ||||
| 2026-02-17 | 13F | Cetera Investment Advisers | 6.526 | -2,20 | 521 | -0,57 | ||||
| 2026-02-04 | 13F | Oregon Public Employees Retirement Fund | 6.300 | 1,61 | 503 | 3,29 | ||||
| 2026-02-10 | 13F | IFG Advisory, LLC | 5.441 | 434 | ||||||
| 2026-04-17 | 13F | Brown, Lisle/cummings, Inc. | 625 | 0,00 | 58 | 18,37 | ||||
| 2026-02-11 | 13F | Capital Research Global Investors | 1.465.000 | 8,52 | 116.936 | 10,36 | ||||
| 2026-02-13 | 13F | First National Bank Of Omaha | 6.936 | -2,13 | 554 | -0,54 | ||||
| 2026-02-17 | 13F | Voleon Capital Management Lp | 4.638 | -52,58 | 370 | -51,76 | ||||
| 2026-02-17 | 13F | Marin Bay Wealth Advisors, LLC | 2.564 | 205 | ||||||
| 2026-01-23 | 13F | Oak Ridge Investments Llc | 35.856 | -2,13 | 2.862 | -0,45 | ||||
| 2026-04-13 | 13F | Hm Payson & Co | 1.438 | 0,00 | 134 | 17,54 | ||||
| 2026-02-13 | 13F | Parkside Financial Bank & Trust | 12.280 | 0,07 | 980 | 1,77 | ||||
| 2026-02-17 | 13F | Trexquant Investment LP | 30.902 | 2.467 | ||||||
| 2026-02-05 | 13F | Bessemer Group Inc | 2.499 | 5,18 | 0 | |||||
| 2026-01-29 | 13F | Dunhill Financial, LLC | 1 | 0 | ||||||
| 2026-02-13 | 13F | Public Sector Pension Investment Board | 0 | -100,00 | 0 | |||||
| 2026-04-17 | 13F | Bell Investment Advisors, Inc | 130 | 0,00 | 12 | 20,00 | ||||
| 2026-02-11 | 13F | Illinois Municipal Retirement Fund | 14.879 | 4,74 | 1.188 | 6,55 | ||||
| 2026-02-17 | 13F | XTX Topco Ltd | 5.600 | 447 | ||||||
| 2026-02-12 | 13F | Dimensional Fund Advisors Lp | 1.531.309 | -0,31 | 122.237 | 1,39 | ||||
| 2026-02-12 | 13F | Swiss National Bank | 57.900 | 1,58 | 4.622 | 3,31 | ||||
| 2026-04-20 | 13F | Kestra Private Wealth Services, Llc | 3.817 | 0,26 | 357 | 17,49 | ||||
| 2026-02-17 | 13F | Two Sigma Investments, Lp | 251.733 | 26,05 | 20.093 | 28,19 | ||||
| 2026-01-27 | 13F | Regions Financial Corp | 106.223 | -0,90 | 8.479 | 0,77 | ||||
| 2026-01-27 | 13F | Tributary Capital Management, LLC | 212.851 | -6,95 | 16.990 | -5,37 | ||||
| 2026-01-29 | 13F | D.a. Davidson & Co. | 7.333 | 1,38 | 585 | 3,17 | ||||
| 2026-02-17 | 13F | Jump Financial, LLC | 9.358 | 747 | ||||||
| 2026-02-06 | 13F | Larson Financial Group LLC | 57 | 0,00 | 5 | 0,00 | ||||
| 2026-02-09 | 13F | Annis Gardner Whiting Capital Advisors, LLC | 15 | -16,67 | 1 | 0,00 | ||||
| 2026-02-13 | 13F | Morgan Stanley | 1.379.236 | 22,34 | 110.091 | 24,42 | ||||
| 2025-11-13 | 13F | Glenmede Investment Management, LP | 8.878 | -20,48 | 697 | -14,39 | ||||
| 2025-12-16 | 13F | Garde Capital, Inc. | 0 | -100,00 | 0 |
Other Listings
| DE:163 | 83,00 € |