Grundlæggende statistik
| Institutionelle ejere | 176 total, 176 long only, 0 short only, 0 long/short - change of -1,12% MRQ |
| Gennemsnitlig porteføljeallokering | 0.1482 % - change of -6,24% MRQ |
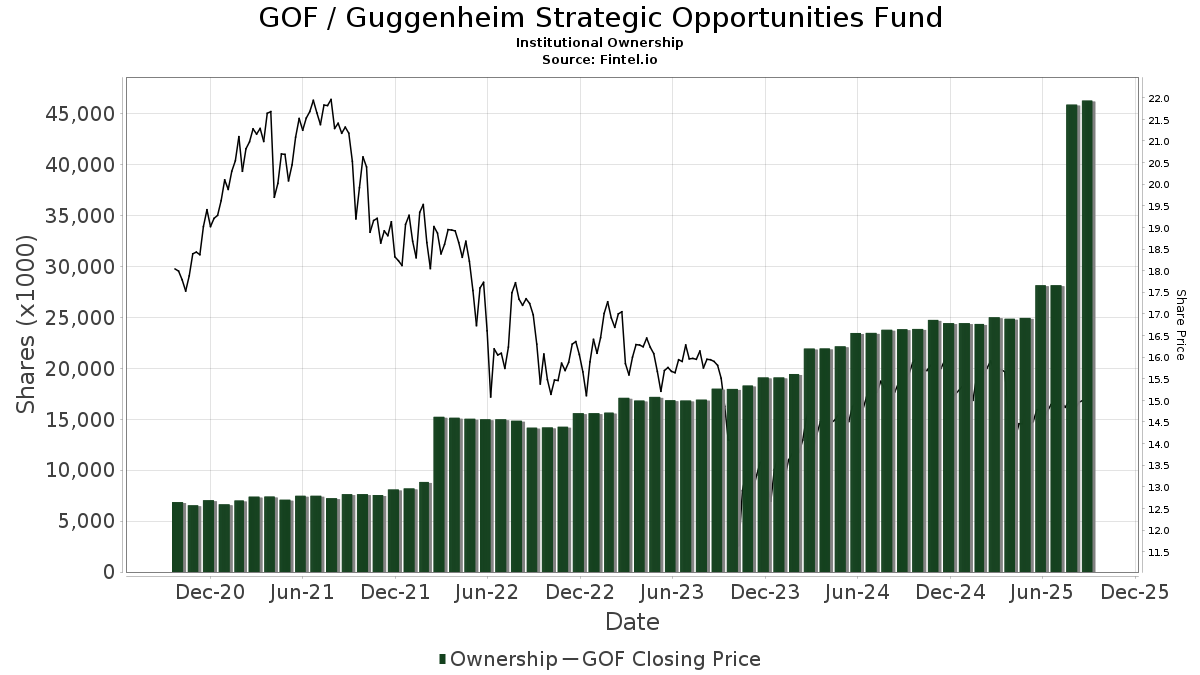
| Institutionelle aktier (lange) | 46.435.842 (ex 13D/G) - change of 18,27MM shares 64,85% MRQ |
| Institutionel værdi (lang) | $ 390.779 USD ($1000) |
Institutionelt ejerskab og aktionærer
Guggenheim Strategic Opportunities Fund (US:GOF) har 176 institutionelle ejere og aktionærer, der har indsendt 13D/G- eller 13F-formularer til Securities Exchange Commission (SEC). Disse institutioner har i alt 46,435,842 aktier. Største aktionærer omfatter Kingstone Capital Partners Texas, LLC, Morgan Stanley, LPL Financial LLC, Verus Capital Partners, Llc, UBS Group AG, Raymond James Financial Inc, Mml Investors Services, Llc, Advisor Group Holdings, Inc., Change Path, LLC, and Envestnet Asset Management Inc .
Guggenheim Strategic Opportunities Fund (NYSE:GOF) institutionel ejerskabsstruktur viser aktuelle positioner i virksomheden efter institutioner og fonde, samt seneste ændringer i positionsstørrelse. Større aktionærer kan omfatte individuelle investorer, investeringsforeninger, hedgefonde eller institutioner. Skema 13D angiver, at investoren besidder (eller besidder) mere end 5 % af virksomheden og har til hensigt (eller har til hensigt at) aktivt at forfølge en ændring i forretningsstrategi. Skema 13G indikerer en passiv investering på over 5%.
The share price as of September 11, 2025 is 15,00 / share. Previously, on September 12, 2024, the share price was 15,47 / share. This represents a decline of 3,04% over that period.
Fondens stemningsscore
Fund Sentiment Score (fka Ownership Accumulation Score) finder de aktier, der bliver mest købt af fonde. Det er resultatet af en sofistikeret, multi-faktor kvantitativ model, der identificerer virksomheder med de højeste niveauer af institutionel akkumulering. Scoringsmodellen bruger en kombination af den samlede stigning i oplyste ejere, ændringerne i porteføljeallokeringer i disse ejere og andre målinger. Tallet går fra 0 til 100, hvor højere tal indikerer et højere niveau af akkumulering for sine jævnaldrende, og 50 er gennemsnittet.
Opdateringsfrekvens: Dagligt
Se Ownership Explorer, som giver en liste over højest rangerende virksomheder.
Institutionel Put/Call-forhold
Ud over at indberette standardaktie- og gældsudstedelser skal institutter med mere end 100 mill. aktiver under forvaltning også oplyse deres put- og call-optionsbeholdninger. Da salgsoptioner generelt indikerer negativ stemning, og købsoptioner indikerer positiv stemning, kan vi få en fornemmelse af den overordnede institutionelle stemning ved at plotte forholdet mellem put og kald. Diagrammet til højre viser det historiske put/call-forhold for dette instrument.
Brug af Put/Call Ratio som en indikator for investorernes stemning overvinder en af de vigtigste mangler ved at bruge totalt institutionelt ejerskab, som er, at en betydelig mængde af aktiver under forvaltning investeres passivt for at spore indekser. Passivt forvaltede fonde køber typisk ikke optioner, så indikatoren for put/call-forholdet følger mere nøje følelsen af aktivt forvaltede fonde.
13F og NPORT arkivering
Detaljer om 13F-arkivering er gratis. Detaljer om NP-ansøgninger kræver et premium-medlemskab. Grønne rækker angiver nye positioner. Røde rækker angiver lukkede positioner. Klik på linket ikon for at se den fulde transaktionshistorik.
Opgrader
for at låse premium-data op og eksportere til Excel ![]() .
.
| Fil dato | Kilde | Investor | Type | Gennemsnitlig pris (Øst) |
Aktier | Δ Aktier (%) |
Rapporteret Værdi ($1000) |
Δ Værdi (%) |
Port Alloc (%) |
|
|---|---|---|---|---|---|---|---|---|---|---|
| 2025-07-09 | 13F | Dynamic Advisor Solutions LLC | 77.521 | 2,65 | 1.154 | -1,79 | ||||
| 2025-04-23 | 13F | Walkner Condon Financial Advisors LLC | 0 | -100,00 | 0 | |||||
| 2025-08-26 | 13F/A | Thrivent Financial For Lutherans | 0 | -100,00 | 0 | |||||
| 2025-07-14 | 13F | Bank & Trust Co | 32 | 0,00 | 0 | |||||
| 2025-07-08 | 13F | Nbc Securities, Inc. | 22.523 | 11,93 | 0 | |||||
| 2025-08-01 | 13F | Envestnet Asset Management Inc | 730.756 | 70,77 | 10.881 | 63,31 | ||||
| 2025-08-11 | 13F | Semus Wealth Partners LLC | 21.028 | -3,66 | 313 | -7,67 | ||||
| 2025-08-12 | 13F | Founders Financial Alliance, LLC | 112.171 | -1,83 | 1.670 | -6,07 | ||||
| 2025-07-15 | 13F | Kentucky Trust Co | 1.500 | 0,00 | 22 | -4,35 | ||||
| 2025-07-18 | 13F | PFG Investments, LLC | 73.707 | 2,48 | 1.097 | -1,97 | ||||
| 2025-08-14 | 13F | Integrated Wealth Concepts LLC | 207.675 | 11,52 | 3.092 | 6,66 | ||||
| 2025-08-07 | 13F | Verus Capital Partners, Llc | 1.877.230 | 19,36 | 27.952 | 14,15 | ||||
| 2025-07-14 | 13F | Capital CS Group, LLC | 21.441 | 3,96 | 319 | -0,62 | ||||
| 2025-07-21 | 13F | Empirical Financial Services, LLC d.b.a. Empirical Wealth Management | 14.539 | 0,00 | 216 | -4,42 | ||||
| 2025-07-18 | 13F | Truist Financial Corp | 316.322 | 42,60 | 4.710 | 36,40 | ||||
| 2025-07-21 | 13F | Ameriflex Group, Inc. | 695 | 2,66 | 10 | 0,00 | ||||
| 2025-08-13 | 13F | Baird Financial Group, Inc. | 199.877 | 11,09 | 2.976 | 6,25 | ||||
| 2025-08-08 | 13F | Avantax Advisory Services, Inc. | 78.710 | 2,39 | 1.172 | -2,09 | ||||
| 2025-07-10 | 13F | Sovran Advisors, LLC | 80.886 | -11,38 | 1.211 | -7,42 | ||||
| 2025-08-12 | 13F | J.w. Cole Advisors, Inc. | 19.747 | 22,24 | 294 | 17,13 | ||||
| 2025-07-29 | 13F | Private Trust Co Na | 713 | 0,00 | 11 | -9,09 | ||||
| 2025-04-21 | 13F | ORG Partners LLC | 0 | -100,00 | 0 | |||||
| 2025-08-04 | 13F | Daymark Wealth Partners, Llc | 12.301 | 183 | ||||||
| 2025-07-03 | 13F | Garde Capital, Inc. | 2.258 | 0,00 | 34 | -5,71 | ||||
| 2025-07-08 | 13F | Zrc Wealth Management, Llc | 0 | -100,00 | 0 | |||||
| 2025-08-27 | 13F/A | Brinker Capital Investments, LLC | 27.975 | 113,53 | 417 | 104,93 | ||||
| 2025-08-11 | 13F | Pin Oak Investment Advisors Inc | 3.122 | 3,51 | 0 | |||||
| 2025-05-14 | 13F | Semmax Financial Advisors Inc. | 0 | -100,00 | 0 | |||||
| 2025-08-14 | 13F | IHT Wealth Management, LLC | 11.015 | -2,55 | 164 | -6,29 | ||||
| 2025-07-22 | 13F | Firethorn Wealth Partners, Llc | 10.588 | 3,76 | 158 | -0,63 | ||||
| 2025-08-08 | 13F | Larson Financial Group LLC | 2.293 | 0,97 | 34 | -2,86 | ||||
| 2025-08-15 | 13F | Kestra Advisory Services, LLC | 128.699 | 198,03 | 1.916 | 185,12 | ||||
| 2025-05-19 | 13F | Smith Asset Management Co., LLC | 19.395 | 302 | ||||||
| 2025-08-05 | 13F | Tsfg, Llc | 11.900 | 0,08 | 0 | |||||
| 2025-07-31 | 13F | WFA Asset Management Corp | 21.660 | 28,94 | 323 | 34,17 | ||||
| 2025-08-11 | 13F | Perennial Investment Advisors, LLC | 19.489 | 21,97 | 290 | 16,94 | ||||
| 2025-08-11 | 13F | Private Advisor Group, LLC | 102.502 | 3,72 | 1.526 | -0,78 | ||||
| 2025-08-14 | 13F | UBS Group AG | 1.522.861 | 3,41 | 22.675 | -1,10 | ||||
| 2025-05-05 | 13F | Transce3nd, LLC | 0 | -100,00 | 0 | |||||
| 2025-05-16 | 13F | Coppell Advisory Solutions LLC | 0 | -100,00 | 0 | |||||
| 2025-08-15 | 13F | Equitable Holdings, Inc. | 48.243 | 11,86 | 718 | 7,00 | ||||
| 2025-07-10 | 13F | Oliver Lagore Vanvalin Investment Group | 2.110 | 0,00 | 33 | 0,00 | ||||
| 2025-04-16 | 13F | Fortitude Family Office, LLC | 0 | -100,00 | 0 | |||||
| 2025-04-22 | 13F | TrueMark Investments, LLC | 0 | -100,00 | 0 | |||||
| 2025-08-14 | 13F | Smartleaf Asset Management LLC | 6 | 0,00 | 0 | |||||
| 2025-08-14 | 13F | Tennessee Valley Asset Management Partners | 0 | -100,00 | 0 | |||||
| 2025-08-05 | 13F | Bank of New York Mellon Corp | 201.781 | 540,45 | 3.005 | 513,06 | ||||
| 2025-08-12 | 13F | Global Retirement Partners, LLC | 14.510 | 240,21 | 216 | 232,31 | ||||
| 2025-08-14 | 13F | Warren Averett Asset Management, LLC | 19.855 | 0,00 | 296 | -4,53 | ||||
| 2025-08-12 | 13F | Jacobi Capital Management LLC | 30.538 | 22,94 | 455 | 17,62 | ||||
| 2025-08-14 | 13F | Ausdal Financial Partners, Inc. | 78.518 | -0,03 | 1.169 | -4,34 | ||||
| 2025-08-12 | 13F | PSI Advisors, LLC | 0 | -100,00 | 0 | |||||
| 2025-08-06 | 13F | AE Wealth Management LLC | 24.079 | 3,61 | 359 | -0,83 | ||||
| 2025-07-17 | 13F | Beacon Capital Management, LLC | 1.983 | 0,00 | 30 | -3,33 | ||||
| 2025-07-08 | 13F | Parisi Gray Wealth Management | 50.975 | 0,00 | 759 | -4,29 | ||||
| 2025-07-31 | 13F | Cambridge Investment Research Advisors, Inc. | 236.170 | -63,37 | 4 | -70,00 | ||||
| 2025-08-12 | 13F | LPL Financial LLC | 2.051.627 | 5,57 | 30.549 | 0,96 | ||||
| 2025-08-05 | 13F | Prosperity Wealth Management, Inc. | 21.700 | 14,20 | 323 | 9,49 | ||||
| 2025-07-14 | 13F | Gridiron Partners, LLC | 10.000 | 0,00 | 149 | -4,52 | ||||
| 2025-08-14 | 13F | Ameriprise Financial Inc | 68.229 | -5,26 | 1.016 | -9,46 | ||||
| 2025-08-14 | 13F | Gen-Wealth Partners Inc | 659 | 0,00 | 10 | -10,00 | ||||
| 2025-07-09 | 13F | Fiduciary Alliance LLC | 43.312 | -3,48 | 645 | -7,74 | ||||
| 2025-08-08 | 13F | Foundations Investment Advisors, LLC | 12.904 | 19,93 | 192 | 14,97 | ||||
| 2025-08-29 | 13F | Total Investment Management Inc | 79 | 1 | ||||||
| 2025-05-09 | 13F | Gill Capital Partners, Llc | 0 | -100,00 | 0 | |||||
| 2025-07-10 | 13F | Focus Financial Network, Inc. | 55.205 | 22,41 | 822 | 16,95 | ||||
| 2025-08-08 | 13F | Cetera Investment Advisers | 679.066 | 11,96 | 10.111 | 7,07 | ||||
| 2025-08-08 | 13F | Capital Investment Advisory Services, LLC | 83.750 | 92,31 | 1.247 | 83,92 | ||||
| 2025-08-12 | 13F | Proequities, Inc. | 0 | 0 | ||||||
| 2025-08-18 | 13F | Geneos Wealth Management Inc. | 59.038 | 100,72 | 879 | 92,34 | ||||
| 2025-08-05 | 13F | Milestone Asset Management, Llc | 13.835 | -88,26 | 206 | -88,77 | ||||
| 2025-08-07 | 13F | New England Private Wealth Advisors LLC | 43.327 | -2,26 | 643 | -6,96 | ||||
| 2025-05-02 | 13F | Transcendent Capital Group LLC | 0 | -100,00 | 0 | |||||
| 2025-08-11 | 13F | Mosaic Family Wealth Partners, Llc | 227.244 | 4,14 | 3.384 | -0,41 | ||||
| 2025-08-07 | 13F | Vista Investment Partners Ii, Llc | 14.592 | -2,34 | 217 | -6,47 | ||||
| 2025-08-13 | 13F | Jones Financial Companies Lllp | 0 | -100,00 | 0 | |||||
| 2025-08-13 | 13F | Rsm Us Wealth Management Llc | 69.301 | 0,00 | 1.032 | -4,45 | ||||
| 2025-08-28 | NP | Cohen & Steers Closed-end Opportunity Fund, Inc. | 346.789 | -10,34 | 5.164 | -14,26 | ||||
| 2025-08-07 | 13F | Illumine Investment Management, LLC | 216.834 | 1,36 | 3.229 | -3,06 | ||||
| 2025-08-12 | 13F | Insigneo Advisory Services, Llc | 33.166 | 0,00 | 494 | -4,46 | ||||
| 2025-08-13 | 13F | Fisher Asset Management, LLC | 13.964 | 208 | ||||||
| 2025-08-06 | 13F | Wedbush Securities Inc | 176.925 | -2,36 | 3 | 0,00 | ||||
| 2025-07-15 | 13F | LVZ Advisors, Inc. | 12.682 | -10,75 | 189 | -14,93 | ||||
| 2025-07-10 | 13F | Secure Asset Management, LLC | 433.655 | -2,26 | 6.457 | -6,52 | ||||
| 2025-08-11 | 13F | Western Wealth Management, LLC | 36.808 | 3,07 | 548 | -1,44 | ||||
| 2025-08-07 | 13F | Encompass More Asset Management | 24.430 | 13,02 | 364 | 8,04 | ||||
| 2025-05-08 | 13F | Main Street Financial Solutions, LLC | 0 | -100,00 | 0 | |||||
| 2025-07-15 | 13F | Mather Group, Llc. | 0 | -100,00 | 0 | |||||
| 2025-07-23 | 13F | Elm3 Financial Group, LLC | 13.667 | -0,07 | 204 | -4,25 | ||||
| 2025-07-30 | 13F | Retirement Planning Group | 115.420 | 30,97 | 1.719 | 25,22 | ||||
| 2025-07-25 | 13F | Almanack Investment Partners, LLC. | 230.090 | 0,19 | 3.426 | -4,17 | ||||
| 2025-07-24 | 13F | Us Bancorp \de\ | 186 | 0,00 | 3 | 0,00 | ||||
| 2025-07-24 | 13F | IFP Advisors, Inc | 97 | -99,43 | 1 | -99,62 | ||||
| 2025-08-04 | 13F | Bay Colony Advisory Group, Inc d/b/a Bay Colony Advisors | 222.731 | -13,87 | 3.316 | -17,47 | ||||
| 2025-07-21 | 13F | Patriot Financial Group Insurance Agency, LLC | 20.059 | 2,71 | 299 | -1,97 | ||||
| 2025-04-30 | 13F | Allworth Financial LP | 0 | -100,00 | 0 | |||||
| 2025-07-28 | 13F | Harbour Investments, Inc. | 12.764 | -6,44 | 190 | -10,38 | ||||
| 2025-08-11 | 13F | FSA Wealth Management LLC | 4.676 | 0,00 | 70 | -4,17 | ||||
| 2025-08-12 | 13F | MAI Capital Management | 3.417 | 3,95 | 51 | -1,96 | ||||
| 2025-07-11 | 13F | Farther Finance Advisors, LLC | 26 | -99,40 | 0 | -100,00 | ||||
| 2025-08-14 | 13F | Mml Investors Services, Llc | 801.302 | 0,61 | 12 | -8,33 | ||||
| 2025-08-05 | 13F | Huntington National Bank | 0 | |||||||
| 2025-07-11 | 13F | Mallini Complete Financial Planning LLC | 38.562 | 9,98 | 574 | 5,32 | ||||
| 2025-07-21 | 13F | Future Financial Wealth Managment LLC | 4.000 | 0,00 | 60 | -4,84 | ||||
| 2025-08-11 | 13F | HighTower Advisors, LLC | 28.930 | -5,09 | 431 | -9,28 | ||||
| 2025-08-14 | 13F | Cohen & Steers, Inc. | 346.789 | -10,34 | 5 | -16,67 | ||||
| 2025-07-30 | 13F | Brookstone Capital Management | 56.269 | -13,34 | 838 | -17,13 | ||||
| 2025-04-14 | 13F | Strategic Wealth Designers | 0 | -100,00 | 0 | -100,00 | ||||
| 2025-07-17 | 13F | Presper Financial Architects, LLC | 50.550 | 1 | ||||||
| 2025-07-14 | 13F | Buska Wealth Management, LLC | 32.589 | 4,80 | 485 | 0,21 | ||||
| 2025-08-08 | 13F | Creative Planning | 10.064 | -54,70 | 150 | -56,81 | ||||
| 2025-08-19 | 13F | Advisory Services Network, LLC | 0 | -100,00 | 0 | |||||
| 2025-08-14 | 13F | Comerica Bank | 30.596 | 75,97 | 456 | 68,52 | ||||
| 2025-08-14 | 13F | Wells Fargo & Company/mn | 9.196 | 63,28 | 137 | 56,32 | ||||
| 2025-08-01 | 13F | Motco | 0 | -100,00 | 0 | |||||
| 2025-07-11 | 13F | Kapstone Financial Advisors LLC | 11.070 | 165 | ||||||
| 2025-08-13 | 13F | EverSource Wealth Advisors, LLC | 2.461 | 0,00 | 37 | -5,26 | ||||
| 2025-07-02 | 13F | Capital Market Strategies LLC | 31.000 | -12,11 | 462 | -16,03 | ||||
| 2025-08-05 | 13F | Sigma Planning Corp | 76.789 | 0,32 | 1.143 | -4,03 | ||||
| 2025-07-31 | 13F | Oppenheimer & Co Inc | 50.711 | 1,49 | 755 | -2,83 | ||||
| 2025-08-14 | 13F | Mercer Global Advisors Inc /adv | 71.424 | -4,19 | 1.064 | -8,36 | ||||
| 2025-08-05 | 13F | Uniting Wealth Partners, LLC | 10.000 | 0,00 | 149 | -4,52 | ||||
| 2025-08-14 | 13F | Stifel Financial Corp | 47.339 | 6,61 | 705 | 1,88 | ||||
| 2025-07-22 | 13F | Iron Horse Wealth Management, LLC | 2.006 | 30 | ||||||
| 2025-07-25 | 13F | Hazlett, Burt & Watson, Inc. | 1.355 | 6,27 | 0 | |||||
| 2025-07-17 | 13F | Janney Montgomery Scott LLC | 283.722 | 7,70 | 4 | 0,00 | ||||
| 2025-07-17 | 13F | Wagner Wealth Management, Llc | 19.403 | 0,00 | 289 | -4,64 | ||||
| 2025-08-06 | 13F | Vantage Financial Partners, LLC | 13.445 | -16,09 | 200 | -19,68 | ||||
| 2025-08-11 | 13F | Advisor Resource Council | 0 | -100,00 | 0 | |||||
| 2025-07-25 | 13F | Concord Wealth Partners | 271 | 0,00 | 4 | 0,00 | ||||
| 2025-08-19 | 13F | National Asset Management, Inc. | 30.379 | -33,05 | 452 | -34,68 | ||||
| 2025-08-12 | 13F | Country Trust Bank | 4.000 | 60 | ||||||
| 2025-07-28 | 13F | Mutual Advisors, LLC | 92.537 | -4,88 | 1.392 | -0,78 | ||||
| 2025-08-08 | 13F | Kingsview Wealth Management, LLC | 11.030 | 164 | ||||||
| 2025-08-14 | 13F | Banque Transatlantique SA | 0 | -100,00 | 0 | |||||
| 2025-07-29 | 13F | Stratos Wealth Partners, LTD. | 42.331 | 2,89 | 630 | -1,56 | ||||
| 2025-07-07 | 13F | Nova Wealth Management, Inc. | 2.940 | 0,00 | 44 | -4,44 | ||||
| 2025-08-13 | 13F | Northwestern Mutual Wealth Management Co | 3.144 | -70,57 | 47 | -72,29 | ||||
| 2025-08-14 | 13F | Mpwm Advisory Solutions, Llc | 7.000 | 0,00 | 104 | -3,70 | ||||
| 2025-08-14 | 13F | Great Valley Advisor Group, Inc. | 149.327 | 14,19 | 2.223 | 9,18 | ||||
| 2025-09-04 | 13F/A | Advisor Group Holdings, Inc. | 770.890 | 3,07 | 11.479 | -1,43 | ||||
| 2025-07-22 | 13F | Coastal Investment Advisors, Inc. | 20.383 | 5,16 | 304 | 0,66 | ||||
| 2025-07-29 | 13F | International Assets Investment Management, Llc | 15.941 | 3,43 | 237 | -0,84 | ||||
| 2025-08-14 | 13F | CoreCap Advisors, LLC | 47.641 | 1,85 | 709 | -2,61 | ||||
| 2025-07-23 | 13F | Prime Capital Investment Advisors, LLC | 424.839 | -41,59 | 6.326 | -44,14 | ||||
| 2025-08-07 | 13F | Kestra Private Wealth Services, Llc | 17.597 | 262 | ||||||
| 2025-07-21 | 13F | Ameritas Advisory Services, LLC | 10.546 | 0,00 | 157 | -1,87 | ||||
| 2025-07-30 | 13F | Financial Perspectives, Inc | 35 | 0,00 | 1 | |||||
| 2025-08-05 | 13F | GPS Wealth Strategies Group, LLC | 31.504 | 0,00 | 469 | -4,29 | ||||
| 2025-08-14 | 13F/A | Rockefeller Capital Management L.P. | 30.008 | 1,19 | 447 | -3,25 | ||||
| 2025-08-14 | 13F | Harwood Advisory Group, LLC | 750 | 0,00 | 11 | 0,00 | ||||
| 2025-08-11 | 13F | Core Wealth Partners LLC | 10.979 | 0,00 | 163 | -4,12 | ||||
| 2025-08-19 | 13F | Newbridge Financial Services Group, Inc. | 325 | 5 | ||||||
| 2025-08-11 | 13F | Principal Securities, Inc. | 145.460 | 9,56 | 2.166 | 6,91 | ||||
| 2025-05-15 | 13F | Citadel Advisors Llc | 0 | -100,00 | 0 | |||||
| 2025-07-30 | NP | HYIN - WisdomTree Alternative Income Fund N/A | 113.087 | 7,51 | 1.666 | 0,73 | ||||
| 2025-07-22 | 13F | DAVENPORT & Co LLC | 34.008 | 22,98 | 506 | 17,67 | ||||
| 2025-07-11 | 13F/A | Umb Bank N A/mo | 70.038 | 1,33 | 1.043 | -3,16 | ||||
| 2025-08-11 | 13F | Citigroup Inc | 1 | 0,00 | 0 | |||||
| 2025-08-15 | 13F | Captrust Financial Advisors | 49.945 | -45,75 | 744 | -48,15 | ||||
| 2025-07-24 | 13F | Eastern Bank | 4.073 | 0,00 | 61 | -4,76 | ||||
| 2025-08-14 | 13F | Garden State Investment Advisory Services LLC | 56.531 | -1,78 | 842 | -6,14 | ||||
| 2025-07-23 | 13F | Kingswood Wealth Advisors, Llc | 0 | -100,00 | 0 | |||||
| 2025-05-12 | 13F | Fmr Llc | 0 | -100,00 | 0 | |||||
| 2025-05-15 | 13F | Tower Research Capital LLC (TRC) | 0 | -100,00 | 0 | |||||
| 2025-08-05 | 13F | Strategic Financial Concepts, LLC | 52.357 | -6,78 | 780 | -10,87 | ||||
| 2025-08-14 | 13F | Atomi Financial Group, Inc. | 27.591 | 0,00 | 411 | -4,43 | ||||
| 2025-08-08 | 13F | Richmond Brothers, Inc. | 238.400 | 3,56 | 3.550 | -0,98 | ||||
| 2025-08-11 | 13F | Anfield Capital Management, LLC | 3.654 | 0,00 | 54 | -3,57 | ||||
| 2025-05-15 | 13F/A | Orion Portfolio Solutions, LLC | 13.101 | 204 | ||||||
| 2025-08-05 | 13F | Flynn Zito Capital Management, Llc | 92.647 | 108,18 | 1.380 | 99,28 | ||||
| 2025-07-11 | 13F | Kingstone Capital Partners Texas, LLC | 17.953.239 | 288 | ||||||
| 2025-05-14 | 13F | Oarsman Capital, Inc. | 0 | -100,00 | 0 | |||||
| 2025-08-14 | 13F | Bank Of America Corp /de/ | 551.009 | 4,03 | 8.205 | -0,51 | ||||
| 2025-07-29 | 13F | Altus Wealth Group LLC | 10.092 | -2,63 | 150 | -6,83 | ||||
| 2025-08-11 | 13F | NewEdge Wealth, LLC | 0 | -100,00 | 0 | |||||
| 2025-07-14 | 13F | U.S. Capital Wealth Advisors, LLC | 19.323 | 7,99 | 288 | 3,24 | ||||
| 2025-07-22 | 13F | Merit Financial Group, LLC | 26.125 | 1,86 | 389 | -2,51 | ||||
| 2025-08-14 | 13F | Wiley Bros.-aintree Capital, Llc | 10.979 | 0,00 | 163 | -4,12 | ||||
| 2025-08-04 | 13F | Spire Wealth Management | 9.708 | 0,00 | 145 | -4,64 | ||||
| 2025-05-15 | 13F | Gwn Securities Inc. | 0 | -100,00 | 0 | |||||
| 2025-08-04 | 13F | IFG Advisory, LLC | 89.696 | 327,63 | 1.336 | 309,51 | ||||
| 2025-07-11 | 13F | Quad-Cities Investment Group, LLC | 16.982 | 8,48 | 253 | 3,70 | ||||
| 2025-08-08 | 13F | Pnc Financial Services Group, Inc. | 141.449 | 7,19 | 2.106 | 2,53 | ||||
| 2025-07-31 | 13F | Moloney Securities Asset Management, LLC | 17.825 | 24,95 | 265 | 19,37 | ||||
| 2025-08-14 | 13F | GWM Advisors LLC | 107.752 | 2,43 | 1.604 | -2,02 | ||||
| 2025-05-15 | 13F | Hrt Financial Lp | 0 | -100,00 | 0 | |||||
| 2025-07-22 | 13F | Marks Group Wealth Management, Inc | 196.262 | 0,00 | 2.922 | -4,35 | ||||
| 2025-07-25 | 13F | Atria Wealth Solutions, Inc. | 60.747 | -76,42 | 905 | -77,47 | ||||
| 2025-08-14 | 13F | Raymond James Financial Inc | 958.371 | -17,71 | 14.270 | -21,30 | ||||
| 2025-07-29 | 13F | Disciplined Investments, LLC | 24.641 | -21,77 | 367 | -25,31 | ||||
| 2025-07-22 | 13F | Beacon Financial Advisory LLC | 10.296 | 153 | ||||||
| 2025-08-12 | 13F | Marshall & Sterling Wealth Advisors Inc. | 26 | 0,00 | 0 | |||||
| 2025-08-14 | 13F | Sunbelt Securities, Inc. | 7.851 | 3,99 | 120 | 1,71 | ||||
| 2025-08-12 | 13F | CIBC Private Wealth Group, LLC | 3.826 | -20,70 | 57 | -16,42 | ||||
| 2025-07-25 | 13F | Apollon Wealth Management, LLC | 23.214 | 56,32 | 346 | 49,35 | ||||
| 2025-08-12 | 13F | Steward Partners Investment Advisory, Llc | 129.941 | 6,94 | 1.935 | 2,27 | ||||
| 2025-08-01 | 13F | Petra Financial Advisors Inc | 445.056 | 108,65 | 6.627 | 99,52 | ||||
| 2025-08-12 | 13F | BlackRock, Inc. | 43.314 | 58,51 | 645 | 51,53 | ||||
| 2025-08-14 | 13F | Royal Bank Of Canada | 659.129 | 6,58 | 9.814 | 1,92 | ||||
| 2025-08-15 | 13F | Morgan Stanley | 7.297.290 | 6,33 | 108.657 | 1,69 | ||||
| 2025-08-13 | 13F | Capital Analysts, Inc. | 20.710 | 2,55 | 0 | |||||
| 2025-08-12 | 13F | Change Path, LLC | 740.653 | 8,49 | 11.028 | 3,75 | ||||
| 2025-07-24 | 13F | JB Capital LLC | 24.819 | 0,47 | 370 | -3,91 | ||||
| 2025-07-09 | 13F | David J Yvars Group | 22.463 | 0,90 | 334 | -3,47 | ||||
| 2025-08-06 | 13F | Moors & Cabot, Inc. | 12.055 | 0,00 | 179 | -4,28 | ||||
| 2025-08-11 | 13F | Aptus Capital Advisors, LLC | 11.374 | 0,31 | 169 | -3,98 | ||||
| 2025-08-06 | 13F | Commonwealth Equity Services, Llc | 300.610 | -55,21 | 4 | -60,00 |