Grundlæggende statistik
| Institutionelle ejere | 164 total, 164 long only, 0 short only, 0 long/short - change of 5,10% MRQ |
| Gennemsnitlig porteføljeallokering | 0.0465 % - change of -2,18% MRQ |
| Institutionelle aktier (lange) | 21.154.350 (ex 13D/G) - change of 0,62MM shares 3,01% MRQ |
| Institutionel værdi (lang) | $ 104.993 USD ($1000) |
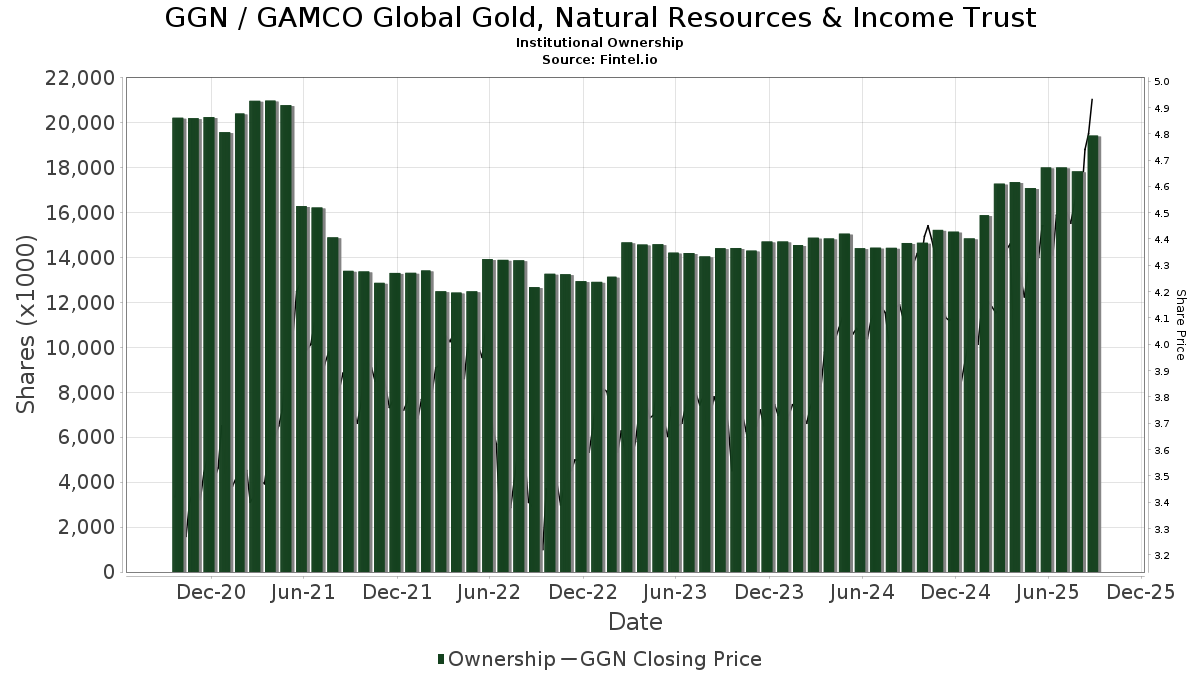
Institutionelt ejerskab og aktionærer
GAMCO Global Gold, Natural Resources & Income Trust (US:GGN) har 164 institutionelle ejere og aktionærer, der har indsendt 13D/G- eller 13F-formularer til Securities Exchange Commission (SEC). Disse institutioner har i alt 21,154,350 aktier. Største aktionærer omfatter Morgan Stanley, Formidable Asset Management, LLC, Bank Of America Corp /de/, Sovran Advisors, LLC, Janney Montgomery Scott LLC, Private Advisor Group, LLC, Advisor Group Holdings, Inc., Capital Wealth Alliance, LLC, Wolverine Asset Management Llc, and Stifel Financial Corp .
GAMCO Global Gold, Natural Resources & Income Trust (NYSEAM:GGN) institutionel ejerskabsstruktur viser aktuelle positioner i virksomheden efter institutioner og fonde, samt seneste ændringer i positionsstørrelse. Større aktionærer kan omfatte individuelle investorer, investeringsforeninger, hedgefonde eller institutioner. Skema 13D angiver, at investoren besidder (eller besidder) mere end 5 % af virksomheden og har til hensigt (eller har til hensigt at) aktivt at forfølge en ændring i forretningsstrategi. Skema 13G indikerer en passiv investering på over 5%.
The share price as of April 20, 2026 is 5,50 / share. Previously, on April 21, 2025, the share price was 4,25 / share. This represents an increase of 29,41% over that period.
Fondens stemningsscore
Fund Sentiment Score (fka Ownership Accumulation Score) finder de aktier, der bliver mest købt af fonde. Det er resultatet af en sofistikeret, multi-faktor kvantitativ model, der identificerer virksomheder med de højeste niveauer af institutionel akkumulering. Scoringsmodellen bruger en kombination af den samlede stigning i oplyste ejere, ændringerne i porteføljeallokeringer i disse ejere og andre målinger. Tallet går fra 0 til 100, hvor højere tal indikerer et højere niveau af akkumulering for sine jævnaldrende, og 50 er gennemsnittet.
Opdateringsfrekvens: Dagligt
Se Ownership Explorer, som giver en liste over højest rangerende virksomheder.
AI+ Ask Fintel’s AI assistant about GAMCO Global Gold, Natural Resources & Income Trust.
Select a question to share a public post with an AI-crafted answer.
Thinking of good questions…
Institutionel Put/Call-forhold
Ud over at indberette standardaktie- og gældsudstedelser skal institutter med mere end 100 mill. aktiver under forvaltning også oplyse deres put- og call-optionsbeholdninger. Da salgsoptioner generelt indikerer negativ stemning, og købsoptioner indikerer positiv stemning, kan vi få en fornemmelse af den overordnede institutionelle stemning ved at plotte forholdet mellem put og kald. Diagrammet til højre viser det historiske put/call-forhold for dette instrument.
Brug af Put/Call Ratio som en indikator for investorernes stemning overvinder en af de vigtigste mangler ved at bruge totalt institutionelt ejerskab, som er, at en betydelig mængde af aktiver under forvaltning investeres passivt for at spore indekser. Passivt forvaltede fonde køber typisk ikke optioner, så indikatoren for put/call-forholdet følger mere nøje følelsen af aktivt forvaltede fonde.
13F og NPORT arkivering
Detaljer om 13F-arkivering er gratis. Detaljer om NP-ansøgninger kræver et premium-medlemskab. Grønne rækker angiver nye positioner. Røde rækker angiver lukkede positioner. Klik på linket ikon for at se den fulde transaktionshistorik.
Opgrader
for at låse premium-data op og eksportere til Excel ![]() .
.
| Fil dato | Kilde | Investor | Type | Gennemsnitlig pris (Øst) |
Aktier | Δ Aktier (%) |
Rapporteret Værdi ($1000) |
Δ Værdi (%) |
Port Alloc (%) |
|
|---|---|---|---|---|---|---|---|---|---|---|
| 2026-04-20 | 13F | Live Oak Private Wealth LLC | 63.152 | 0,00 | 336 | 3,08 | ||||
| 2026-02-17 | 13F | Decision Investments, Inc | 17.560 | 91 | ||||||
| 2026-02-19 | 13F | Atomi Financial Group, Inc. | 168.637 | 3,77 | 870 | 3,94 | ||||
| 2026-02-06 | 13F | HighTower Advisors, LLC | 12.776 | -64,70 | 66 | -65,05 | ||||
| 2026-02-02 | 13F | Oppenheimer & Co Inc | 92.800 | 0,00 | 479 | 0,00 | ||||
| 2025-11-14 | 13F | Walleye Capital LLC | 0 | -100,00 | 0 | |||||
| 2026-01-23 | 13F | Assetmark, Inc | 10.400 | 0,00 | 54 | 0,00 | ||||
| 2026-02-10 | 13F/A | LVZ Advisors, Inc. | 35.991 | -0,55 | 186 | -0,54 | ||||
| 2026-02-23 | 13F | Wealth Preservation Advisors, LLC | 60 | 0,00 | 0 | |||||
| 2026-02-09 | 13F | Integrity Alliance, Llc. | 19.863 | 0,86 | 102 | 0,99 | ||||
| 2026-02-11 | 13F | LPL Financial LLC | 533.574 | 2,46 | 2.753 | 2,57 | ||||
| 2026-02-13 | 13F | Baird Financial Group, Inc. | 105.311 | 5,51 | 543 | 5,64 | ||||
| 2026-04-17 | 13F | Brown, Lisle/cummings, Inc. | 21.986 | -6,60 | 117 | -4,13 | ||||
| 2026-02-13 | 13F | Kestra Advisory Services, LLC | 0 | -100,00 | 0 | |||||
| 2026-02-10 | 13F/A | Northwestern Mutual Wealth Management Co | 9.442 | 9,22 | 49 | 9,09 | ||||
| 2026-04-02 | 13F | Marex Group plc | 0 | -100,00 | 0 | |||||
| 2026-04-21 | 13F | Huntleigh Advisors, Inc. | 10.000 | 0,00 | 53 | 3,92 | ||||
| 2026-02-23 | 13F | Virtu Financial LLC | 0 | -100,00 | 0 | |||||
| 2026-04-08 | 13F | Community Financial Services Group, LLC | 1.050 | 6 | ||||||
| 2026-02-13 | 13F | Rhumbline Advisers | 245 | 1 | ||||||
| 2026-02-13 | 13F | Hurley Capital, LLC | 4.111 | 1,81 | 21 | 5,00 | ||||
| 2026-01-30 | 13F | Sigma Planning Corp | 84.926 | 0,98 | 438 | 1,15 | ||||
| 2026-02-11 | 13F | Total Wealth Planning & Management, Inc. | 99.297 | -2,41 | 512 | 14,80 | ||||
| 2026-02-13 | 13F | Bay Colony Advisory Group, Inc d/b/a Bay Colony Advisors | 159.957 | 4,46 | 825 | 4,56 | ||||
| 2026-02-03 | 13F | Vantage Financial Partners, LLC | 13.044 | -46,46 | 67 | -46,40 | ||||
| 2026-04-13 | 13F | Mitchell Sinkler & Starr/pa | 13.750 | 0,00 | 73 | 4,29 | ||||
| 2026-04-17 | 13F | RFG Advisory, LLC | 26.190 | 8,59 | 139 | 12,10 | ||||
| 2026-02-02 | 13F | Benjamin Edwards Inc | 40.611 | 2,21 | 210 | 2,45 | ||||
| 2026-04-07 | 13F | Farther Finance Advisors, LLC | 86.120 | 14,17 | 467 | 19,79 | ||||
| 2026-01-29 | 13F | Financial Life Planners | 0 | -100,00 | 0 | |||||
| 2026-02-05 | 13F | Trevian Wealth Management LLC | 0 | -100,00 | 0 | |||||
| 2026-02-03 | 13F | Detalus Advisors, LLC | 13.626 | 1,10 | 70 | 1,45 | ||||
| 2026-01-22 | 13F | Vision Financial Markets Llc | 430 | 1,90 | 2 | 0,00 | ||||
| 2026-02-02 | 13F | Montag A & Associates Inc | 9.287 | 0,00 | 48 | 0,00 | ||||
| 2026-02-18 | 13F | Onyx Bridge Wealth Group LLC | 28.024 | 0,00 | 145 | 0,00 | ||||
| 2026-02-12 | 13F | Advisors Asset Management, Inc. | 0 | -100,00 | 0 | |||||
| 2026-01-09 | 13F | Tactive Advisors, LLC | 0 | -100,00 | 0 | |||||
| 2026-02-02 | 13F | WT Wealth Management | 15.785 | 1,81 | 81 | 2,53 | ||||
| 2026-02-17 | 13F | Cetera Investment Advisers | 509.676 | 4,84 | 2.630 | 4,91 | ||||
| 2026-01-29 | 13F | Calamos Advisors LLC | 85.404 | 32,14 | 441 | 32,13 | ||||
| 2026-02-12 | 13F | StoneX Group Inc. | 15.740 | -24,02 | 81 | -23,58 | ||||
| 2026-01-21 | 13F | Sound Income Strategies, LLC | 635 | 0,00 | 3 | 0,00 | ||||
| 2026-02-02 | 13F | Ashton Thomas Securities, Llc | 125.705 | 2,45 | 649 | 2,53 | ||||
| 2026-01-16 | 13F | Formidable Asset Management, LLC | 1.433.817 | -10,66 | 7.391 | 4,91 | ||||
| 2026-02-05 | 13F | Thrivent Financial For Lutherans | 44.797 | 0 | ||||||
| 2026-02-10 | 13F | Carnegie Lake Advisors LLC | 111.481 | 3,24 | 575 | 3,42 | ||||
| 2026-04-06 | 13F | Highline Wealth Partners Llc | 0 | -100,00 | 0 | |||||
| 2026-02-13 | 13F | Kayne Anderson Rudnick Investment Management Llc | 2.750 | 0,00 | 14 | 0,00 | ||||
| 2026-02-12 | 13F | Jane Street Group, Llc | 179.110 | 641,75 | 924 | 645,16 | ||||
| 2026-04-07 | 13F | CoreCap Advisors, LLC | 7.480 | -16,89 | 40 | -15,22 | ||||
| 2026-02-17 | 13F | Mercer Global Advisors Inc /adv | 20.716 | 15,56 | 107 | 15,22 | ||||
| 2026-02-13 | 13F | Mml Investors Services, Llc | 16.693 | 0,43 | 86 | 1,18 | ||||
| 2026-04-13 | 13F | Salem Investment Counselors Inc | 250 | 1 | ||||||
| 2026-02-13 | 13F | Motiv8 Investments LLC | 339 | 0 | ||||||
| 2026-02-09 | 13F | Frazier Financial Advisors, LLC | 446 | 0,00 | 2 | 0,00 | ||||
| 2026-02-06 | 13F | Gables Capital Management Inc. | 3.333 | 0,00 | 17 | 0,00 | ||||
| 2026-02-18 | 13F | GWM Advisors LLC | 6.458 | 17,53 | 33 | 17,86 | ||||
| 2026-02-13 | 13F | Citigroup Inc | 3 | 0,00 | 0 | |||||
| 2026-02-03 | 13F | Alpha Cubed Investments, LLC | 23.305 | 120 | ||||||
| 2025-11-05 | 13F | Moloney Securities Asset Management, LLC | 14.798 | 0,00 | 76 | 18,75 | ||||
| 2026-02-12 | 13F | Bank Of Montreal /can/ | 69.817 | 0,00 | 360 | 0,00 | ||||
| 2026-01-29 | 13F | Comerica Bank | 22.631 | 461,70 | 117 | 480,00 | ||||
| 2026-02-13 | 13F | Glen Eagle Advisors, LLC | 1.500 | 1.150,00 | 8 | |||||
| 2026-02-10 | 13F | Moors & Cabot, Inc. | 213.900 | 0,00 | 1.104 | 0,09 | ||||
| 2026-04-07 | 13F | Eastern Bank | 384.930 | 0,00 | 2.048 | 3,07 | ||||
| 2026-04-20 | 13F | Hilton Head Capital Partners, LLC | 8.850 | -10,15 | 47 | -6,00 | ||||
| 2026-04-13 | 13F | Hm Payson & Co | 0 | -100,00 | 0 | |||||
| 2026-02-02 | 13F | Sachetta, LLC | 6 | 0,00 | 0 | |||||
| 2026-04-09 | 13F | Vista Investment Partners Llc | 24.141 | -2,14 | 128 | 0,79 | ||||
| 2026-02-12 | 13F | Kovack Advisors, Inc. | 45.830 | 59 | ||||||
| 2026-02-02 | 13F | Truist Financial Corp | 102.717 | 14,37 | 530 | 14,72 | ||||
| 2026-02-04 | 13F | Nwam Llc | 96.991 | -5,93 | 510 | -3,41 | ||||
| 2026-02-17 | 13F | Susquehanna International Group, Llp | 61.264 | 311,25 | 316 | 315,79 | ||||
| 2026-02-17 | 13F | Equitable Holdings, Inc. | 12.767 | 66 | ||||||
| 2026-04-14 | 13F | Wealthcare Advisory Partners LLC | 146.175 | 778 | ||||||
| 2026-01-21 | 13F | Modera Wealth Management, LLC | 14.069 | 1,49 | 73 | 1,41 | ||||
| 2026-02-05 | 13F | Stephens Inc /ar/ | 16.200 | -15,97 | 84 | -16,16 | ||||
| 2026-01-16 | 13F | Trust Co Of Vermont | 1.300 | 0,00 | 7 | 0,00 | ||||
| 2026-01-29 | 13F | UBS Group AG | 166.478 | -2,06 | 859 | -1,94 | ||||
| 2025-10-21 | 13F | Optimum Investment Advisors | 304.374 | 8,05 | 1.569 | 26,94 | ||||
| 2026-01-28 | 13F | Financial Plan, Inc. | 25.027 | 129 | ||||||
| 2026-02-09 | 13F | IPG Investment Advisors LLC | 0 | -100,00 | 0 | |||||
| 2026-02-03 | 13F | Strengthening Families & Communities, LLC | 3.506 | 18 | ||||||
| 2026-02-17 | 13F/A | Sentinus, LLC | 19.852 | 102 | ||||||
| 2026-04-15 | 13F | Fortitude Family Office, LLC | 0 | -100,00 | 0 | |||||
| 2026-04-14 | 13F | Nbc Securities, Inc. | 11.500 | 0,00 | 61 | 3,39 | ||||
| 2026-02-10 | 13F | Texas Yale Capital Corp. | 29.000 | 16,00 | 150 | 16,41 | ||||
| 2026-02-17 | 13F | Wiley Bros.-aintree Capital, Llc | 204.843 | 1.057 | ||||||
| 2026-02-02 | 13F | Wolverine Asset Management Llc | 614.668 | 3.172 | ||||||
| 2026-01-14 | 13F | WESPAC Advisors, LLC | 13.250 | -50,00 | 68 | -50,00 | ||||
| 2026-02-17 | 13F | WFA of San Diego, LLC | 0 | -100,00 | 0 | |||||
| 2026-01-21 | 13F | Newbridge Financial Services Group, Inc. | 0 | -100,00 | 0 | |||||
| 2026-04-20 | 13F | Ronald Blue Trust, Inc. | 0 | -100,00 | 0 | |||||
| 2026-01-28 | 13F | N.E.W. Advisory Services LLC | 800 | 0,00 | 4 | 0,00 | ||||
| 2026-01-16 | 13F | Pacific Sage Partners, LLC | 17.345 | 0,00 | 90 | 0,00 | ||||
| 2026-04-08 | 13F | Wealth Enhancement Advisory Services, Llc | 10.662 | -26,97 | 58 | -25,97 | ||||
| 2026-02-04 | 13F | Oxbow Advisors, LLC | 91.750 | 0,00 | 473 | 0,21 | ||||
| 2026-04-16 | 13F | Triad Wealth Partners, LLC | 15.078 | 80 | ||||||
| 2026-02-18 | 13F | Beacon Pointe Advisors, LLC | 33.289 | -11,98 | 172 | -11,86 | ||||
| 2026-01-29 | 13F | Advisors Capital Management, LLC | 20.807 | 0,00 | 107 | 0,00 | ||||
| 2026-02-11 | 13F | O'shaughnessy Asset Management, Llc | 12.114 | 1,82 | 63 | 1,64 | ||||
| 2026-02-05 | 13F | Cambridge Investment Research Advisors, Inc. | 64.070 | 1,68 | 0 | |||||
| 2026-02-10 | 13F | WCG Wealth Advisors LLC | 80.000 | 413 | ||||||
| 2026-02-13 | 13F | Truvestments Capital Llc | 202 | 0,00 | 1 | 0,00 | ||||
| 2026-04-08 | 13F | JGP Wealth Management, LLC | 43.345 | 0,00 | 231 | 3,14 | ||||
| 2026-02-17 | 13F | Garden State Investment Advisory Services LLC | 82.260 | -13,63 | 424 | -13,47 | ||||
| 2026-02-17 | 13F | Bank Of America Corp /de/ | 1.191.264 | 38,08 | 6.147 | 38,21 | ||||
| 2025-11-12 | 13F | Creekmur Asset Management LLC | 1.085 | 1,88 | 6 | 25,00 | ||||
| 2026-04-09 | 13F | DHJJ Financial Advisors, Ltd. | 1.200 | 6 | ||||||
| 2026-02-12 | 13F | Federation des caisses Desjardins du Quebec | 1.000 | 0,00 | 5 | 0,00 | ||||
| 2026-02-13 | 13F | Tcfg Wealth Management, Llc | 50.240 | 0,00 | 259 | 0,39 | ||||
| 2026-02-13 | 13F | Ashford Capital Management Inc | 146.000 | 0,00 | 753 | 0,13 | ||||
| 2026-02-17 | 13F | Tower Research Capital LLC (TRC) | 113 | 1 | ||||||
| 2026-04-13 | 13F | Creative Financial Designs Inc /adv | 14.183 | 1,32 | 75 | 4,17 | ||||
| 2026-02-17 | 13F | Capital Wealth Alliance, LLC | 650.660 | 123,49 | 4.648 | 209,87 | ||||
| 2026-01-29 | 13F | D.a. Davidson & Co. | 14.908 | 0,00 | 77 | 0,00 | ||||
| 2026-01-20 | 13F | Sovran Advisors, LLC | 948.510 | 0,51 | 5.065 | 12,76 | ||||
| 2026-01-20 | 13F | Stratos Wealth Partners, LTD. | 64.600 | 40,62 | 333 | 41,10 | ||||
| 2026-02-03 | 13F | International Assets Investment Management, Llc | 44.766 | -2,12 | 231 | 14,43 | ||||
| 2026-02-06 | 13F | Global Retirement Partners, LLC | 5.771 | 165,94 | 30 | 163,64 | ||||
| 2026-02-13 | 13F | Golden State Wealth Management, LLC | 520 | 0,00 | 3 | 0,00 | ||||
| 2026-02-03 | 13F | Sequoia Financial Advisors, LLC | 22.429 | 0,45 | 116 | 0,00 | ||||
| 2026-02-13 | 13F | Wells Fargo & Company/mn | 398.572 | -38,70 | 2.057 | -38,65 | ||||
| 2026-02-14 | 13F | Rockefeller Capital Management L.P. | 0 | -100,00 | 0 | |||||
| 2026-02-06 | 13F | Tortoise Investment Management, LLC | 0 | -100,00 | 0 | |||||
| 2026-01-23 | 13F | Rsm Us Wealth Management Llc | 16.749 | 49,54 | 88 | 52,63 | ||||
| 2026-01-22 | 13F | Comprehensive Money Management Services LLC | 56.746 | -11,40 | 293 | -11,52 | ||||
| 2026-02-05 | 13F | Mesirow Financial Investment Management, Inc. | 34.073 | 176 | ||||||
| 2026-04-13 | 13F | Massmutual Trust Co Fsb/adv | 390 | 0,00 | 2 | 0,00 | ||||
| 2026-02-09 | 13F | Strategic Financial Concepts, LLC | 0 | -100,00 | 0 | |||||
| 2026-02-12 | 13F | Hollencrest Capital Management | 2.450 | 0,00 | 13 | 0,00 | ||||
| 2026-02-12 | 13F | BRYN MAWR TRUST Co | 13.025 | 0,00 | 67 | 0,00 | ||||
| 2026-02-17 | 13F | VestGen Advisors, LLC | 300.438 | -1,29 | 1.550 | -1,21 | ||||
| 2026-01-26 | 13F | PFG Investments, LLC | 72.867 | -8,15 | 376 | -8,09 | ||||
| 2026-02-11 | 13F | Janney Montgomery Scott LLC | 919.304 | 16,49 | 5 | 0,00 | ||||
| 2026-04-14 | 13F | Thurston, Springer, Miller, Herd & Titak, Inc. | 40 | 0 | ||||||
| 2026-04-20 | 13F | Kestra Private Wealth Services, Llc | 137.352 | 1,13 | 731 | 4,29 | ||||
| 2026-02-17 | 13F | Nomura Holdings Inc | 36.250 | 187 | ||||||
| 2026-02-12 | 13F | Hrt Financial Lp | 0 | -100,00 | 0 | |||||
| 2026-02-13 | 13F | Colony Group, LLC | 109.171 | 334,29 | 563 | 336,43 | ||||
| 2026-01-23 | 13F | Freestone Capital Holdings, LLC | 13.591 | 1,81 | 70 | 2,94 | ||||
| 2026-02-12 | 13F | Wedbush Securities Inc | 41.487 | 2,85 | 0 | |||||
| 2026-02-10 | 13F | Envestnet Asset Management Inc | 17.029 | 88 | ||||||
| 2026-02-13 | 13F | Pinnacle Wealth Planning Services, Inc. | 1.396 | 7 | ||||||
| 2026-01-16 | 13F | Vanguard Capital Wealth Advisors This fund is a listed as child fund of Vanguard Group Inc and if that institution has disclosed ownership in this security, then these positions will not be double counted when calculating total shares and total value | 17.978 | -28,36 | 93 | -28,68 | ||||
| 2026-04-17 | 13F | High Net Worth Advisory Group LLC | 19.475 | 0,00 | 104 | 3,00 | ||||
| 2026-02-13 | 13F | Landscape Capital Management, L.l.c. | 62.798 | 324 | ||||||
| 2026-02-17 | 13F | Creative Planning | 20.136 | 44,54 | 104 | 45,07 | ||||
| 2026-02-13 | 13F | Mariner, LLC | 26.227 | 45,57 | 135 | 46,74 | ||||
| 2026-02-17 | 13F | Royal Bank Of Canada | 208.552 | -25,54 | 1.076 | -25,48 | ||||
| 2026-01-14 | 13F | Spire Wealth Management | 4.000 | 20,12 | 21 | 17,65 | ||||
| 2026-02-17 | 13F | Raymond James Financial Inc | 467.893 | -3,60 | 2.414 | -3,52 | ||||
| 2026-02-17 | 13F | Millennium Management Llc | 212.098 | 1.094 | ||||||
| 2026-01-30 | 13F | Samalin Investment Counsel, LLC | 24.753 | -21,29 | 128 | -21,60 | ||||
| 2026-02-17 | 13F | Tricadia Capital Management, LLC | 50.530 | -67,08 | 261 | -67,13 | ||||
| 2026-02-13 | 13F | MAI Capital Management | 3.039 | 1,81 | 16 | 0,00 | ||||
| 2026-02-13 | 13F | Morgan Stanley | 4.231.974 | 21,42 | 21.837 | 21,53 | ||||
| 2026-02-17 | 13F | Df Dent & Co Inc | 0 | -100,00 | 0 | |||||
| 2026-02-06 | 13F | Pnc Financial Services Group, Inc. | 0 | -100,00 | 0 | |||||
| 2026-02-09 | 13F | Barry Investment Advisors, LLC | 11.429 | 0,00 | 59 | 0,00 | ||||
| 2026-01-26 | 13F | Cwm, Llc | 424 | 6,00 | 0 | |||||
| 2026-02-09 | 13F | Huntington National Bank | 1 | 0,00 | ||||||
| 2026-03-03 | 13F | NWF Advisory Services Inc. | 112.628 | 0,00 | 581 | 0,17 | ||||
| 2026-02-17 | 13F | XTX Topco Ltd | 27.622 | 143 | ||||||
| 2026-01-28 | 13F | WPG Advisers, LLC | 567 | 3 | ||||||
| 2026-04-15 | 13F | Merit Financial Group, LLC | 110.451 | 2,51 | 588 | 5,77 | ||||
| 2026-01-20 | 13F | Coastal Investment Advisors, Inc. | 10.546 | -5,32 | 54 | -5,26 | ||||
| 2026-02-13 | 13F | Stifel Financial Corp | 604.780 | -17,14 | 3.121 | -17,07 | ||||
| 2026-02-17 | 13F | Advisor Group Holdings, Inc. | 683.026 | 14,12 | 3.524 | 18,45 | ||||
| 2026-04-09 | 13F | Acropolis Investment Management, LLC | 15.725 | 0,00 | 84 | 2,47 | ||||
| 2026-02-12 | 13F | Commonwealth Equity Services, Llc | 122.941 | -9,42 | 634 | |||||
| 2026-02-17 | 13F | Two Sigma Securities, Llc | 16.941 | 87 | ||||||
| 2026-01-21 | 13F | Flagship Harbor Advisors, Llc | 28.900 | 45,23 | 149 | 46,08 | ||||
| 2026-02-02 | 13F | Robertson Stephens Wealth Management, LLC | 24.148 | 125 | ||||||
| 2025-11-04 | 13F | L.m. Kohn & Company | 25.904 | -18,81 | 134 | -5,00 | ||||
| 2026-02-13 | 13F | Cornerstone Advisors, LLC | 138.151 | -80,36 | 713 | -80,36 | ||||
| 2026-02-05 | 13F | Allworth Financial LP | 24.541 | 4,31 | 127 | 4,13 | ||||
| 2026-02-13 | 13F | Navis Wealth Advisors, LLC | 117.370 | 606 | ||||||
| 2026-02-17 | 13F | Advisory Services Network, LLC | 15.797 | 0,00 | 82 | 0,00 | ||||
| 2026-02-17 | 13F | Private Advisor Group, LLC | 768.643 | 8,69 | 3.966 | 8,81 | ||||
| 2026-02-17 | 13F | National Asset Management, Inc. | 38.600 | 0,79 | 199 | 1,02 | ||||
| 2026-02-20 | 13F | Kovitz Investment Group Partners, LLC | 0 | -100,00 | 0 | |||||
| 2026-01-26 | 13F | Whittier Trust Co | 1.500 | 8 | ||||||
| 2026-02-11 | 13F | J.w. Cole Advisors, Inc. | 136.605 | 3,40 | 653 | -4,26 | ||||
| 2026-02-12 | 13F | Insigneo Advisory Services, Llc | 39.332 | -0,95 | 203 | -0,98 | ||||
| 2026-02-10 | 13F | Tidemark, LLC | 598 | 0,00 | 3 | 0,00 | ||||
| 2026-02-12 | 13F | Steward Partners Investment Advisory, Llc | 11.300 | -27,10 | 58 | -26,58 |