Grundlæggende statistik
| Institutionelle ejere | 91 total, 91 long only, 0 short only, 0 long/short - change of -4,12% MRQ |
| Gennemsnitlig porteføljeallokering | 0.0252 % - change of 6,22% MRQ |
| Institutionelle aktier (lange) | 1.985.187 (ex 13D/G) - change of -0,15MM shares -7,00% MRQ |
| Institutionel værdi (lang) | $ 125.802 USD ($1000) |
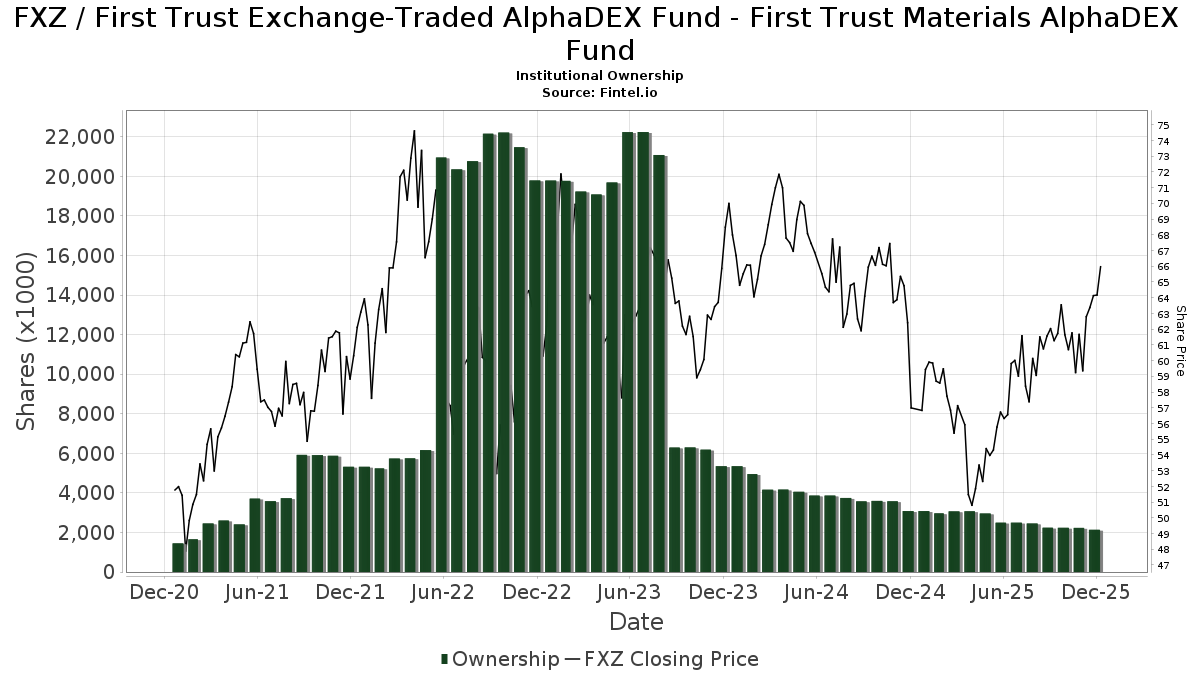
Institutionelt ejerskab og aktionærer
First Trust Exchange-Traded AlphaDEX Fund - First Trust Materials AlphaDEX Fund (US:FXZ) har 91 institutionelle ejere og aktionærer, der har indsendt 13D/G- eller 13F-formularer til Securities Exchange Commission (SEC). Disse institutioner har i alt 1,985,187 aktier. Største aktionærer omfatter Wells Fargo & Company/mn, LPL Financial LLC, Morgan Stanley, Cetera Investment Advisers, Bank Of America Corp /de/, Ameriprise Financial Inc, Wealth Enhancement Advisory Services, Llc, Envestnet Asset Management Inc, Goldman Sachs Group Inc, and Summit Financial, LLC .
First Trust Exchange-Traded AlphaDEX Fund - First Trust Materials AlphaDEX Fund (ARCA:FXZ) institutionel ejerskabsstruktur viser aktuelle positioner i virksomheden efter institutioner og fonde, samt seneste ændringer i positionsstørrelse. Større aktionærer kan omfatte individuelle investorer, investeringsforeninger, hedgefonde eller institutioner. Skema 13D angiver, at investoren besidder (eller besidder) mere end 5 % af virksomheden og har til hensigt (eller har til hensigt at) aktivt at forfølge en ændring i forretningsstrategi. Skema 13G indikerer en passiv investering på over 5%.
The share price as of March 16, 2026 is 74,09 / share. Previously, on March 17, 2025, the share price was 57,06 / share. This represents an increase of 29,85% over that period.
Fondens stemningsscore
Fund Sentiment Score (fka Ownership Accumulation Score) finder de aktier, der bliver mest købt af fonde. Det er resultatet af en sofistikeret, multi-faktor kvantitativ model, der identificerer virksomheder med de højeste niveauer af institutionel akkumulering. Scoringsmodellen bruger en kombination af den samlede stigning i oplyste ejere, ændringerne i porteføljeallokeringer i disse ejere og andre målinger. Tallet går fra 0 til 100, hvor højere tal indikerer et højere niveau af akkumulering for sine jævnaldrende, og 50 er gennemsnittet.
Opdateringsfrekvens: Dagligt
Se Ownership Explorer, som giver en liste over højest rangerende virksomheder.
AI+ Ask Fintel’s AI assistant about First Trust Exchange-Traded AlphaDEX Fund - First Trust Materials AlphaDEX Fund.
Select a question to share a public post with an AI-crafted answer.
Thinking of good questions…
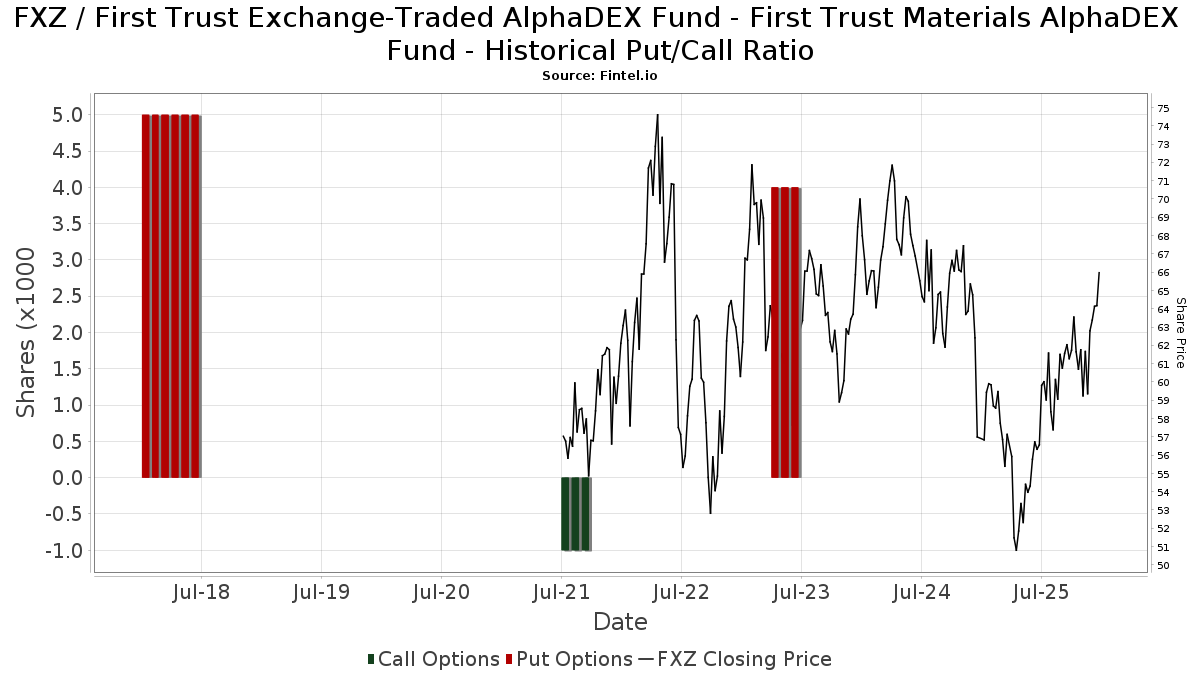
Institutionel Put/Call-forhold
Ud over at indberette standardaktie- og gældsudstedelser skal institutter med mere end 100 mill. aktiver under forvaltning også oplyse deres put- og call-optionsbeholdninger. Da salgsoptioner generelt indikerer negativ stemning, og købsoptioner indikerer positiv stemning, kan vi få en fornemmelse af den overordnede institutionelle stemning ved at plotte forholdet mellem put og kald. Diagrammet til højre viser det historiske put/call-forhold for dette instrument.
Brug af Put/Call Ratio som en indikator for investorernes stemning overvinder en af de vigtigste mangler ved at bruge totalt institutionelt ejerskab, som er, at en betydelig mængde af aktiver under forvaltning investeres passivt for at spore indekser. Passivt forvaltede fonde køber typisk ikke optioner, så indikatoren for put/call-forholdet følger mere nøje følelsen af aktivt forvaltede fonde.
13F og NPORT arkivering
Detaljer om 13F-arkivering er gratis. Detaljer om NP-ansøgninger kræver et premium-medlemskab. Grønne rækker angiver nye positioner. Røde rækker angiver lukkede positioner. Klik på linket ikon for at se den fulde transaktionshistorik.
Opgrader
for at låse premium-data op og eksportere til Excel ![]() .
.
| Fil dato | Kilde | Investor | Type | Gennemsnitlig pris (Øst) |
Aktier | Δ Aktier (%) |
Rapporteret Værdi ($1000) |
Δ Værdi (%) |
Port Alloc (%) |
|
|---|---|---|---|---|---|---|---|---|---|---|
| 2026-02-17 | 13F | Schrum Private Wealth Management LLC | 7.730 | 0,00 | 501 | 5,25 | ||||
| 2026-02-17 | 13F | Tower Research Capital LLC (TRC) | 1.297 | -77,95 | 84 | -76,80 | ||||
| 2025-11-12 | 13F | Aptus Capital Advisors, LLC | 0 | -100,00 | 0 | |||||
| 2025-10-22 | 13F | Motco | 0 | -100,00 | 0 | |||||
| 2026-02-02 | 13F | Truist Financial Corp | 46.097 | 3,21 | 2.988 | 8,65 | ||||
| 2026-02-18 | 13F | Financial Advisory Service, Inc. | 2.010 | 0,00 | 130 | 5,69 | ||||
| 2026-01-29 | 13F | Nbc Securities, Inc. | 837 | 25,68 | 54 | 31,71 | ||||
| 2026-02-10 | 13F | Goldman Sachs Group Inc | 63.246 | -18,77 | 4.100 | -14,52 | ||||
| 2026-01-16 | 13F | Ronald Blue Trust, Inc. | 143 | 0,00 | 9 | 12,50 | ||||
| 2026-02-12 | 13F | Commonwealth Equity Services, Llc | 57.591 | 1,51 | 3.733 | 124.333,33 | ||||
| 2026-02-05 | 13F | Petix & Botte Co | 3.418 | 0,00 | 222 | 5,24 | ||||
| 2026-01-26 | 13F | Private Trust Co Na | 282 | 0,00 | 18 | 5,88 | ||||
| 2026-02-06 | 13F | Pnc Financial Services Group, Inc. | 3.345 | -7,90 | 217 | -3,14 | ||||
| 2026-01-23 | 13F | Farther Finance Advisors, LLC | 10.036 | 53,39 | 651 | 61,69 | ||||
| 2026-01-13 | 13F | CoreCap Advisors, LLC | 3.610 | -11,52 | 234 | -6,77 | ||||
| 2026-01-27 | 13F | Purus Wealth Management, LLC | 15.259 | -3,15 | 989 | 1,96 | ||||
| 2026-02-14 | 13F | Rockefeller Capital Management L.P. | 26.148 | -0,37 | 1.695 | 4,89 | ||||
| 2026-02-06 | 13F | IFP Advisors, Inc | 1.844 | 0,00 | 120 | 5,31 | ||||
| 2026-01-20 | 13F | Thurston, Springer, Miller, Herd & Titak, Inc. | 60 | 4 | ||||||
| 2026-02-17 | 13F | Susquehanna International Group, Llp | 31.517 | -23,10 | 2.043 | -19,06 | ||||
| 2026-02-17 | 13F | Russell Investments Group, Ltd. | 32 | -20,00 | 2 | 0,00 | ||||
| 2026-01-27 | 13F | Elevated Capital Advisors, LLC | 42 | 3 | ||||||
| 2026-01-29 | 13F | Quest 10 Wealth Builders, Inc. | 43 | 0,00 | 3 | 0,00 | ||||
| 2026-02-10 | 13F | Kesler, Norman & Wride, LLC | 13.229 | 1,88 | 858 | 16,28 | ||||
| 2026-01-29 | 13F | Comerica Bank | 859 | 0,00 | 56 | 5,77 | ||||
| 2026-02-13 | 13F | Mml Investors Services, Llc | 13.776 | 7,81 | 893 | 13,49 | ||||
| 2026-01-20 | 13F | Signaturefd, Llc | 339 | 0,00 | 22 | 5,00 | ||||
| 2026-02-17 | 13F | Creative Planning | 8.789 | -0,40 | 570 | 4,79 | ||||
| 2026-02-17 | 13F | Fmr Llc | 75 | 0,00 | 5 | 0,00 | ||||
| 2026-02-13 | 13F | Gts Securities Llc | 8.327 | -26,53 | 540 | -22,78 | ||||
| 2026-02-13 | 13F | Banco Santander, S.A. | 3.510 | -1,96 | 228 | 3,18 | ||||
| 2026-01-14 | 13F | Quad-Cities Investment Group, LLC | 9.603 | -0,21 | 622 | 5,07 | ||||
| 2026-02-17 | 13F | Private Advisor Group, LLC | 21.791 | 67,60 | 1.413 | 76,50 | ||||
| 2026-01-16 | 13F | Piscataqua Savings Bank | 390 | 0,00 | 25 | 4,17 | ||||
| 2026-01-23 | 13F | HBW Advisory Services LLC | 0 | -100,00 | 0 | |||||
| 2026-02-17 | 13F | Modern Wealth Management, LLC | 5.236 | -5,79 | 339 | -0,88 | ||||
| 2026-01-26 | 13F | AE Wealth Management LLC | 1.600 | -4,42 | 104 | 0,00 | ||||
| 2026-01-08 | 13F | Wealth Enhancement Advisory Services, Llc | 73.991 | 4,01 | 5.131 | 14,99 | ||||
| 2026-02-18 | 13F | GWM Advisors LLC | 859 | -45,22 | 56 | -42,71 | ||||
| 2026-01-28 | 13F | WMG Financial Advisors, LLC | 0 | -100,00 | 0 | |||||
| 2026-01-30 | 13F | Wagner Wealth Management, Llc | 207 | 0,49 | 13 | 8,33 | ||||
| 2026-02-03 | 13F | Navellier & Associates Inc | 0 | -100,00 | 0 | -100,00 | ||||
| 2025-11-10 | 13F | ROI Financial Advisors, LLC | 0 | -100,00 | 0 | -100,00 | ||||
| 2026-02-11 | 13F | LPL Financial LLC | 191.863 | -4,50 | 12.437 | 0,52 | ||||
| 2026-02-17 | 13F | Ameriprise Financial Inc | 83.269 | -33,36 | 5.399 | -29,53 | ||||
| 2026-02-10 | 13F | Basepoint Wealth LLC | 322 | 21 | ||||||
| 2025-11-12 | 13F | Principal Securities, Inc. | 0 | -100,00 | 0 | |||||
| 2026-02-13 | 13F | Kestra Advisory Services, LLC | 0 | -100,00 | 0 | |||||
| 2026-01-23 | 13F | DHJJ Financial Advisors, Ltd. | 10 | 0,00 | 1 | |||||
| 2026-02-17 | 13F | Cetera Investment Advisers | 107.581 | -25,90 | 6.974 | -22,02 | ||||
| 2026-02-17 | 13F | Advisory Services Network, LLC | 0 | -100,00 | 0 | |||||
| 2026-02-10 | 13F | Bnp Paribas Arbitrage, Sa | 0 | -100,00 | 0 | |||||
| 2026-02-13 | 13F | Motiv8 Investments LLC | 7 | 0 | ||||||
| 2026-02-13 | 13F | Stifel Financial Corp | 45.436 | 50,99 | 2.945 | 58,93 | ||||
| 2026-02-11 | 13F | Janney Montgomery Scott LLC | 6.998 | 17,18 | 0 | |||||
| 2026-02-02 | 13F | Fifth Third Bancorp | 2.000 | 0,00 | 130 | 4,88 | ||||
| 2026-02-17 | 13F | Royal Bank Of Canada | 41.934 | 37,86 | 2.718 | 45,11 | ||||
| 2026-01-21 | 13F | Flagship Harbor Advisors, Llc | 50 | 3 | ||||||
| 2026-01-28 | 13F | Arkansas Financial Group, Inc. | 0 | -100,00 | 0 | -100,00 | ||||
| 2026-02-13 | 13F | Transamerica Financial Advisors, Inc. | 7 | 0 | ||||||
| 2026-02-17 | 13F | Citadel Advisors Llc | 0 | -100,00 | 0 | |||||
| 2026-01-26 | 13F | Cwm, Llc | 3.045 | -1,62 | 0 | |||||
| 2026-01-28 | 13F | Geneos Wealth Management Inc. | 4.645 | -4,33 | 301 | 0,67 | ||||
| 2026-02-03 | 13F | International Assets Investment Management, Llc | 6.632 | -6,67 | 430 | 3,37 | ||||
| 2026-02-09 | 13F | Harbour Investments, Inc. | 28.820 | 14,28 | 1.868 | 20,28 | ||||
| 2025-10-15 | 13F | Southland Equity Partners LLC | 0 | -100,00 | 0 | |||||
| 2026-01-27 | 13F | Belpointe Asset Management LLC | 5.000 | 0,00 | 324 | 5,54 | ||||
| 2025-10-30 | 13F | WFA Asset Management Corp | 173 | 0,58 | 12 | 0,00 | ||||
| 2026-01-22 | 13F | Apollon Financial, LLC | 6.852 | 0,16 | 444 | 5,46 | ||||
| 2026-02-05 | 13F | Cambridge Investment Research Advisors, Inc. | 35.440 | -3,06 | 2 | 0,00 | ||||
| 2026-01-08 | 13F | Armstrong Advisory Group, Inc | 563 | 0,00 | 36 | 5,88 | ||||
| 2026-02-12 | 13F | RPg Family Wealth Advisory, LLC | 8.011 | -28,24 | 519 | -24,45 | ||||
| 2026-02-17 | 13F | Jones Financial Companies Lllp | 6.387 | -0,70 | 414 | 4,56 | ||||
| 2026-02-10 | 13F | Envestnet Asset Management Inc | 66.705 | 3,74 | 4.324 | 9,19 | ||||
| 2026-01-20 | 13F | AdvisorNet Financial, Inc | 25 | 2 | ||||||
| 2026-02-02 | 13F | Cornerstone Planning Group LLC | 4.205 | -63,69 | 313 | -54,96 | ||||
| 2026-02-13 | 13F | Graney & King, LLC | 306 | 0,66 | 20 | 5,56 | ||||
| 2026-02-11 | 13F | Parallel Advisors, LLC | 975 | -19,42 | 63 | -14,86 | ||||
| 2026-02-02 | 13F | CX Institutional | 1.179 | -50,96 | 0 | |||||
| 2026-01-21 | 13F | Sound Income Strategies, LLC | 4.111 | 297 | ||||||
| 2025-11-14 | 13F | Wealthspire Advisors, LLC | 0 | 0 | ||||||
| 2025-11-12 | 13F | Bellwether Advisors, LLC | 0 | -100,00 | 0 | |||||
| 2026-02-13 | 13F | Morgan Stanley | 176.062 | -0,36 | 11.413 | 4,86 | ||||
| 2026-02-02 | 13F | Oppenheimer & Co Inc | 10.056 | -5,74 | 652 | -0,91 | ||||
| 2026-01-14 | 13F | Spire Wealth Management | 110 | 0,00 | 7 | 16,67 | ||||
| 2026-02-12 | 13F | Hrt Financial Lp | 0 | -100,00 | 0 | |||||
| 2026-02-17 | 13F | Bank Of America Corp /de/ | 102.015 | -1,11 | 6.613 | 4,08 | ||||
| 2026-02-18 | 13F | EP Wealth Advisors, Inc. | 0 | -100,00 | 0 | |||||
| 2026-02-04 | 13F | Ameritas Advisory Services, LLC | 0 | -100,00 | 0 | |||||
| 2026-01-30 | 13F | Urban Wealth Management, LLC | 0 | -100,00 | 0 | -100,00 | ||||
| 2026-02-17 | 13F | Qube Research & Technologies Ltd | 349 | 0,00 | 23 | 4,76 | ||||
| 2026-02-17 | 13F | Risk Paradigm Group, LLC | 7.854 | 509 | ||||||
| 2026-02-13 | 13F | Flow Traders U.s. Llc | 3.520 | 0 | ||||||
| 2026-01-13 | 13F | Mather Group, Llc. | 0 | -100,00 | 0 | |||||
| 2026-01-27 | 13F | Fortis Capital Advisors, LLC | 5.000 | 0,00 | 324 | 5,54 | ||||
| 2026-02-10 | 13F/A | Northwestern Mutual Wealth Management Co | 175 | 19,05 | 11 | 22,22 | ||||
| 2026-01-29 | 13F | Sanctuary Advisors, LLC | 0 | -100,00 | 0 | -100,00 | ||||
| 2026-02-17 | 13F | Green Harvest Asset Management LLC | 27.365 | -0,61 | 1.774 | 4,60 | ||||
| 2026-02-12 | 13F | Summit Financial, LLC | 63.029 | 813,86 | 4.086 | 863,44 | ||||
| 2026-01-29 | 13F | UBS Group AG | 55.245 | -11,71 | 3.581 | -7,06 | ||||
| 2026-02-17 | 13F | Advisor Group Holdings, Inc. | 17.394 | -20,45 | 1.128 | -16,39 | ||||
| 2026-02-12 | 13F | BlackRock, Inc. | 889 | 0,00 | 58 | 5,56 | ||||
| 2026-01-23 | 13F | Assetmark, Inc | 43 | 0,00 | 3 | 0,00 | ||||
| 2026-02-06 | 13F | Global Retirement Partners, LLC | 782 | 0,13 | 51 | 4,17 | ||||
| 2026-02-17 | 13F | Raymond James Financial Inc | 55.241 | -4,50 | 3.581 | 0,51 | ||||
| 2026-02-03 | 13F | We Are One Seven, LLC | 4.601 | 0,00 | 298 | 5,30 | ||||
| 2026-02-12 | 13F | Steward Partners Investment Advisory, Llc | 2.580 | 2,42 | 167 | 7,74 | ||||
| 2026-01-29 | 13F | UMA Financial Services, Inc. | 139 | 0,00 | 9 | 12,50 | ||||
| 2026-02-06 | 13F | HighTower Advisors, LLC | 6.555 | 0,00 | 425 | 5,21 | ||||
| 2026-02-17 | 13F | Ameriflex Group, Inc. | 79 | -50,00 | 5 | -44,44 | ||||
| 2026-02-13 | 13F | Wells Fargo & Company/mn | 342.587 | -0,42 | 22.207 | 4,80 | ||||
| 2026-01-09 | 13F | Atlas Brown,Inc. | 3.798 | -0,03 | 246 | 5,58 | ||||
| 2025-11-06 | 13F | Wedbush Securities Inc | 0 | -100,00 | 0 | |||||
| 2026-02-11 | 13F | Jpmorgan Chase & Co | 0 | 0 |