Grundlæggende statistik
| Institutionelle ejere | 111 total, 111 long only, 0 short only, 0 long/short - change of 0,91% MRQ |
| Gennemsnitlig porteføljeallokering | 0.1146 % - change of -56,72% MRQ |
| Institutionelle aktier (lange) | 3.461.046 (ex 13D/G) - change of -1,65MM shares -32,30% MRQ |
| Institutionel værdi (lang) | $ 166.478 USD ($1000) |
Institutionelt ejerskab og aktionærer
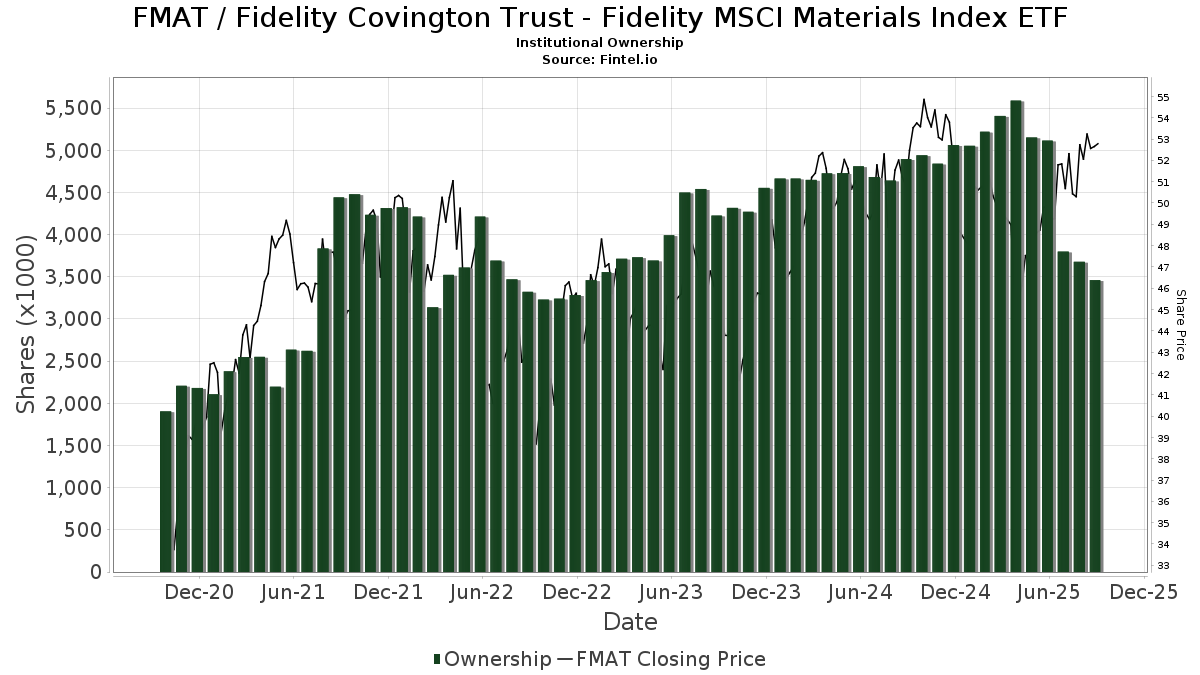
Fidelity Covington Trust - Fidelity MSCI Materials Index ETF (US:FMAT) har 111 institutionelle ejere og aktionærer, der har indsendt 13D/G- eller 13F-formularer til Securities Exchange Commission (SEC). Disse institutioner har i alt 3,461,046 aktier. Største aktionærer omfatter AE Wealth Management LLC, Lido Advisors, LLC, Northern Lights Fund Trust - PFG Fidelity Institutional AM® Equity Sector Strategy Fund Class R Shares, Centerline Wealth Advisors, LLC, Agf Management Ltd, LPL Financial LLC, Commonwealth Equity Services, Llc, Certified Advisory Corp, Advisor Group Holdings, Inc., and Steward Partners Investment Advisory, Llc .
Fidelity Covington Trust - Fidelity MSCI Materials Index ETF (ARCA:FMAT) institutionel ejerskabsstruktur viser aktuelle positioner i virksomheden efter institutioner og fonde, samt seneste ændringer i positionsstørrelse. Større aktionærer kan omfatte individuelle investorer, investeringsforeninger, hedgefonde eller institutioner. Skema 13D angiver, at investoren besidder (eller besidder) mere end 5 % af virksomheden og har til hensigt (eller har til hensigt at) aktivt at forfølge en ændring i forretningsstrategi. Skema 13G indikerer en passiv investering på over 5%.
The share price as of September 8, 2025 is 53,36 / share. Previously, on September 9, 2024, the share price was 50,62 / share. This represents an increase of 5,41% over that period.
Fondens stemningsscore
Fund Sentiment Score (fka Ownership Accumulation Score) finder de aktier, der bliver mest købt af fonde. Det er resultatet af en sofistikeret, multi-faktor kvantitativ model, der identificerer virksomheder med de højeste niveauer af institutionel akkumulering. Scoringsmodellen bruger en kombination af den samlede stigning i oplyste ejere, ændringerne i porteføljeallokeringer i disse ejere og andre målinger. Tallet går fra 0 til 100, hvor højere tal indikerer et højere niveau af akkumulering for sine jævnaldrende, og 50 er gennemsnittet.
Opdateringsfrekvens: Dagligt
Se Ownership Explorer, som giver en liste over højest rangerende virksomheder.
Institutionel Put/Call-forhold
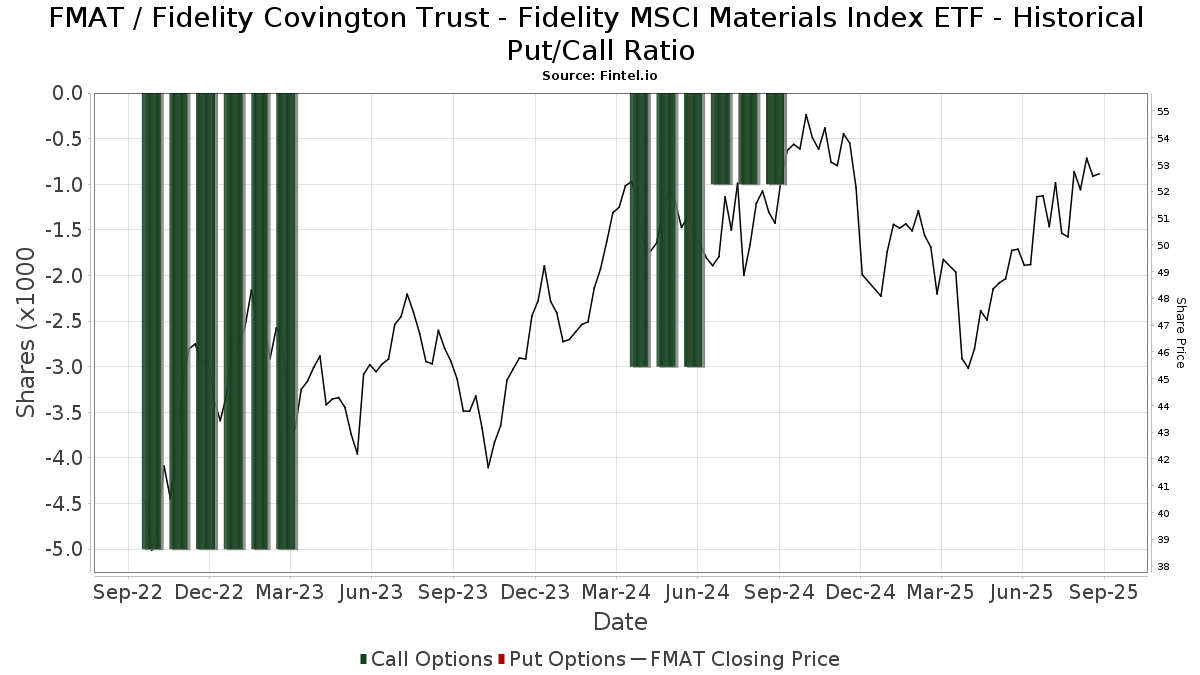
Ud over at indberette standardaktie- og gældsudstedelser skal institutter med mere end 100 mill. aktiver under forvaltning også oplyse deres put- og call-optionsbeholdninger. Da salgsoptioner generelt indikerer negativ stemning, og købsoptioner indikerer positiv stemning, kan vi få en fornemmelse af den overordnede institutionelle stemning ved at plotte forholdet mellem put og kald. Diagrammet til højre viser det historiske put/call-forhold for dette instrument.
Brug af Put/Call Ratio som en indikator for investorernes stemning overvinder en af de vigtigste mangler ved at bruge totalt institutionelt ejerskab, som er, at en betydelig mængde af aktiver under forvaltning investeres passivt for at spore indekser. Passivt forvaltede fonde køber typisk ikke optioner, så indikatoren for put/call-forholdet følger mere nøje følelsen af aktivt forvaltede fonde.
13F og NPORT arkivering
Detaljer om 13F-arkivering er gratis. Detaljer om NP-ansøgninger kræver et premium-medlemskab. Grønne rækker angiver nye positioner. Røde rækker angiver lukkede positioner. Klik på linket ikon for at se den fulde transaktionshistorik.
Opgrader
for at låse premium-data op og eksportere til Excel ![]() .
.
| Fil dato | Kilde | Investor | Type | Gennemsnitlig pris (Øst) |
Aktier | Δ Aktier (%) |
Rapporteret Værdi ($1000) |
Δ Værdi (%) |
Port Alloc (%) |
|
|---|---|---|---|---|---|---|---|---|---|---|
| 2025-07-15 | 13F | Centerline Wealth Advisors, LLC | 174.962 | 4,12 | 8.725 | 7,46 | ||||
| 2025-08-14 | 13F | GWM Advisors LLC | 6.681 | 0,16 | 333 | 3,42 | ||||
| 2025-07-14 | 13F | Sweeney & Michel, Llc | 4.916 | 0,39 | 255 | 23,90 | ||||
| 2025-08-14 | 13F | Certified Advisory Corp | 73.989 | -22,00 | 3.690 | -19,51 | ||||
| 2025-09-04 | 13F/A | Advisor Group Holdings, Inc. | 57.025 | 6,09 | 2.854 | 9,52 | ||||
| 2025-07-28 | 13F | Rosenberg Matthew Hamilton | 3.572 | 0,00 | 178 | 3,49 | ||||
| 2025-05-01 | 13F | Quest 10 Wealth Builders, Inc. | 23 | 1 | ||||||
| 2025-06-30 | NP | Northern Lights Fund Trust - PFG Fidelity Institutional AM® Equity Sector Strategy Fund Class R Shares | 266.055 | -83,18 | 12.646 | -84,19 | ||||
| 2025-07-07 | 13F | Salem Investment Counselors Inc | 0 | -100,00 | 0 | |||||
| 2025-07-09 | 13F | Tounjian Advisory Partners, Llc | 20.512 | -1,51 | 991 | -1,49 | ||||
| 2025-07-17 | 13F | Avondale Wealth Management | 2.496 | 0,00 | 124 | 3,33 | ||||
| 2025-07-25 | 13F | Atria Wealth Solutions, Inc. | 8.638 | 6,22 | 447 | 13,78 | ||||
| 2025-08-14 | 13F | Snowden Capital Advisors LLC | 9.564 | -9,81 | 477 | -7,03 | ||||
| 2025-07-21 | 13F | Ameritas Advisory Services, LLC | 723 | 36 | ||||||
| 2025-08-08 | 13F | Capital Investment Advisory Services, LLC | 100 | 0,00 | 5 | 0,00 | ||||
| 2025-05-14 | 13F | Congress Wealth Management LLC / DE / | 0 | -100,00 | 0 | |||||
| 2025-08-04 | 13F | Creative Financial Designs Inc /adv | 626 | 0,00 | 31 | 3,33 | ||||
| 2025-08-05 | 13F | Bank of New York Mellon Corp | 0 | -100,00 | 0 | |||||
| 2025-08-06 | 13F | AE Wealth Management LLC | 915.330 | 0,64 | 45.648 | 3,86 | ||||
| 2025-08-13 | 13F | Level Four Advisory Services, Llc | 11.248 | 0,00 | 561 | 3,13 | ||||
| 2025-08-14 | 13F | Mml Investors Services, Llc | 6.232 | 17,32 | 0 | |||||
| 2025-08-11 | 13F | Mach-1 Financial Group, Inc. | 0 | -100,00 | 0 | |||||
| 2025-07-18 | 13F | Vicus Capital | 5.014 | 250 | ||||||
| 2025-07-15 | 13F | Lynch & Associates/in | 10.278 | 4,46 | 513 | 7,79 | ||||
| 2025-07-23 | 13F | Peak Financial Management, Inc. | 40.759 | -8,77 | 2.033 | -5,84 | ||||
| 2025-07-11 | 13F | Farther Finance Advisors, LLC | 8 | 0,00 | 0 | |||||
| 2025-07-28 | 13F | Harbour Investments, Inc. | 195 | 0,00 | 10 | 0,00 | ||||
| 2025-08-01 | 13F | Envestnet Asset Management Inc | 31.862 | -76,61 | 1.589 | -75,88 | ||||
| 2025-08-11 | 13F | PFG Private Wealth Management, LLC | 0 | -100,00 | 0 | |||||
| 2025-07-23 | 13F | Heck Capital Advisors, LLC | 15.445 | 1,92 | 770 | 5,19 | ||||
| 2025-07-31 | 13F | Sage Mountain Advisors LLC | 374 | 0,00 | 19 | 0,00 | ||||
| 2025-08-12 | 13F | Absolute Capital Management, LLC | 9.314 | -5,65 | 464 | -2,73 | ||||
| 2025-07-31 | 13F | CVA Family Office, LLC | 149 | 0,00 | 7 | 0,00 | ||||
| 2025-08-12 | 13F | Atlas Capital Advisors Llc | 19 | 1 | ||||||
| 2025-08-11 | 13F | Strategic Wealth Partners, Ltd. | 1 | 0 | ||||||
| 2025-08-11 | 13F | Wealthgarden F.s. Llc | 4.855 | -15,21 | 242 | -12,32 | ||||
| 2025-08-14 | 13F | Stifel Financial Corp | 30.665 | -7,47 | 1.529 | -4,50 | ||||
| 2025-08-11 | 13F | HighTower Advisors, LLC | 12.417 | -14,31 | 619 | -11,57 | ||||
| 2025-07-14 | 13F | AdvisorNet Financial, Inc | 300 | 0,00 | 15 | 0,00 | ||||
| 2025-04-23 | 13F | PMV Capital Advisers, LLC | 0 | -100,00 | 0 | |||||
| 2025-08-12 | 13F | MAI Capital Management | 2.558 | 0,31 | 128 | 3,25 | ||||
| 2025-08-05 | 13F | Trail Ridge Investment Advisors, LLC | 18.901 | -1,82 | 943 | 1,40 | ||||
| 2025-07-11 | 13F | Seacrest Wealth Management, Llc | 15.862 | 2,48 | 791 | 5,89 | ||||
| 2025-08-13 | 13F | SCS Capital Management LLC | 9.235 | 0,00 | 461 | 3,14 | ||||
| 2025-08-12 | 13F | J.w. Cole Advisors, Inc. | 26.206 | 18,54 | 1.307 | 22,28 | ||||
| 2025-08-12 | 13F | Global Retirement Partners, LLC | 820 | 0,86 | 41 | 2,56 | ||||
| 2025-08-14 | 13F | Modern Wealth Management, LLC | 32.778 | -10,11 | 1.635 | -7,21 | ||||
| 2025-05-06 | 13F | Atria Investments Llc | 0 | -100,00 | 0 | |||||
| 2025-07-02 | 13F | Central Pacific Bank - Trust Division | 76 | 0,00 | 4 | 0,00 | ||||
| 2025-08-12 | 13F | Franklin Resources Inc | 0 | -100,00 | 0 | |||||
| 2025-08-12 | 13F | Coldstream Capital Management Inc | 0 | -100,00 | 0 | |||||
| 2025-08-14 | 13F | Citadel Advisors Llc | Put | 0 | -100,00 | 0 | ||||
| 2025-07-16 | 13F | Essex Financial Services, Inc. | 6.136 | -11,34 | 306 | -8,38 | ||||
| 2025-08-14 | 13F | Bank Of America Corp /de/ | 19.874 | 13,21 | 991 | 16,86 | ||||
| 2025-05-15 | 13F/A | Orion Portfolio Solutions, LLC | 6.250 | -3,61 | 302 | -3,53 | ||||
| 2025-08-14 | 13F | Glen Eagle Advisors, LLC | 566 | 0,00 | 28 | 3,70 | ||||
| 2025-04-29 | 13F | Element Wealth, LLC | 0 | -100,00 | 0 | |||||
| 2025-07-23 | 13F | Beaumont Asset Management, L.L.C. | 4.979 | 3,69 | 248 | 6,90 | ||||
| 2025-07-22 | 13F | Yoder Wealth Management, Inc. | 22.275 | 4,91 | 1.111 | 8,29 | ||||
| 2025-08-08 | 13F | Avantax Advisory Services, Inc. | 0 | -100,00 | 0 | |||||
| 2025-07-24 | 13F | Robertson Stephens Wealth Management, LLC | 5.274 | 0,00 | 263 | 3,54 | ||||
| 2025-08-12 | 13F | Jpmorgan Chase & Co | 12.613 | -67,16 | 629 | -66,09 | ||||
| 2025-07-23 | 13F | Sachetta, LLC | 1.850 | -92,69 | 92 | -92,47 | ||||
| 2025-08-08 | 13F | Pnc Financial Services Group, Inc. | 148 | 7 | ||||||
| 2025-08-14 | 13F | Sunbelt Securities, Inc. | 30.991 | -3,97 | 1.493 | -4,23 | ||||
| 2025-05-09 | 13F | Pathway Financial Advisers, LLC | 0 | -100,00 | 0 | |||||
| 2025-08-06 | 13F | Decker Retirement Planning Inc. | 689 | 0,00 | 34 | 3,03 | ||||
| 2025-08-12 | 13F | Steward Partners Investment Advisory, Llc | 55.263 | 23.823,38 | 2.756 | 24.945,45 | ||||
| 2025-08-11 | 13F | Elite Financial, Inc. | 0 | -100,00 | 0 | |||||
| 2025-08-05 | 13F | Lifeworks Advisors, LLC | 32.288 | 10,69 | 1.610 | 14,27 | ||||
| 2025-04-09 | 13F | Roxbury Financial LLC | 0 | -100,00 | 0 | |||||
| 2025-04-29 | 13F | Lee Danner & Bass Inc | 0 | -100,00 | 0 | |||||
| 2025-08-15 | 13F | CI Private Wealth, LLC | 26.229 | -1,08 | 1.308 | 2,11 | ||||
| 2025-08-12 | 13F | Howe & Rusling Inc | 700 | 35 | ||||||
| 2025-05-16 | 13F/A | Kestra Investment Management, LLC | 0 | -100,00 | 0 | |||||
| 2025-08-06 | 13F | Legacy Bridge, LLC | 50 | 0,00 | 2 | 0,00 | ||||
| 2025-07-30 | 13F | Financial Perspectives, Inc | 443 | -8,85 | 22 | -4,35 | ||||
| 2025-07-31 | 13F | Cambridge Investment Research Advisors, Inc. | 18.079 | 6,91 | 1 | |||||
| 2025-07-16 | 13F | Signature Resources Capital Management, LLC | 193 | 10 | ||||||
| 2025-08-13 | 13F | KDK Private Wealth Management, LLC | 7.265 | -2,74 | 362 | 0,56 | ||||
| 2025-08-01 | 13F | Gwn Securities Inc. | 4.748 | 237 | ||||||
| 2025-08-08 | 13F | Emerald Investment Partners, Llc | 320 | 0,00 | 16 | 0,00 | ||||
| 2025-08-12 | 13F | SRS Capital Advisors, Inc. | 195 | 10 | ||||||
| 2025-08-14 | 13F | Brinker Capital Investments, LLC | 0 | -100,00 | 0 | |||||
| 2025-04-24 | 13F | HighMark Wealth Management LLC | 0 | -100,00 | 0 | |||||
| 2025-05-14 | 13F | Kestra Advisory Services, LLC | 0 | -100,00 | 0 | |||||
| 2025-08-14 | 13F | Raymond James Financial Inc | 10.469 | -11,01 | 522 | -8,10 | ||||
| 2025-08-01 | 13F | Penobscot Wealth Management | 19.712 | 13,50 | 983 | 17,16 | ||||
| 2025-08-08 | 13F | Cetera Investment Advisers | 14.739 | -80,94 | 735 | -80,32 | ||||
| 2025-07-25 | 13F | Cwm, Llc | 3.194 | -29,96 | 0 | |||||
| 2025-05-05 | 13F | Kestra Private Wealth Services, Llc | 0 | -100,00 | 0 | |||||
| 2025-05-16 | 13F | Coppell Advisory Solutions LLC | 0 | -100,00 | 0 | |||||
| 2025-08-13 | 13F | Northwestern Mutual Wealth Management Co | 1.404 | 33,46 | 70 | 40,00 | ||||
| 2025-07-30 | 13F | Cullen/frost Bankers, Inc. | 3 | -99,11 | 0 | -100,00 | ||||
| 2025-07-08 | 13F | Arlington Trust Co LLC | 100 | -61,54 | 5 | -66,67 | ||||
| 2025-08-12 | 13F | O'shaughnessy Asset Management, Llc | 2.220 | 13,15 | 111 | 17,02 | ||||
| 2025-08-06 | 13F | Agf Management Ltd | 159.257 | 91,46 | 7.942 | 97,61 | ||||
| 2025-07-15 | 13F | Mather Group, Llc. | 32.076 | 0,00 | 1.600 | 3,23 | ||||
| 2025-08-14 | 13F | Royal Bank Of Canada | 5.394 | 15,38 | 269 | 19,03 | ||||
| 2025-08-14 | 13F | Mariner, LLC | 6.337 | -7,25 | 316 | -4,24 | ||||
| 2025-05-12 | 13F | Providence First Trust Co | 0 | -100,00 | 0 | |||||
| 2025-08-14 | 13F | Comerica Bank | 1.976 | -9,98 | 99 | -7,55 | ||||
| 2025-05-02 | 13F | Capital A Wealth Management, LLC | 78 | 310,53 | 4 | |||||
| 2025-08-13 | 13F | Lido Advisors, LLC | 573.567 | 4,97 | 28.604 | 8,34 | ||||
| 2025-08-14 | 13F | Goldman Sachs Group Inc | 50.000 | -1,16 | 2.494 | 2,00 | ||||
| 2025-03-21 | 13F | Prostatis Group LLC | 0 | -100,00 | 0 | |||||
| 2025-08-11 | 13F | Heritage Wealth Advisors | 75 | 0,00 | 4 | 0,00 | ||||
| 2025-08-12 | 13F | Proequities, Inc. | 0 | 0 | ||||||
| 2025-08-13 | 13F | Russell Investments Group, Ltd. | 0 | -100,00 | 0 | |||||
| 2025-08-13 | 13F | Jones Financial Companies Lllp | 1.964 | 205,92 | 98 | 223,33 | ||||
| 2025-08-15 | 13F | Tower Research Capital LLC (TRC) | 3.909 | -67,85 | 195 | -66,95 | ||||
| 2025-08-15 | 13F | Morgan Stanley | 48.569 | -4,34 | 2.422 | -1,26 | ||||
| 2025-08-14 | 13F | Qube Research & Technologies Ltd | 1.824 | 91 | ||||||
| 2025-05-13 | 13F | Tocqueville Asset Management L.p. | 0 | -100,00 | 0 | |||||
| 2025-08-14 | 13F | Citadel Advisors Llc | Call | 0 | -100,00 | 0 | ||||
| 2025-08-14 | 13F | Susquehanna International Group, Llp | 20.949 | -83,22 | 1.045 | -82,70 | ||||
| 2025-05-14 | 13F | CIBC Private Wealth Group, LLC | 0 | -100,00 | 0 | |||||
| 2025-07-21 | 13F | Exchange Capital Management, Inc. | 16.543 | -3,29 | 825 | -0,24 | ||||
| 2025-07-17 | 13F | Sound Income Strategies, LLC | 201 | -89,07 | 10 | -88,64 | ||||
| 2025-08-14 | 13F | Fmr Llc | 14.660 | 25,22 | 731 | 29,38 | ||||
| 2025-08-14 | 13F | UBS Group AG | 5.200 | 44,93 | 259 | 49,71 | ||||
| 2025-07-15 | 13F | Elevated Capital Advisors, LLC | 22.497 | 0,00 | 1.087 | 0,00 | ||||
| 2025-08-08 | 13F | Tortoise Investment Management, LLC | 2.580 | 0,00 | 129 | 3,23 | ||||
| 2025-08-14 | 13F | Wells Fargo & Company/mn | 34.585 | -49,85 | 1.725 | -48,26 | ||||
| 2025-07-17 | 13F | Smith, Salley & Associates | 13.563 | 0,50 | 676 | 3,68 | ||||
| 2025-07-07 | 13F | Versant Capital Management, Inc | 370 | 0,00 | 18 | 5,88 | ||||
| 2025-04-30 | 13F | Allworth Financial LP | 0 | -100,00 | 0 | |||||
| 2025-07-14 | 13F | Park Avenue Securities Llc | 0 | -100,00 | 0 | |||||
| 2025-07-16 | 13F/A | CX Institutional | 1.929 | -16,42 | 0 | |||||
| 2025-08-11 | 13F | Principal Securities, Inc. | 11.390 | 568 | ||||||
| 2025-08-12 | 13F | LPL Financial LLC | 92.662 | -29,27 | 4.621 | -26,99 | ||||
| 2025-07-24 | 13F | IFP Advisors, Inc | 2.544 | 0,28 | 127 | 3,28 | ||||
| 2025-08-11 | 13F | Citigroup Inc | 4.665 | -35,26 | 233 | -33,33 | ||||
| 2025-05-15 | 13F | Newbridge Financial Services Group, Inc. | 0 | -100,00 | 0 | |||||
| 2025-08-19 | 13F | Advisory Services Network, LLC | 4.344 | -91,06 | 217 | -90,80 | ||||
| 2025-07-14 | 13F | UMA Financial Services, Inc. | 50 | 0,00 | 2 | 0,00 | ||||
| 2025-07-22 | 13F | Wealthcare Advisory Partners LLC | 17.886 | -18,71 | 892 | -16,18 | ||||
| 2025-07-25 | 13F | Concord Wealth Partners | 1.006 | -1,76 | 50 | 2,04 | ||||
| 2025-08-14 | 13F | Citadel Advisors Llc | 30.409 | -53,97 | 1.516 | -52,51 | ||||
| 2025-08-06 | 13F | Commonwealth Equity Services, Llc | 78.126 | -12,12 | 4 | -25,00 | ||||
| 2025-07-17 | 13F | Centennial Wealth Advisory LLC | 4.706 | -7,53 | 236 | -4,08 | ||||
| 2025-08-14 | 13F | Kovitz Investment Group Partners, LLC | 55.051 | 159,98 | 2.745 | 168,33 | ||||
| 2025-04-28 | 13F | Private Trust Co Na | 0 | -100,00 | 0 | |||||
| 2025-08-01 | 13F | Rossby Financial, LCC | 62 | 0,00 | 3 | 50,00 |