Grundlæggende statistik
| Institutionelle aktier (lange) | 4.262.302 - 31,38% (ex 13D/G) - change of -0,51MM shares -10,69% MRQ |
| Institutionel værdi (lang) | $ 98.278 USD ($1000) |
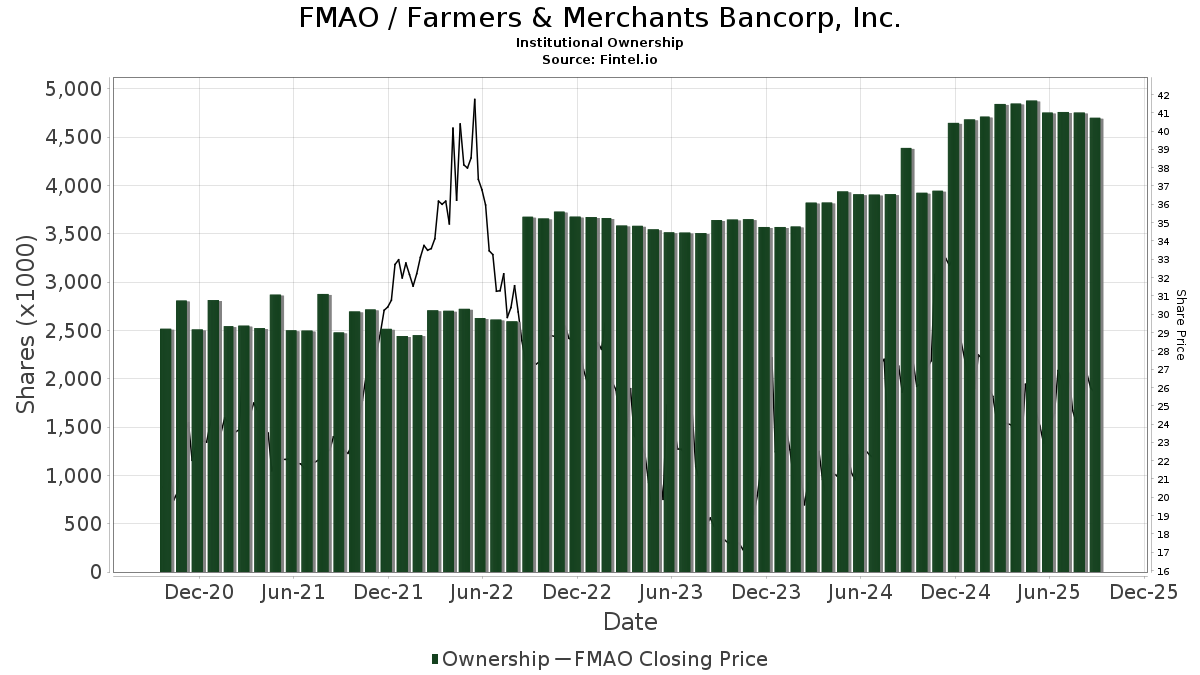
Institutionelt ejerskab og aktionærer
Farmers & Merchants Bancorp, Inc. (US:FMAO) har 94 institutionelle ejere og aktionærer, der har indsendt 13D/G- eller 13F-formularer til Securities Exchange Commission (SEC). Disse institutioner har i alt 4,262,302 aktier. Største aktionærer omfatter BlackRock, Inc., Vanguard Group Inc, Goelzer Investment Management, Inc., Geode Capital Management, Llc, Align Financial, LLC, State Street Corp, Dimensional Fund Advisors Lp, Mendel Money Management, Gryphon Financial Partners LLC, and Northern Trust Corp .
Farmers & Merchants Bancorp, Inc. (NasdaqCM:FMAO) institutionel ejerskabsstruktur viser aktuelle positioner i virksomheden efter institutioner og fonde, samt seneste ændringer i positionsstørrelse. Større aktionærer kan omfatte individuelle investorer, investeringsforeninger, hedgefonde eller institutioner. Skema 13D angiver, at investoren besidder (eller besidder) mere end 5 % af virksomheden og har til hensigt (eller har til hensigt at) aktivt at forfølge en ændring i forretningsstrategi. Skema 13G indikerer en passiv investering på over 5%.
The share price as of March 27, 2026 is 25,14 / share. Previously, on March 28, 2025, the share price was 24,15 / share. This represents an increase of 4,10% over that period.
Fondens stemningsscore
Fund Sentiment Score (fka Ownership Accumulation Score) finder de aktier, der bliver mest købt af fonde. Det er resultatet af en sofistikeret, multi-faktor kvantitativ model, der identificerer virksomheder med de højeste niveauer af institutionel akkumulering. Scoringsmodellen bruger en kombination af den samlede stigning i oplyste ejere, ændringerne i porteføljeallokeringer i disse ejere og andre målinger. Tallet går fra 0 til 100, hvor højere tal indikerer et højere niveau af akkumulering for sine jævnaldrende, og 50 er gennemsnittet.
Opdateringsfrekvens: Dagligt
Se Ownership Explorer, som giver en liste over højest rangerende virksomheder.
AI+ Ask Fintel’s AI assistant about Farmers & Merchants Bancorp, Inc..
Select a question to share a public post with an AI-crafted answer.
Thinking of good questions…
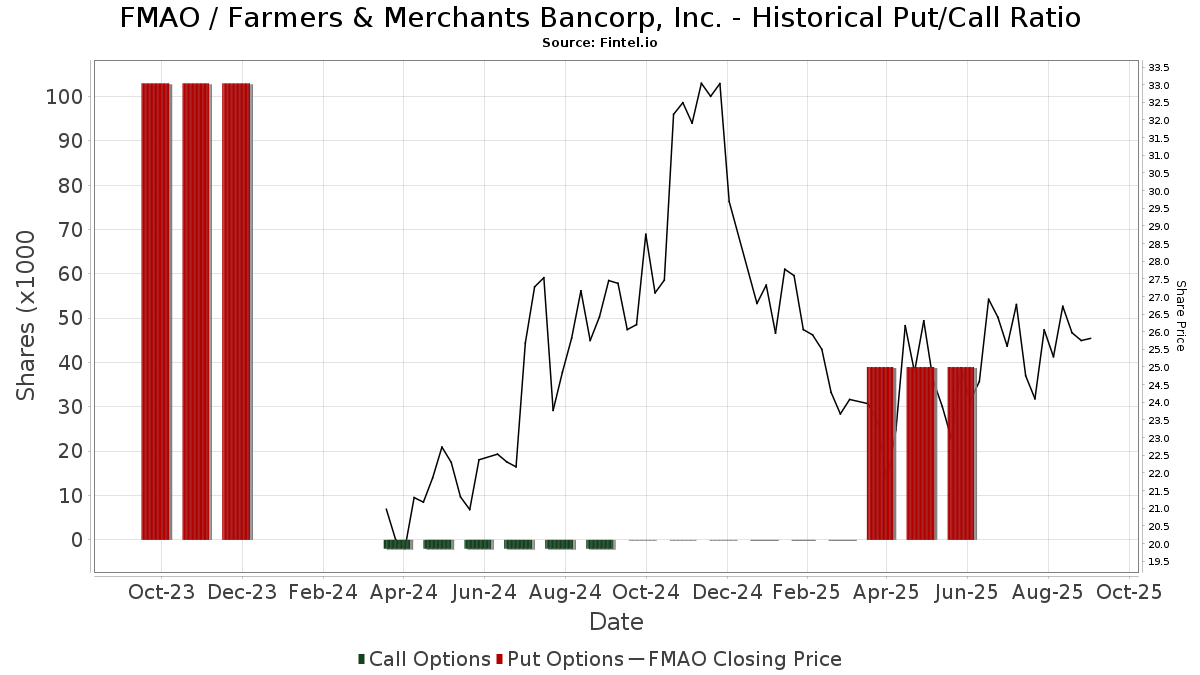
Institutionel Put/Call-forhold
Ud over at indberette standardaktie- og gældsudstedelser skal institutter med mere end 100 mill. aktiver under forvaltning også oplyse deres put- og call-optionsbeholdninger. Da salgsoptioner generelt indikerer negativ stemning, og købsoptioner indikerer positiv stemning, kan vi få en fornemmelse af den overordnede institutionelle stemning ved at plotte forholdet mellem put og kald. Diagrammet til højre viser det historiske put/call-forhold for dette instrument.
Brug af Put/Call Ratio som en indikator for investorernes stemning overvinder en af de vigtigste mangler ved at bruge totalt institutionelt ejerskab, som er, at en betydelig mængde af aktiver under forvaltning investeres passivt for at spore indekser. Passivt forvaltede fonde køber typisk ikke optioner, så indikatoren for put/call-forholdet følger mere nøje følelsen af aktivt forvaltede fonde.
13F og NPORT arkivering
Detaljer om 13F-arkivering er gratis. Detaljer om NP-ansøgninger kræver et premium-medlemskab. Grønne rækker angiver nye positioner. Røde rækker angiver lukkede positioner. Klik på linket ikon for at se den fulde transaktionshistorik.
Opgrader
for at låse premium-data op og eksportere til Excel ![]() .
.
| Fil dato | Kilde | Investor | Type | Gennemsnitlig pris (Øst) |
Aktier | Δ Aktier (%) |
Rapporteret Værdi ($1000) |
Δ Værdi (%) |
Port Alloc (%) |
|
|---|---|---|---|---|---|---|---|---|---|---|
| 2026-02-10 | 13F | Rothschild Investment Llc | 8 | 300,00 | 0 | |||||
| 2026-02-12 | 13F | Jane Street Group, Llc | 15.762 | -27,52 | 390 | -28,36 | ||||
| 2026-02-12 | 13F | Dimensional Fund Advisors Lp | 214.561 | 6,28 | 5.304 | 5,05 | ||||
| 2026-02-17 | 13F | Wiley Bros.-aintree Capital, Llc | 8.259 | 0,95 | 204 | 0,00 | ||||
| 2025-11-04 | 13F | Keybank National Association/oh | 0 | -100,00 | 0 | |||||
| 2026-02-06 | 13F | Larson Financial Group LLC | 2.000 | 0,00 | 49 | -2,00 | ||||
| 2026-02-10 | 13F | Acadian Asset Management Llc | 7.243 | -3,63 | 0 | |||||
| 2026-02-19 | 13F | Invesco Ltd. | 14.887 | 5,81 | 368 | 4,84 | ||||
| 2026-02-11 | 13F | Franklin Resources Inc | 8.308 | 0,00 | 205 | -0,97 | ||||
| 2026-02-17 | 13F | Advisor Group Holdings, Inc. | 4.378 | -33,30 | 108 | -37,57 | ||||
| 2026-02-12 | 13F | MetLife Investment Management, LLC | 6.907 | 0,00 | 171 | -1,16 | ||||
| 2026-02-17 | 13F | Warren Averett Asset Management, LLC | 11.926 | 33,74 | 295 | 31,84 | ||||
| 2026-02-13 | 13F | Venture Visionary Partners LLC | 30.928 | 0,14 | 765 | -1,04 | ||||
| 2026-02-13 | 13F | Charles Schwab Investment Management Inc | 38.162 | 0,00 | 943 | -1,15 | ||||
| 2026-02-13 | 13F | Manufacturers Life Insurance Company, The | 0 | -100,00 | 0 | |||||
| 2026-01-26 | 13F | Hendershot Investments Inc. | 30 | 0,00 | 250 | 16,82 | ||||
| 2026-01-27 | 13F | Revisor Wealth Management LLC | 11.607 | 0,00 | 310 | 8,80 | ||||
| 2026-01-29 | 13F | Mendel Money Management | 127.553 | -6,66 | 3.153 | -7,73 | ||||
| 2026-02-17 | 13F | Bank Of America Corp /de/ | 14.920 | 56,77 | 369 | 54,62 | ||||
| 2026-02-05 | 13F | Allworth Financial LP | 12 | -14,29 | 0 | |||||
| 2025-11-14 | 13F | Susquehanna International Group, Llp | 0 | -100,00 | 0 | |||||
| 2026-02-05 | 13F | Hicks Capital Management Llc | 14.513 | 0,00 | 359 | -1,10 | ||||
| 2026-02-11 | 13F | Group One Trading, L.p. | 0 | -100,00 | 0 | |||||
| 2026-02-17 | 13F | MIRAE ASSET GLOBAL ETFS HOLDINGS Ltd. | 5.911 | -1,20 | 146 | -2,01 | ||||
| 2026-01-23 | 13F | State of Alaska, Department of Revenue | 423 | 0 | ||||||
| 2026-01-13 | 13F | CoreCap Advisors, LLC | 2.224 | 0,95 | 55 | -1,82 | ||||
| 2026-02-17 | 13F | Mercer Global Advisors Inc /adv | 9.879 | 10,16 | 244 | 8,93 | ||||
| 2026-02-17 | 13F | Quantinno Capital Management LP | 27.762 | 686 | ||||||
| 2026-02-12 | 13F | Integrated Quantitative Investments LLC | 8.391 | 207 | ||||||
| 2025-11-13 | 13F | Renaissance Technologies Llc | 0 | -100,00 | 0 | |||||
| 2026-02-17 | 13F | Align Financial, LLC | 276.864 | 277 | ||||||
| 2026-02-12 | 13F | Nuveen, LLC | 27.973 | 0,00 | 691 | -1,14 | ||||
| 2026-01-14 | 13F | TrueMark Investments, LLC | 0 | -100,00 | 0 | |||||
| 2026-01-26 | 13F | Cwm, Llc | 928 | 6,79 | 0 | |||||
| 2026-02-17 | 13F | Optiver Holding B.V. | 98 | -58,47 | 2 | -60,00 | ||||
| 2026-02-17 | 13F | Tower Research Capital LLC (TRC) | 475 | -25,67 | 12 | -26,67 | ||||
| 2026-02-12 | 13F | New York State Common Retirement Fund | 4.207 | 0,00 | 104 | -1,90 | ||||
| 2026-01-13 | 13F | Fort Washington Investment Advisors Inc /oh/ | 34.233 | 0,00 | 846 | -1,17 | ||||
| 2026-02-13 | 13F | Marshall Wace, Llp | 37.696 | 932 | ||||||
| 2026-02-12 | 13F | BlackRock, Inc. | 948.810 | 1,77 | 23.455 | 0,59 | ||||
| 2026-02-13 | 13F | American Century Companies Inc | 14.331 | 0,00 | 354 | -1,12 | ||||
| 2026-02-17 | 13F | Aqr Capital Management Llc | 15.310 | 11,48 | 378 | 10,20 | ||||
| 2026-02-13 | 13F | Sterling Capital Management LLC | 732 | -16,44 | 18 | -14,29 | ||||
| 2026-02-13 | 13F | Citigroup Inc | 1.425 | 25,55 | 35 | 25,00 | ||||
| 2026-02-10 | 13F | Goldman Sachs Group Inc | 19.184 | 23,99 | 474 | 22,80 | ||||
| 2026-02-11 | 13F | Ameritas Investment Partners, Inc. | 1.340 | 33 | ||||||
| 2026-02-17 | 13F | Russell Investments Group, Ltd. | 29.178 | 18,45 | 721 | 17,05 | ||||
| 2026-02-10 | 13F | Bnp Paribas Arbitrage, Sa | 3.564 | 11,24 | 88 | 10,00 | ||||
| 2026-02-06 | 13F | Legato Capital Management LLC | 8.391 | 207 | ||||||
| 2026-02-13 | 13F | Police & Firemen's Retirement System of New Jersey | 3.164 | 0,00 | 78 | -1,27 | ||||
| 2026-02-13 | 13F | Wells Fargo & Company/mn | 21.316 | 43,87 | 527 | 42,16 | ||||
| 2026-02-17 | 13F | Northern Trust Corp | 88.103 | -9,07 | 2.178 | -10,15 | ||||
| 2026-02-05 | 13F | Amalgamated Bank | 399 | -5,00 | 0 | |||||
| 2025-10-07 | 13F | Thurston, Springer, Miller, Herd & Titak, Inc. | 0 | -100,00 | 0 | |||||
| 2026-02-11 | 13F | Simplex Trading, Llc | 0 | -100,00 | 0 | |||||
| 2025-11-14 | 13F | Raymond James Financial Inc | 0 | -100,00 | 0 | -100,00 | ||||
| 2026-02-13 | 13F | Barclays Plc | 22.679 | 8,82 | 561 | 7,49 | ||||
| 2025-09-29 | NP | SUNAMERICA SERIES TRUST - SA Small Cap Index Portfolio Class 1 | 1.441 | -0,48 | 35 | -8,11 | ||||
| 2026-02-06 | 13F | Pnc Financial Services Group, Inc. | 0 | -100,00 | 0 | |||||
| 2026-02-11 | 13F | Rise Advisors, LLC | 0 | -100,00 | 0 | |||||
| 2026-02-09 | 13F | Legal & General Group Plc | 1.124 | 0,00 | 28 | -3,57 | ||||
| 2026-02-11 | 13F | Buckingham Strategic Partners | 0 | -100,00 | 0 | |||||
| 2026-02-13 | 13F | Smartleaf Asset Management LLC | 1 | 0 | ||||||
| 2026-01-29 | 13F | UBS Group AG | 3.040 | -52,61 | 75 | -53,12 | ||||
| 2026-02-11 | 13F | Los Angeles Capital Management Llc | 14.515 | 0,00 | 344 | -5,51 | ||||
| 2026-01-08 | 13F | Versant Capital Management, Inc | 353 | 218,02 | 9 | 300,00 | ||||
| 2026-02-06 | 13F | EverSource Wealth Advisors, LLC | 27 | 107,69 | 1 | |||||
| 2026-02-11 | 13F | Jpmorgan Chase & Co | 10.268 | -19,16 | 254 | -20,19 | ||||
| 2025-11-05 | 13F | SBI Securities Co., Ltd. | 0 | -100,00 | 0 | |||||
| 2026-01-08 | 13F | Gryphon Financial Partners LLC | 100.185 | 0,00 | 2.477 | -1,16 | ||||
| 2025-09-29 | NP | KCXIX - Knights of Columbus U.S. All Cap Index Fund I Shares | 56 | 7,69 | 1 | 0,00 | ||||
| 2026-01-05 | 13F | GAMMA Investing LLC | 1.692 | 19,66 | 42 | 17,14 | ||||
| 2026-02-09 | 13F | Hartland & Co., LLC | 2.600 | 0,00 | 64 | -1,54 | ||||
| 2026-02-17 | 13F | California State Teachers Retirement System | 782 | -15,37 | 19 | -17,39 | ||||
| 2026-02-20 | 13F | Sunbelt Securities, Inc. | 1 | 0 | ||||||
| 2026-01-08 | 13F | True Wealth Design, LLC | 2 | -50,00 | 0 | |||||
| 2026-02-06 | 13F | Covestor Ltd | 19 | -20,83 | 0 | |||||
| 2026-03-06 | 13F | Hsbc Holdings Plc | 9.493 | 3,42 | 232 | 0,87 | ||||
| 2026-02-17 | 13F | Fmr Llc | 249 | 63,82 | 6 | 100,00 | ||||
| 2026-01-14 | 13F | Goelzer Investment Management, Inc. | 485.064 | 1.659,77 | 11.991 | 1.640,20 | ||||
| 2026-02-06 | 13F | IFP Advisors, Inc | 29 | 262,50 | 1 | |||||
| 2026-02-17 | 13F | Millennium Management Llc | 33.820 | 32,72 | 836 | 31,24 | ||||
| 2026-02-11 | 13F | Deutsche Bank Ag\ | 11.351 | -15,26 | 281 | -16,42 | ||||
| 2026-02-13 | 13F | Rhumbline Advisers | 15.639 | -13,97 | 387 | -14,98 | ||||
| 2026-02-13 | 13F | Morgan Stanley | 24.844 | 27,60 | 614 | 26,34 | ||||
| 2026-02-17 | 13F | Bridgeway Capital Management Inc | 14.422 | -27,82 | 357 | -28,66 | ||||
| 2026-01-20 | 13F | Trust Co Of Toledo Na /oh/ | 5.940 | -25,19 | 147 | -26,26 | ||||
| 2026-01-29 | 13F | Vanguard Group Inc | 674.308 | -1,22 | 16.669 | -2,37 | ||||
| 2026-02-09 | 13F | Geode Capital Management, Llc | 301.252 | 0,80 | 7.448 | -0,36 | ||||
| 2026-02-13 | 13F | SRS Capital Advisors, Inc. | 202 | 61,60 | 5 | 33,33 | ||||
| 2026-02-11 | 13F | Janney Montgomery Scott LLC | 12.684 | -11,18 | 0 | |||||
| 2026-02-13 | 13F | MAI Capital Management | 13 | 0 | ||||||
| 2026-02-17 | 13F | Trexquant Investment LP | 8.861 | 219 | ||||||
| 2025-10-15 | 13F | CWM Advisors, LLC | 0 | -100,00 | 0 | -100,00 | ||||
| 2026-02-13 | 13F | Great West Life Assurance Co /can/ | 1.406 | 0 | ||||||
| 2025-11-12 | 13F | First Trust Advisors Lp | 0 | -100,00 | 0 | |||||
| 2026-02-17 | 13F | Citadel Advisors Llc | 20.518 | 54,58 | 507 | 53,17 | ||||
| 2026-02-17 | 13F | First Manhattan Co | 9.605 | 240 | ||||||
| 2026-02-12 | 13F | Jane Street Group, Llc | Put | 0 | -100,00 | 0 | -100,00 | |||
| 2026-02-10 | 13F | Bank of New York Mellon Corp | 46.173 | 19,40 | 1.141 | 17,99 | ||||
| 2026-01-06 | 13F | Abner Herrman & Brock Llc | 8.869 | 0,00 | 0 | |||||
| 2026-02-17 | 13F | Royal Bank Of Canada | 1.159 | 124,61 | 28 | 133,33 | ||||
| 2026-01-23 | 13F | Farther Finance Advisors, LLC | 2.531 | 15,84 | 63 | 14,81 | ||||
| 2025-09-29 | NP | PRFZ - Invesco FTSE RAFI US 1500 Small-Mid ETF This fund is a listed as child fund of Invesco Ltd. and if that institution has disclosed ownership in this security, then these positions will not be double counted when calculating total shares and total value | 1.593 | 70,74 | 38 | 58,33 | ||||
| 2026-02-13 | 13F | Squarepoint Ops LLC | 21.381 | -15,40 | 529 | -16,46 | ||||
| 2026-02-13 | 13F | State Street Corp | 252.537 | -0,31 | 6.300 | -0,55 | ||||
| 2026-01-23 | 13F | Carnegie Capital Asset Management, LLC | 0 | -100,00 | 0 | |||||
| 2026-01-15 | 13F | Nisa Investment Advisors, Llc | 280 | -35,78 | 7 | -40,00 | ||||
| 2025-09-29 | NP | RSSL - Global X Russell 2000 ETF | 6.459 | -15,71 | 155 | -22,50 | ||||
| 2026-01-21 | 13F | Capital Advisors, Ltd. LLC | 33 | 0,00 | 0 | |||||
| 2026-02-17 | 13F | Alliancebernstein L.p. | 10.120 | 0,00 | 250 | -1,19 | ||||
| 2025-11-13 | 13F | Strategic Financial Concepts, LLC | 0 | -100,00 | 0 |