Grundlæggende statistik
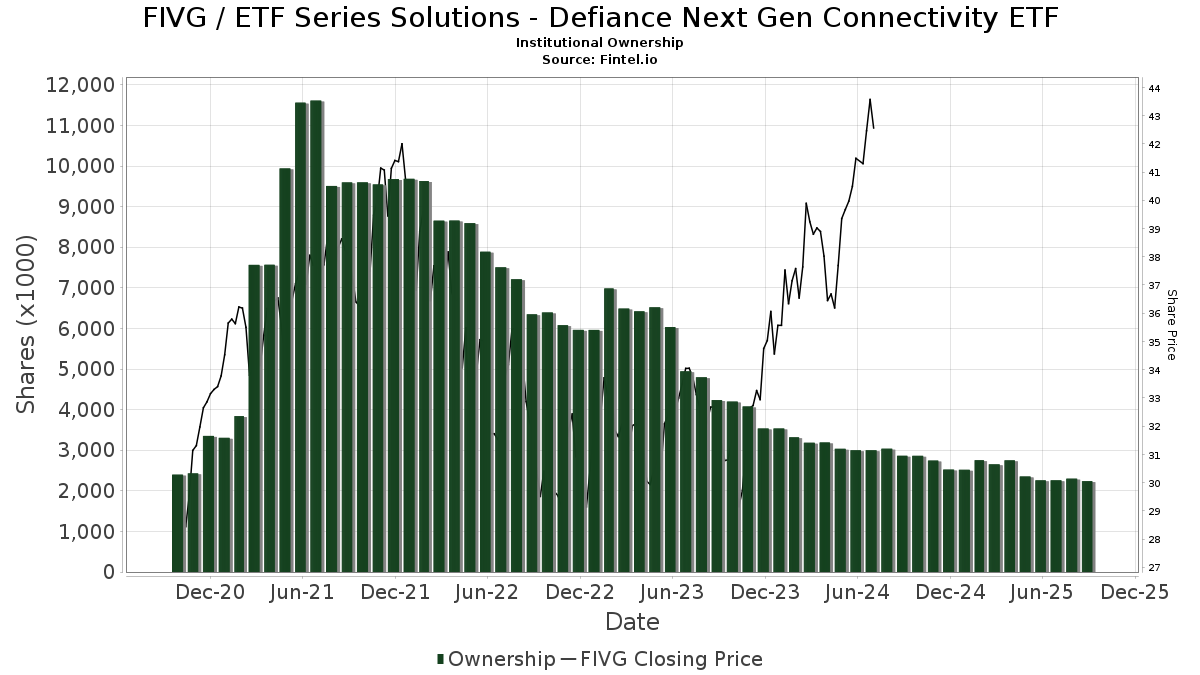
| Institutionelle ejere | 158 total, 158 long only, 0 short only, 0 long/short - change of 1,27% MRQ |
| Gennemsnitlig porteføljeallokering | 0.0688 % - change of -4,45% MRQ |
| Institutionelle aktier (lange) | 1.925.767 (ex 13D/G) - change of -0,23MM shares -10,52% MRQ |
| Institutionel værdi (lang) | $ 117.955 USD ($1000) |
Institutionelt ejerskab og aktionærer
ETF Series Solutions - Defiance Next Gen Connectivity ETF (US:FIVG) har 158 institutionelle ejere og aktionærer, der har indsendt 13D/G- eller 13F-formularer til Securities Exchange Commission (SEC). Disse institutioner har i alt 1,925,767 aktier. Største aktionærer omfatter LPL Financial LLC, Cetera Investment Advisers, Kwmg, Llc, Raymond James Financial Inc, UBS Group AG, Commonwealth Equity Services, Llc, Pnc Financial Services Group, Inc., Rockefeller Capital Management L.P., HighTower Advisors, LLC, and Northstar Asset Management Llc .
ETF Series Solutions - Defiance Next Gen Connectivity ETF (ARCA:FIVG) institutionel ejerskabsstruktur viser aktuelle positioner i virksomheden efter institutioner og fonde, samt seneste ændringer i positionsstørrelse. Større aktionærer kan omfatte individuelle investorer, investeringsforeninger, hedgefonde eller institutioner. Skema 13D angiver, at investoren besidder (eller besidder) mere end 5 % af virksomheden og har til hensigt (eller har til hensigt at) aktivt at forfølge en ændring i forretningsstrategi. Skema 13G indikerer en passiv investering på over 5%.
Fondens stemningsscore
Fund Sentiment Score (fka Ownership Accumulation Score) finder de aktier, der bliver mest købt af fonde. Det er resultatet af en sofistikeret, multi-faktor kvantitativ model, der identificerer virksomheder med de højeste niveauer af institutionel akkumulering. Scoringsmodellen bruger en kombination af den samlede stigning i oplyste ejere, ændringerne i porteføljeallokeringer i disse ejere og andre målinger. Tallet går fra 0 til 100, hvor højere tal indikerer et højere niveau af akkumulering for sine jævnaldrende, og 50 er gennemsnittet.
Opdateringsfrekvens: Dagligt
Se Ownership Explorer, som giver en liste over højest rangerende virksomheder.
AI+ Ask Fintel’s AI assistant about ETF Series Solutions - Defiance Next Gen Connectivity ETF.
Select a question to share a public post with an AI-crafted answer.
Thinking of good questions…
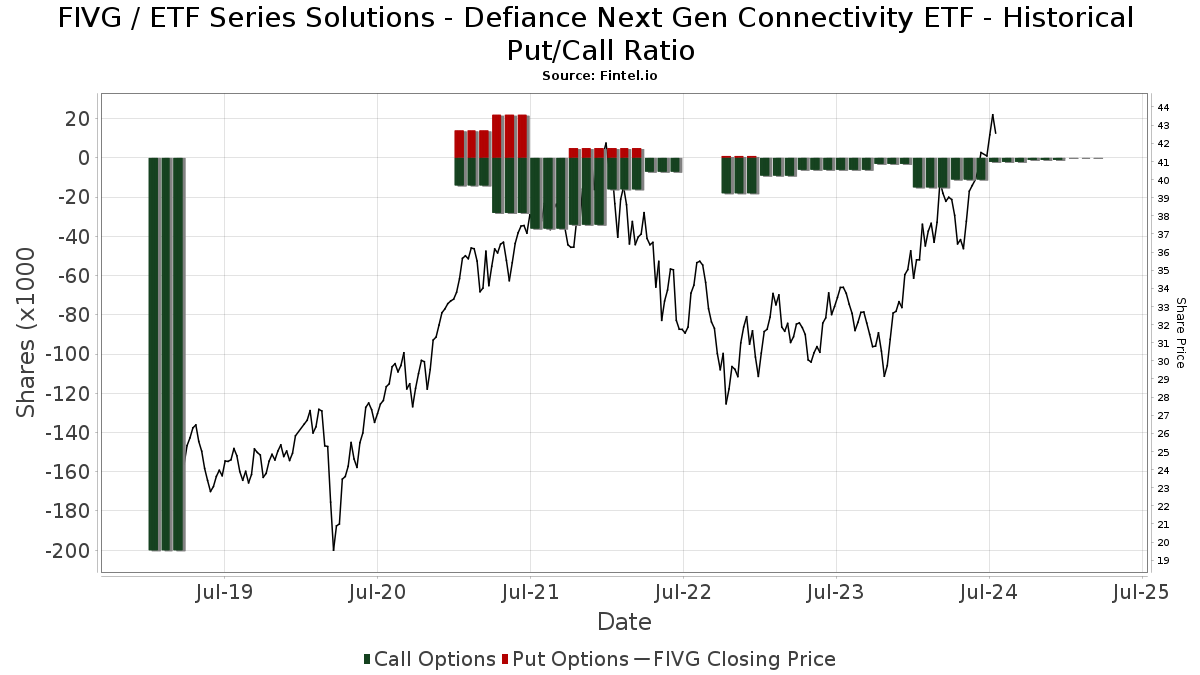
Institutionel Put/Call-forhold
Ud over at indberette standardaktie- og gældsudstedelser skal institutter med mere end 100 mill. aktiver under forvaltning også oplyse deres put- og call-optionsbeholdninger. Da salgsoptioner generelt indikerer negativ stemning, og købsoptioner indikerer positiv stemning, kan vi få en fornemmelse af den overordnede institutionelle stemning ved at plotte forholdet mellem put og kald. Diagrammet til højre viser det historiske put/call-forhold for dette instrument.
Brug af Put/Call Ratio som en indikator for investorernes stemning overvinder en af de vigtigste mangler ved at bruge totalt institutionelt ejerskab, som er, at en betydelig mængde af aktiver under forvaltning investeres passivt for at spore indekser. Passivt forvaltede fonde køber typisk ikke optioner, så indikatoren for put/call-forholdet følger mere nøje følelsen af aktivt forvaltede fonde.
13F og NPORT arkivering
Detaljer om 13F-arkivering er gratis. Detaljer om NP-ansøgninger kræver et premium-medlemskab. Grønne rækker angiver nye positioner. Røde rækker angiver lukkede positioner. Klik på linket ikon for at se den fulde transaktionshistorik.
Opgrader
for at låse premium-data op og eksportere til Excel ![]() .
.
| Fil dato | Kilde | Investor | Type | Gennemsnitlig pris (Øst) |
Aktier | Δ Aktier (%) |
Rapporteret Værdi ($1000) |
Δ Værdi (%) |
Port Alloc (%) |
|
|---|---|---|---|---|---|---|---|---|---|---|
| 2026-01-23 | 13F | Farther Finance Advisors, LLC | 4.942 | 3.760,94 | 315 | 4.400,00 | ||||
| 2026-02-05 | 13F | 626 Financial, LLC | 3.345 | -27,19 | 214 | -24,73 | ||||
| 2026-03-24 | 13F/A | Barclays Plc | 0 | -100,00 | 0 | |||||
| 2026-02-17 | 13F | Warren Averett Asset Management, LLC | 13.806 | 1,40 | 881 | 5,01 | ||||
| 2026-02-06 | 13F | Frisch Financial Group, Inc. | 9.420 | 0,06 | 601 | 3,62 | ||||
| 2026-01-29 | 13F | Advantage Trust Co | 35.560 | 0,00 | 2.270 | 3,51 | ||||
| 2026-02-06 | 13F | Insight Inv LLC | 4.567 | 24,61 | 292 | 28,76 | ||||
| 2026-02-06 | 13F | IFP Advisors, Inc | 18 | 0,00 | 1 | 0,00 | ||||
| 2026-02-17 | 13F | Tower Research Capital LLC (TRC) | 29 | -99,66 | 2 | -99,81 | ||||
| 2026-01-29 | 13F | Dunhill Financial, LLC | 87 | -96,92 | 6 | -97,13 | ||||
| 2026-01-12 | 13F | Seacrest Wealth Management, Llc | 5.019 | -23,80 | 327 | -23,47 | ||||
| 2026-01-26 | 13F | Mirae Asset Global Investments Co., Ltd. | 0 | -100,00 | 0 | |||||
| 2026-02-12 | 13F | Wedbush Securities Inc | 16.366 | 24,43 | 1 | |||||
| 2026-02-06 | 13F | Pnc Financial Services Group, Inc. | 74.912 | -26,06 | 4.782 | -23,46 | ||||
| 2026-02-06 | 13F | Kingdom Financial Group LLC. | 0 | 0 | ||||||
| 2026-02-17 | 13F | Fmr Llc | 6.375 | 14,70 | 407 | 18,71 | ||||
| 2026-02-11 | 13F | Fortune Financial Group, Inc. | 5.642 | 0 | ||||||
| 2026-02-11 | 13F | Parallel Advisors, LLC | 897 | 0,11 | 57 | 3,64 | ||||
| 2026-01-30 | 13F | Wealthstar Advisors, Llc | 0 | -100,00 | 0 | |||||
| 2026-02-13 | 13F | Stifel Financial Corp | 13.462 | -3,09 | 859 | 0,35 | ||||
| 2026-02-06 | 13F | Resolute Wealth Strategies, LLC | 4.273 | -7,53 | 273 | -4,56 | ||||
| 2026-02-13 | 13F | MAI Capital Management | 1.583 | 0,00 | 101 | 4,12 | ||||
| 2026-01-07 | 13F | Central Pacific Bank - Trust Division | 17 | 1 | ||||||
| 2026-02-12 | 13F | Federation des caisses Desjardins du Quebec | 8.149 | -2,43 | 520 | 0,97 | ||||
| 2025-11-12 | 13F | Transce3nd, LLC | 0 | -100,00 | 0 | |||||
| 2026-02-02 | 13F | Your Advocates Ltd., LLP | 20 | 25,00 | 1 | |||||
| 2026-02-09 | 13F | Harbour Investments, Inc. | 17.408 | -0,07 | 1.111 | 3,45 | ||||
| 2026-02-09 | 13F | Keating Financial Advisory Services, Inc. | 4.476 | 286 | ||||||
| 2026-02-13 | 13F | National Bank Of Canada /fi/ | 2.618 | 0,00 | 167 | 3,73 | ||||
| 2026-01-27 | 13F | Elevate Wealth Advisory, Inc | 0 | -100,00 | 0 | |||||
| 2026-02-18 | 13F | GWM Advisors LLC | 4.814 | -3,45 | 307 | 0,00 | ||||
| 2026-02-17 | 13F | Cetera Investment Advisers | 136.381 | 1,37 | 8.706 | 4,92 | ||||
| 2026-02-12 | 13F | Groupe la Francaise | 0 | -100,00 | 0 | |||||
| 2026-01-26 | 13F | Milestones Private Investment Advisors LLC | 5.768 | -0,47 | 368 | 3,08 | ||||
| 2026-02-11 | 13F | Janney Montgomery Scott LLC | 17.409 | 0,00 | 1 | 0,00 | ||||
| 2026-01-12 | 13F | Salem Investment Counselors Inc | 0 | -100,00 | 0 | -100,00 | ||||
| 2026-02-04 | 13F | American Institute for Advanced Investment Management, LLP | 3.875 | 0,00 | 247 | 3,35 | ||||
| 2026-02-05 | 13F | AlphaCore Capital LLC | 2.449 | 3.726,56 | 156 | 5.100,00 | ||||
| 2026-02-17 | 13F | Ameriflex Group, Inc. | 500 | -50,00 | 32 | -49,18 | ||||
| 2026-02-04 | 13F | Summit Wealth Group Llc / Co | 0 | -100,00 | 0 | -100,00 | ||||
| 2026-02-13 | 13F | Mariner, LLC | 9.921 | -2,76 | 633 | 0,64 | ||||
| 2026-01-13 | 13F | CoreCap Advisors, LLC | 385 | -9,41 | 25 | -7,69 | ||||
| 2026-01-30 | 13F | Joel Isaacson & Co., LLC | 8.983 | 0,09 | 573 | 3,62 | ||||
| 2026-02-10 | 13F | Murphy & Mullick Capital Management Corp | 20 | 0,00 | 1 | 0,00 | ||||
| 2026-02-17 | 13F | Claro Advisors LLC | 4.745 | 0,42 | 303 | 3,78 | ||||
| 2026-02-17 | 13F | Royal Bank Of Canada | 21.279 | -63,09 | 1.359 | -61,77 | ||||
| 2026-02-13 | 13F | Parkside Financial Bank & Trust | 196 | 0,00 | 13 | 0,00 | ||||
| 2026-02-17 | 13F | Guardian Wealth Advisors, Llc / Nc | 26.271 | 0,00 | 1.677 | 3,52 | ||||
| 2026-01-27 | 13F | TD Waterhouse Canada Inc. | 2.355 | 563,38 | 150 | 581,82 | ||||
| 2026-02-17 | 13F | Equitable Holdings, Inc. | 7.033 | 3,34 | 449 | 6,92 | ||||
| 2026-01-26 | 13F | Cwm, Llc | 6.015 | 35,96 | 0 | |||||
| 2026-02-09 | 13F | Cypress Capital Management LLC (WY) | 862 | 11,80 | 55 | 17,02 | ||||
| 2026-01-21 | 13F | Flagship Harbor Advisors, Llc | 56 | 4 | ||||||
| 2026-01-23 | 13F | Valley National Advisers Inc | 7.686 | 5,43 | 0 | |||||
| 2026-02-13 | 13F | Vontobel Holding Ltd. | 13.760 | 0,00 | 878 | 3,54 | ||||
| 2026-02-17 | 13F | SageView Advisory Group, LLC | 4.947 | -61,97 | 316 | -60,72 | ||||
| 2026-02-25 | 13F | Tempo Wealth, LLC | 5.460 | 349 | ||||||
| 2026-01-29 | 13F | Concurrent Investment Advisors, LLC | 3.714 | 0,00 | 237 | 3,49 | ||||
| 2026-02-12 | 13F | Principal Securities, Inc. | 0 | -100,00 | 0 | |||||
| 2026-01-14 | 13F | Jfs Wealth Advisors, Llc | 250 | 0,00 | 16 | 0,00 | ||||
| 2026-01-23 | 13F | U.S. Capital Wealth Advisors, LLC | 12.086 | -22,94 | 772 | -20,27 | ||||
| 2026-03-04 | 13F | SHP Wealth Management | 2 | 0 | ||||||
| 2026-01-23 | 13F | Assetmark, Inc | 183 | 181,54 | 12 | 175,00 | ||||
| 2026-02-17 | 13F/A | Kovack Advisors, Inc. | 3.164 | 202 | ||||||
| 2026-02-17 | 13F | Snowden Capital Advisors LLC | 7.656 | -0,26 | 489 | 3,17 | ||||
| 2026-02-09 | 13F | Prospera Financial Services Inc | 6.606 | -2,18 | 422 | 1,20 | ||||
| 2026-01-27 | 13F | Northstar Asset Management Llc | 39.525 | 0,00 | 2.523 | 3,53 | ||||
| 2026-02-12 | 13F | Bank Of Montreal /can/ | 1.294 | 200,93 | 83 | 215,38 | ||||
| 2025-11-12 | 13F | Creekmur Asset Management LLC | 99 | 1,02 | 6 | 20,00 | ||||
| 2026-02-05 | 13F | Allworth Financial LP | 204 | 0,00 | 13 | 8,33 | ||||
| 2026-02-06 | 13F | Creative Financial Designs Inc /adv | 524 | 0,00 | 33 | 3,13 | ||||
| 2026-01-12 | 13F | AllSquare Wealth Management LLC | 6.075 | 0,00 | 375 | 16,88 | ||||
| 2026-02-06 | 13F | Pathway Financial Advisers, LLC | 0 | -100,00 | 0 | |||||
| 2026-02-11 | 13F | J.w. Cole Advisors, Inc. | 4.305 | 0,05 | 275 | 3,40 | ||||
| 2026-01-30 | 13F | Citizens Financial Group Inc/ri | 3.596 | 0,00 | 230 | 3,62 | ||||
| 2026-02-02 | 13F | Retirement Planning Group, Llc / Ny | 4.027 | 0,02 | 257 | 3,63 | ||||
| 2026-02-13 | 13F | Morgan Stanley | 10.801 | 2,73 | 690 | 6,33 | ||||
| 2026-02-02 | 13F | AlphaStar Capital Management, LLC | 3.727 | 0,00 | 238 | 3,49 | ||||
| 2026-01-22 | 13F | Harwood Advisory Group, LLC | 150 | 10 | ||||||
| 2026-02-13 | 13F | Citigroup Inc | 29.967 | 16,11 | 1.913 | 20,18 | ||||
| 2026-02-14 | 13F | Howe & Rusling Inc | 600 | 0,00 | 38 | 2,70 | ||||
| 2025-10-23 | 13F | Strategic Blueprint, LLC | 0 | -100,00 | 0 | |||||
| 2026-02-06 | 13F | HighTower Advisors, LLC | 44.855 | -5,11 | 2.863 | -1,82 | ||||
| 2026-02-17 | 13F | Citadel Advisors Llc | 8.147 | -63,57 | 520 | -62,29 | ||||
| 2026-01-20 | 13F | AdvisorNet Financial, Inc | 279 | 0,00 | 18 | 0,00 | ||||
| 2026-01-16 | 13F | Beaumont Financial Advisors, LLC | 5.166 | 0,04 | 330 | 3,46 | ||||
| 2026-02-10 | 13F | KERR FINANCIAL PLANNING Corp | 1.203 | 99,83 | 78 | 102,63 | ||||
| 2026-01-05 | 13F | GAMMA Investing LLC | 9.105 | -4,06 | 581 | -0,68 | ||||
| 2026-01-29 | 13F | Nbc Securities, Inc. | 509 | 0,20 | 33 | 3,23 | ||||
| 2026-02-17 | 13F | Advisor Group Holdings, Inc. | 32.391 | -4,17 | 2.068 | 1,62 | ||||
| 2026-02-10 | 13F | Thoroughbred Financial Services, Llc | 3.361 | 0,00 | 0 | |||||
| 2026-01-20 | 13F | Stratos Wealth Partners, LTD. | 5.080 | -1,17 | 324 | 2,21 | ||||
| 2026-01-29 | 13F | UBS Group AG | 90.128 | -10,91 | 5.753 | -7,80 | ||||
| 2026-02-02 | 13F | Aurora Private Wealth, Inc. | 4.768 | 0 | ||||||
| 2026-02-12 | 13F | Front Row Advisors LLC | 400 | 0,00 | 26 | 4,17 | ||||
| 2026-02-13 | 13F | Resources Investment Advisors, LLC. | 34.907 | -2,69 | 2.228 | 0,72 | ||||
| 2026-02-17 | 13F | IHT Wealth Management, LLC | 5.907 | -9,47 | 377 | -6,22 | ||||
| 2026-02-12 | 13F | Jane Street Group, Llc | 0 | -100,00 | 0 | |||||
| 2026-01-28 | 13F | Fischer Investment Strategies, Llc | 16.222 | -33,99 | 1.036 | -31,68 | ||||
| 2026-02-11 | 13F | LPL Financial LLC | 276.567 | -0,39 | 17.655 | 3,09 | ||||
| 2026-01-22 | 13F | Apollon Wealth Management, LLC | 9.315 | -2,29 | 595 | 1,19 | ||||
| 2026-02-12 | 13F | BlackRock, Inc. | 255 | 0,00 | 16 | 6,67 | ||||
| 2026-02-17 | 13F | Bank Of America Corp /de/ | 23.063 | -1,25 | 1.472 | 2,22 | ||||
| 2026-01-29 | 13F | Kestra Private Wealth Services, Llc | 3.861 | -1,98 | 246 | 1,65 | ||||
| 2026-02-13 | 13F | Golden State Wealth Management, LLC | 163 | 0,00 | 10 | 0,00 | ||||
| 2026-01-22 | 13F | HHM Wealth Advisors, LLC | 740 | 0,00 | 47 | 4,44 | ||||
| 2026-02-03 | 13F | McIlrath & Eck, LLC | 125 | 0,00 | 8 | 0,00 | ||||
| 2026-01-21 | 13F | HT Partners LLC | 10.345 | 0,00 | 660 | 3,45 | ||||
| 2026-02-05 | 13F | Intrua Financial, LLC | 9.710 | -2,02 | 620 | 1,31 | ||||
| 2026-02-04 | 13F | Atlantic Union Bankshares Corp | 229 | 0,00 | 15 | 0,00 | ||||
| 2026-02-12 | 13F | Brown Brothers Harriman & Co | 400 | 0,00 | 26 | 4,17 | ||||
| 2026-01-14 | 13F | Spire Wealth Management | 3.139 | -7,32 | 200 | -3,85 | ||||
| 2026-02-12 | 13F | IFC & Insurance Marketing, Inc. | 319 | 0 | ||||||
| 2025-11-05 | 13F | Envestnet Asset Management Inc | 0 | -100,00 | 0 | |||||
| 2025-11-12 | 13F | Huntington National Bank | 22 | 61,54 | ||||||
| 2026-02-11 | 13F | O'shaughnessy Asset Management, Llc | 796 | 0,00 | 51 | 2,04 | ||||
| 2026-02-13 | 13F | SRS Capital Advisors, Inc. | 890 | 57 | ||||||
| 2026-02-17 | 13F | Advisory Services Network, LLC | 0 | -100,00 | 0 | |||||
| 2026-02-17 | 13F | Clark Capital Management Group, Inc. | 4.289 | 274 | ||||||
| 2026-02-17 | 13F | Private Advisor Group, LLC | 8.148 | 0,00 | 520 | 3,59 | ||||
| 2026-01-21 | 13F | Crews Bank & Trust | 1.250 | 0,00 | 80 | 2,60 | ||||
| 2026-02-12 | 13F | Advocate Investing Services LLC | 75 | 5 | ||||||
| 2026-02-04 | 13F | Strategic Family Wealth Counselors, L.L.C. | 11.426 | 0,10 | 739 | 4,83 | ||||
| 2026-02-17 | 13F | Raymond James Financial Inc | 91.045 | 2,85 | 5.812 | 6,43 | ||||
| 2026-02-05 | 13F | Cambridge Investment Research Advisors, Inc. | 13.770 | 3,55 | 1 | |||||
| 2026-02-10 | 13F/A | Northwestern Mutual Wealth Management Co | 3.295 | 9,43 | 210 | 13,51 | ||||
| 2026-02-13 | 13F | Gould Asset Management Llc /ca/ | 3.800 | 0,00 | 243 | 3,42 | ||||
| 2025-10-28 | 13F | BRYN MAWR TRUST Co | 172 | -17,31 | 11 | 0,00 | ||||
| 2026-02-17 | 13F | Creative Planning | 15.795 | -2,47 | 1.008 | 1,00 | ||||
| 2026-02-11 | 13F | Tradition Wealth Management, LLC | 5.221 | 0,08 | 333 | 3,74 | ||||
| 2026-03-16 | 13F | Osbon Capital Management Llc | 1.149 | 73 | ||||||
| 2026-02-13 | 13F | Mml Investors Services, Llc | 5.103 | -0,99 | 326 | 2,52 | ||||
| 2026-01-29 | 13F | Concord Wealth Partners | 428 | 0,00 | 27 | 3,85 | ||||
| 2026-02-06 | 13F | Global Retirement Partners, LLC | 636 | 0,00 | 41 | 2,56 | ||||
| 2026-01-29 | 13F | Sanctuary Advisors, LLC | 3.322 | -3,79 | 212 | 0,00 | ||||
| 2026-02-17 | 13F | Valley Financial Group, Inc. | 0 | -100,00 | 0 | |||||
| 2026-02-13 | 13F | Baird Financial Group, Inc. | 33.124 | 1,88 | 2.114 | 5,44 | ||||
| 2026-02-11 | 13F | Buckingham Strategic Partners | 0 | -100,00 | 0 | |||||
| 2026-02-26 | 13F | Anchor Investment Management, LLC | 575 | 0,00 | 37 | 2,86 | ||||
| 2026-02-13 | 13F | Searle & Co. | 0 | -100,00 | 0 | |||||
| 2026-02-11 | 13F | Jpmorgan Chase & Co | 1.944 | 0,00 | 124 | 4,20 | ||||
| 2026-03-13 | 13F/A | Pensionmark Financial Group, Llc | 4.471 | 285 | ||||||
| 2026-01-08 | 13F | Wealth Enhancement Advisory Services, Llc | 4.927 | -1,68 | 326 | 3,17 | ||||
| 2026-02-12 | 13F | Scotia Capital Inc. | 7.361 | -2,86 | 470 | 0,43 | ||||
| 2026-01-20 | 13F | Coastal Investment Advisors, Inc. | 125 | 8 | ||||||
| 2026-02-13 | 13F | Kestra Advisory Services, LLC | 0 | -100,00 | 0 | |||||
| 2026-02-09 | 13F | Smithfield Trust Co | 1.830 | 0,00 | 0 | |||||
| 2026-01-26 | 13F | Moran Wealth Management, LLC | 23.462 | 12,91 | 1.498 | 16,86 | ||||
| 2026-02-17 | 13F | TCG Advisory Services, LLC | 3.983 | -37,42 | 254 | -35,20 | ||||
| 2026-02-20 | 13F | Sunbelt Securities, Inc. | 162 | 0,00 | 10 | 11,11 | ||||
| 2026-02-17 | 13F | Russell Investments Group, Ltd. | 100 | 0,00 | 6 | 0,00 | ||||
| 2026-01-30 | 13F | Wealthfront Advisers Llc | 5.309 | -29,99 | 339 | -27,62 | ||||
| 2025-10-20 | 13F | DHJJ Financial Advisors, Ltd. | 0 | -100,00 | 0 | |||||
| 2026-02-12 | 13F | Commonwealth Equity Services, Llc | 89.750 | -3,32 | 5.729 | 114.480,00 | ||||
| 2026-02-03 | 13F | Oak Family Advisors, Llc | 12.707 | -1,94 | 811 | 1,50 | ||||
| 2026-02-02 | 13F | Fifth Third Bancorp | 929 | -15,16 | 59 | -11,94 | ||||
| 2026-02-06 | 13F | Csenge Advisory Group | 4.094 | -0,78 | 261 | 2,76 | ||||
| 2026-02-17 | 13F | Scarborough Advisors, LLC | 0 | -100,00 | 0 | |||||
| 2026-01-26 | 13F | AE Wealth Management LLC | 3.443 | -7,97 | 220 | -4,78 | ||||
| 2026-02-10 | 13F | Goldman Sachs Group Inc | 0 | -100,00 | 0 | |||||
| 2026-01-28 | 13F | Kingswood Wealth Advisors, Llc | 7.381 | 121,19 | 471 | 129,76 | ||||
| 2026-01-30 | 13F | Bogart Wealth, LLC | 45 | 0,00 | 3 | 0,00 | ||||
| 2026-01-15 | 13F | Acima Private Wealth, Llc | 3.473 | 0,00 | 222 | 3,27 | ||||
| 2026-02-05 | 13F | Crosspoint Financial, Llc | 21.896 | 0,00 | 1.398 | 3,48 | ||||
| 2026-02-12 | 13F | Steward Partners Investment Advisory, Llc | 2.343 | 0,09 | 150 | 3,47 | ||||
| 2026-01-16 | 13F | Crewe Advisors LLC | 400 | 0,00 | 26 | 4,17 | ||||
| 2026-02-02 | 13F | Oppenheimer & Co Inc | 12.500 | -3,40 | 798 | -0,13 | ||||
| 2026-03-02 | 13F | Reflection Asset Management | 886 | 58 | ||||||
| 2026-01-06 | 13F | Eagle Wealth Strategies Llc | 4.350 | 0,16 | 278 | 3,75 | ||||
| 2026-01-16 | 13F | Kwmg, Llc | 100.312 | -3,23 | 6.404 | 0,16 | ||||
| 2026-01-30 | 13F | Us Bancorp \de\ | 120 | -17,81 | 8 | -22,22 | ||||
| 2026-02-06 | 13F | Larson Financial Group LLC | 8.360 | 0,82 | 534 | 4,31 | ||||
| 2026-02-13 | 13F | Wells Fargo & Company/mn | 700 | -19,45 | 45 | -16,98 | ||||
| 2026-02-14 | 13F | Rockefeller Capital Management L.P. | 48.782 | 0,16 | 3.114 | 3,66 | ||||
| 2026-01-21 | 13F | Palumbo Wealth Management LLC | 4.000 | -92,45 | 255 | 3,66 | ||||
| 2026-01-16 | 13F | West Branch Capital LLC | 0 | -100,00 | 0 | |||||
| 2026-01-08 | 13F | Armstrong Advisory Group, Inc | 3.886 | 0,05 | 248 | 3,77 | ||||
| 2025-10-24 | 13F | World Equity Group, Inc. | 0 | -100,00 | 0 | |||||
| 2026-01-30 | 13F | Laurel Wealth Advisors LLC | 308 | 20 | ||||||
| 2026-02-13 | 13F | Aptus Capital Advisors, LLC | 26.377 | 0,00 | 1.684 | 3,51 | ||||
| 2026-02-13 | 13F | Financial Freedom, LLC | 36.788 | 19,33 | 2.348 | 23,51 | ||||
| 2026-02-12 | 13F | Symphony Financial Services, Inc. | 4.767 | -1,10 | 304 | 2,36 | ||||
| 2026-02-17 | 13F | Susquehanna International Group, Llp | 0 | -100,00 | 0 | |||||
| 2025-11-10 | 13F | EverSource Wealth Advisors, LLC | 0 | -100,00 | 0 | -100,00 | ||||
| 2026-02-12 | 13F | StoneX Group Inc. | 5.812 | -4,77 | 371 | -1,33 |
Other Listings
| US:SIXG | 67,12 $ |