Grundlæggende statistik
| Institutionelle ejere | 113 total, 113 long only, 0 short only, 0 long/short - change of 5,61% MRQ |
| Gennemsnitlig porteføljeallokering | 0.0415 % - change of -21,44% MRQ |
| Institutionelle aktier (lange) | 13.387.362 (ex 13D/G) - change of 0,51MM shares 3,92% MRQ |
| Institutionel værdi (lang) | $ 350.155 USD ($1000) |
Institutionelt ejerskab og aktionærer
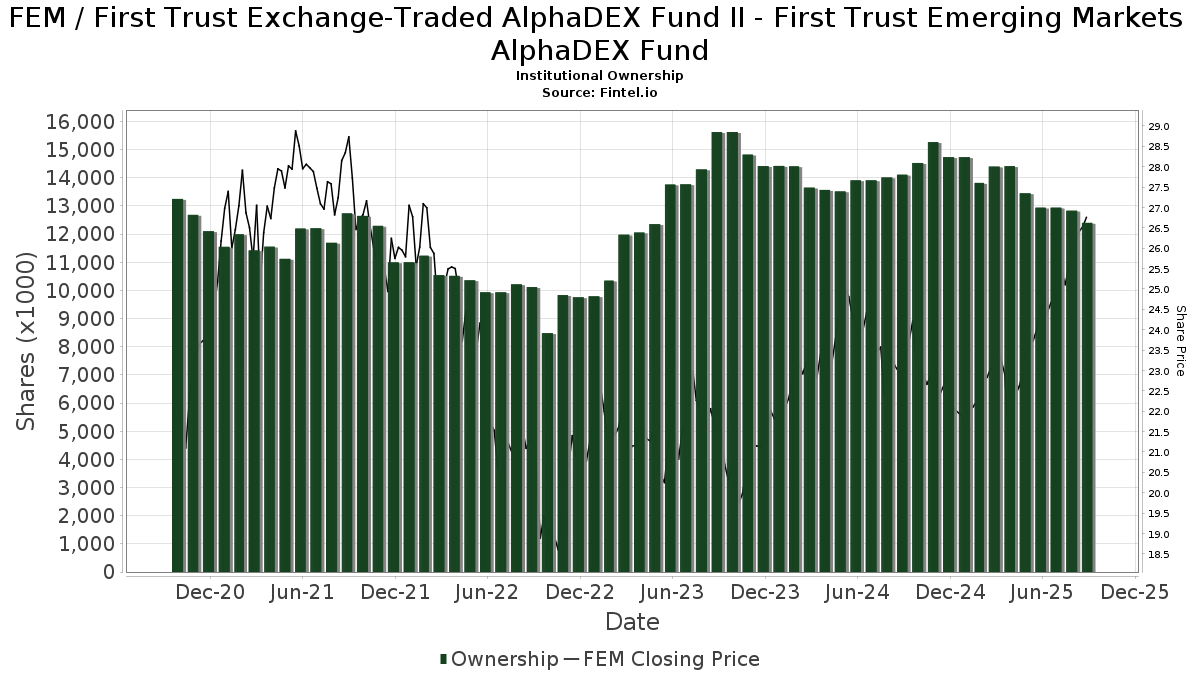
First Trust Exchange-Traded AlphaDEX Fund II - First Trust Emerging Markets AlphaDEX Fund (US:FEM) har 113 institutionelle ejere og aktionærer, der har indsendt 13D/G- eller 13F-formularer til Securities Exchange Commission (SEC). Disse institutioner har i alt 13,387,362 aktier. Største aktionærer omfatter Morgan Stanley, LPL Financial LLC, Wells Fargo & Company/mn, Bank Of America Corp /de/, Royal Bank Of Canada, Empirical Financial Services, LLC d.b.a. Empirical Wealth Management, UBS Group AG, Envestnet Asset Management Inc, Raymond James Financial Inc, and Cambridge Investment Research Advisors, Inc. .
First Trust Exchange-Traded AlphaDEX Fund II - First Trust Emerging Markets AlphaDEX Fund (NasdaqGM:FEM) institutionel ejerskabsstruktur viser aktuelle positioner i virksomheden efter institutioner og fonde, samt seneste ændringer i positionsstørrelse. Større aktionærer kan omfatte individuelle investorer, investeringsforeninger, hedgefonde eller institutioner. Skema 13D angiver, at investoren besidder (eller besidder) mere end 5 % af virksomheden og har til hensigt (eller har til hensigt at) aktivt at forfølge en ændring i forretningsstrategi. Skema 13G indikerer en passiv investering på over 5%.
The share price as of March 23, 2026 is 29,43 / share. Previously, on March 24, 2025, the share price was 23,11 / share. This represents an increase of 27,35% over that period.
Fondens stemningsscore
Fund Sentiment Score (fka Ownership Accumulation Score) finder de aktier, der bliver mest købt af fonde. Det er resultatet af en sofistikeret, multi-faktor kvantitativ model, der identificerer virksomheder med de højeste niveauer af institutionel akkumulering. Scoringsmodellen bruger en kombination af den samlede stigning i oplyste ejere, ændringerne i porteføljeallokeringer i disse ejere og andre målinger. Tallet går fra 0 til 100, hvor højere tal indikerer et højere niveau af akkumulering for sine jævnaldrende, og 50 er gennemsnittet.
Opdateringsfrekvens: Dagligt
Se Ownership Explorer, som giver en liste over højest rangerende virksomheder.
AI+ Ask Fintel’s AI assistant about First Trust Exchange-Traded AlphaDEX Fund II - First Trust Emerging Markets AlphaDEX Fund.
Select a question to share a public post with an AI-crafted answer.
Thinking of good questions…
Institutionel Put/Call-forhold
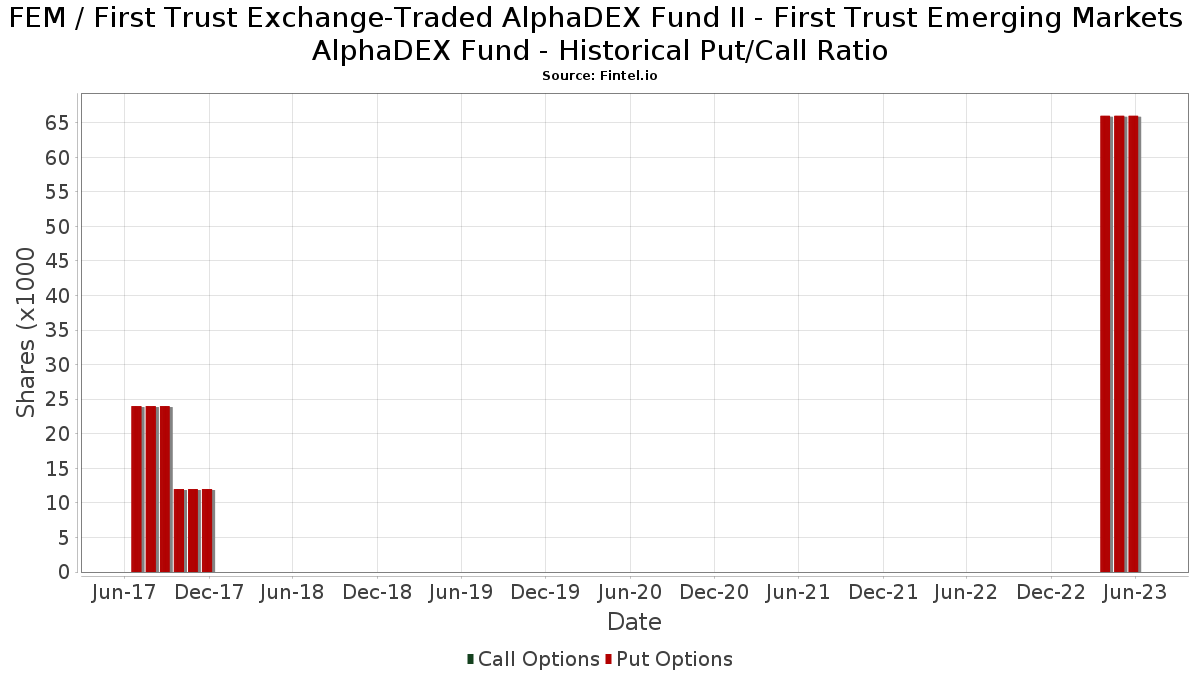
Ud over at indberette standardaktie- og gældsudstedelser skal institutter med mere end 100 mill. aktiver under forvaltning også oplyse deres put- og call-optionsbeholdninger. Da salgsoptioner generelt indikerer negativ stemning, og købsoptioner indikerer positiv stemning, kan vi få en fornemmelse af den overordnede institutionelle stemning ved at plotte forholdet mellem put og kald. Diagrammet til højre viser det historiske put/call-forhold for dette instrument.
Brug af Put/Call Ratio som en indikator for investorernes stemning overvinder en af de vigtigste mangler ved at bruge totalt institutionelt ejerskab, som er, at en betydelig mængde af aktiver under forvaltning investeres passivt for at spore indekser. Passivt forvaltede fonde køber typisk ikke optioner, så indikatoren for put/call-forholdet følger mere nøje følelsen af aktivt forvaltede fonde.
13F og NPORT arkivering
Detaljer om 13F-arkivering er gratis. Detaljer om NP-ansøgninger kræver et premium-medlemskab. Grønne rækker angiver nye positioner. Røde rækker angiver lukkede positioner. Klik på linket ikon for at se den fulde transaktionshistorik.
Opgrader
for at låse premium-data op og eksportere til Excel ![]() .
.
| Fil dato | Kilde | Investor | Type | Gennemsnitlig pris (Øst) |
Aktier | Δ Aktier (%) |
Rapporteret Værdi ($1000) |
Δ Værdi (%) |
Port Alloc (%) |
|
|---|---|---|---|---|---|---|---|---|---|---|
| 2026-02-17 | 13F | Raymond James Financial Inc | 444.195 | 25,71 | 12.149 | 26,87 | ||||
| 2026-02-06 | 13F | Cullen/frost Bankers, Inc. | 662 | 65,09 | 18 | 80,00 | ||||
| 2026-01-29 | 13F | Sanctuary Advisors, LLC | 413.733 | -20,00 | 11.316 | -19,27 | ||||
| 2025-10-30 | 13F | Twin Peaks Wealth Advisors, LLC | 0 | -100,00 | 0 | |||||
| 2026-02-17 | 13F | Snowden Capital Advisors LLC | 38.552 | -2,03 | 1.054 | -1,13 | ||||
| 2026-02-17 | 13F | State Of Wisconsin Investment Board | 313.808 | 0,00 | 8.583 | 0,92 | ||||
| 2026-02-13 | 13F | Wells Fargo & Company/mn | 1.179.292 | -0,67 | 32.254 | 0,24 | ||||
| 2026-02-10 | 13F | Goldman Sachs Group Inc | 22.470 | 615 | ||||||
| 2026-02-12 | 13F | Rossby Financial, LCC | 2.284 | 1,51 | 62 | 3,33 | ||||
| 2026-01-20 | 13F | Savvy Advisors, Inc. | 7.562 | -5,02 | 207 | -4,19 | ||||
| 2026-02-09 | 13F | Prospera Financial Services Inc | 74.874 | 4,48 | 2.048 | 5,41 | ||||
| 2026-02-17 | 13F | Quantinno Capital Management LP | 26.122 | 68,24 | 714 | 70,00 | ||||
| 2026-01-29 | 13F | Comerica Bank | 15.094 | -46,04 | 413 | -45,65 | ||||
| 2026-02-10 | 13F | Meitav Dash Investments Ltd | 8.893 | 0,00 | 243 | 0,83 | ||||
| 2026-02-13 | 13F | Smartleaf Asset Management LLC | 939 | 371,86 | 26 | 400,00 | ||||
| 2026-02-17 | 13F | Old Mission Capital Llc | 0 | -100,00 | 0 | |||||
| 2026-01-26 | 13F | Iams Wealth Management, Llc | 24.707 | -8,64 | 676 | -7,79 | ||||
| 2026-01-16 | 13F | Formidable Asset Management, LLC | 19.363 | 2,19 | 525 | 12,69 | ||||
| 2026-01-28 | 13F | Geneos Wealth Management Inc. | 1.930 | 0,00 | 53 | 0,00 | ||||
| 2026-02-10 | 13F | Tidemark, LLC | 694 | -38,64 | 19 | -40,00 | ||||
| 2026-01-26 | 13F | Private Trust Co Na | 379 | 10 | ||||||
| 2026-02-17 | 13F | Wealth Watch Advisors, INC | 347 | 115,53 | 9 | 125,00 | ||||
| 2026-02-13 | 13F | Mml Investors Services, Llc | 25.840 | 3,26 | 707 | 4,13 | ||||
| 2026-01-21 | 13F | Sound Income Strategies, LLC | 1.563 | 45 | ||||||
| 2026-01-28 | 13F | Chicago Partners Investment Group LLC | 39.068 | 0,91 | 1.161 | 11,21 | ||||
| 2026-02-17 | 13F | Signature Equity Partners, LLC | 545 | 15 | ||||||
| 2026-01-14 | 13F | Spire Wealth Management | 1.738 | -0,06 | 48 | 0,00 | ||||
| 2026-02-11 | 13F | Hilton Head Capital Partners, LLC | 3 | 0 | ||||||
| 2025-11-12 | 13F | Traction Financial Partners, LLC | 0 | -100,00 | 0 | |||||
| 2026-02-12 | 13F | Commonwealth Equity Services, Llc | 41.137 | -19,71 | 1.125 | 112.400,00 | ||||
| 2026-01-26 | 13F | Cwm, Llc | 31.792 | -8,92 | 1 | |||||
| 2026-02-12 | 13F | StoneX Group Inc. | 7.847 | 215 | ||||||
| 2026-02-06 | 13F | Larson Financial Group LLC | 125 | 0,00 | 3 | 0,00 | ||||
| 2026-01-29 | 13F | D.a. Davidson & Co. | 32.937 | 3,37 | 901 | 4,29 | ||||
| 2025-11-14 | 13F | Jane Street Group, Llc | 0 | -100,00 | 0 | |||||
| 2026-02-18 | 13F | GWM Advisors LLC | 417 | 0,72 | 11 | 0,00 | ||||
| 2026-02-13 | 13F | Evelyn Partners Investment Management LLP | 1.800 | -37,39 | 49 | -36,36 | ||||
| 2026-02-02 | 13F | Benjamin Edwards Inc | 85.543 | 21,35 | 2.340 | 22,51 | ||||
| 2026-02-20 | 13F | Sunbelt Securities, Inc. | 267 | 0,75 | 7 | 0,00 | ||||
| 2026-01-26 | 13F | AE Wealth Management LLC | 56.443 | -5,74 | 1.544 | -4,87 | ||||
| 2026-01-22 | 13F | City Holding Co | 1.450 | 0,00 | 40 | 0,00 | ||||
| 2026-02-13 | 13F | First Trust Advisors Lp | 28.280 | -1,19 | 773 | -0,26 | ||||
| 2026-02-06 | 13F | Envestnet Portfolio Solutions, Inc. | 10.675 | 3,86 | 292 | 4,68 | ||||
| 2026-02-06 | 13F | Global Retirement Partners, LLC | 1.412 | -81,06 | 39 | -81,19 | ||||
| 2026-02-17 | 13F | Susquehanna International Group, Llp | 23.748 | -12,91 | 650 | -12,06 | ||||
| 2026-01-20 | 13F | American National Bank | 136 | 0,00 | 4 | 0,00 | ||||
| 2026-02-17 | 13F | Risk Paradigm Group, LLC | 0 | -100,00 | 0 | |||||
| 2026-02-17 | 13F | Fmr Llc | 631 | 18,16 | 17 | 21,43 | ||||
| 2026-01-16 | 13F | Empirical Financial Services, LLC d.b.a. Empirical Wealth Management | 605.433 | 0,62 | 16.559 | 1,55 | ||||
| 2026-02-09 | 13F | Kingsview Wealth Management, LLC | 99.366 | -20,79 | 2.718 | -20,06 | ||||
| 2025-10-10 | 13F | Cyndeo Wealth Partners, LLC | 0 | -100,00 | 0 | |||||
| 2026-01-20 | 13F | Trust Co Of Toledo Na /oh/ | 683 | 0,00 | 19 | 0,00 | ||||
| 2026-02-12 | 13F | Principal Securities, Inc. | 68.504 | -1,15 | 1.874 | -0,27 | ||||
| 2026-02-11 | 13F | Janney Montgomery Scott LLC | 63.470 | 6,66 | 2 | 0,00 | ||||
| 2026-02-17 | 13F | Jones Financial Companies Lllp | 26.558 | 55,35 | 726 | 58,86 | ||||
| 2026-02-17 | 13F | Mpwm Advisory Solutions, Llc | 0 | -100,00 | 0 | |||||
| 2026-02-19 | 13F | Van Diest Capital, LLC | 8.284 | 227 | ||||||
| 2026-02-09 | 13F | MTM Investment Management, LLC | 540 | 0,00 | 15 | 0,00 | ||||
| 2026-02-09 | 13F | Harbour Investments, Inc. | 13.565 | 7,98 | 371 | 8,82 | ||||
| 2025-10-07 | 13F | Thurston, Springer, Miller, Herd & Titak, Inc. | 0 | -100,00 | 0 | |||||
| 2026-02-24 | 13F | MidFirst Bank | 2.310 | 63 | ||||||
| 2026-02-14 | 13F | Rockefeller Capital Management L.P. | 10.318 | 4,45 | 282 | 5,62 | ||||
| 2026-02-13 | 13F | Element Wealth, LLC | 8.871 | 0,00 | 243 | 0,83 | ||||
| 2026-02-17 | 13F | Private Advisor Group, LLC | 277.185 | 54,45 | 7.581 | 55,89 | ||||
| 2026-02-13 | 13F | Stifel Financial Corp | 43.858 | 0,16 | 1.200 | 1,10 | ||||
| 2026-01-23 | 13F | Farther Finance Advisors, LLC | 35.044 | 0,65 | 958 | 1,59 | ||||
| 2026-02-17 | 13F | Cetera Investment Advisers | 292.020 | 2,08 | 7.987 | 3,02 | ||||
| 2026-01-20 | 13F | Midwest Financial Group LLC | 68.428 | -25,16 | 1.871 | -24,47 | ||||
| 2026-02-13 | 13F | Arkadios Wealth Advisors | 7.614 | 208 | ||||||
| 2026-02-10 | 13F | Bank of New York Mellon Corp | 218.999 | -18,77 | 5.990 | -18,03 | ||||
| 2026-02-03 | 13F | RFG Advisory, LLC | 11.418 | -1,93 | 312 | -0,95 | ||||
| 2025-10-02 | 13F | Caldwell Trust Co | 0 | -100,00 | 0 | |||||
| 2026-02-05 | 13F | Atria Investments Llc | 99.648 | -8,18 | 2.725 | -7,34 | ||||
| 2026-02-12 | 13F | Steward Partners Investment Advisory, Llc | 41.950 | 0,02 | 1.147 | 0,97 | ||||
| 2026-02-17 | 13F | Advisory Services Network, LLC | 0 | -100,00 | 0 | |||||
| 2025-11-14 | 13F | Capital Analysts, Inc. | 0 | -100,00 | 0 | |||||
| 2026-02-12 | 13F | Richmond Investment Services, LLC | 21.584 | 0,13 | 590 | 1,03 | ||||
| 2026-02-17 | 13F | Advisor Group Holdings, Inc. | 69.432 | -2,69 | 1.899 | -0,78 | ||||
| 2026-02-17 | 13F | Bank Of America Corp /de/ | 1.047.541 | 1,97 | 28.650 | 2,91 | ||||
| 2026-02-17 | 13F | Equitable Holdings, Inc. | 10.790 | 23,27 | 295 | 24,47 | ||||
| 2026-01-05 | 13F | GAMMA Investing LLC | 2.242 | -22,23 | 61 | -21,79 | ||||
| 2026-02-06 | 13F | Lloyd Advisory Services, LLC. | 56 | 2 | ||||||
| 2026-02-18 | 13F | Pacific Excel Wealth Advisors, Inc. | 14.892 | 407 | ||||||
| 2026-02-06 | 13F | Signature Estate & Investment Advisors Llc | 13.647 | 0,07 | 373 | 1,08 | ||||
| 2026-02-06 | 13F/A | Rathbone Brothers plc | 46.079 | 8,59 | 1.260 | 9,66 | ||||
| 2026-02-05 | 13F | Cambridge Investment Research Advisors, Inc. | 439.321 | -1,45 | 12 | 0,00 | ||||
| 2026-02-11 | 13F | Gateway Wealth Partners, LLC | 52.904 | 8,59 | 1.447 | 9,55 | ||||
| 2026-02-03 | 13F | NewEdge Wealth, LLC | 21.854 | -1,97 | 598 | -0,50 | ||||
| 2026-02-17 | 13F | Pinnacle Family Advisors, LLC | 9.929 | -1,28 | 272 | -0,37 | ||||
| 2026-02-13 | 13F | Pine Valley Investments Ltd Liability Co | 13.763 | 2,05 | 376 | 3,01 | ||||
| 2026-01-12 | 13F | World Equity Group, Inc. | 0 | -100,00 | 0 | |||||
| 2026-02-12 | 13F | Brinker Capital Investments, LLC | 37.832 | 5,64 | 1.035 | 6,60 | ||||
| 2025-11-12 | 13F | Transce3nd, LLC | 0 | -100,00 | 0 | |||||
| 2026-02-11 | 13F | LPL Financial LLC | 1.375.536 | 9,74 | 37.621 | 10,75 | ||||
| 2026-02-13 | 13F | Morgan Stanley | 2.390.271 | 1,68 | 65.374 | 2,62 | ||||
| 2026-01-23 | 13F | Assetmark, Inc | 227.389 | 3,65 | 6.219 | 4,63 | ||||
| 2026-02-06 | 13F | Pnc Financial Services Group, Inc. | 0 | -100,00 | 0 | |||||
| 2026-02-11 | 13F | Jpmorgan Chase & Co | 765 | 462,50 | 21 | 566,67 | ||||
| 2026-02-05 | 13F | Tucker Asset Management Llc | 4.054 | -9,77 | 111 | -9,09 | ||||
| 2026-02-17 | 13F | Royal Bank Of Canada | 985.230 | -1,28 | 26.946 | -0,37 | ||||
| 2026-01-29 | 13F | Higgins & Schmidt Wealth Strategies LLC | 14.375 | 0,00 | 393 | 1,03 | ||||
| 2026-01-29 | 13F | UBS Group AG | 602.469 | -6,07 | 16.478 | -5,21 | ||||
| 2026-02-11 | 13F | OneAscent Financial Services LLC | 38.665 | -3,86 | 1.057 | -2,94 | ||||
| 2026-01-29 | 13F | Aprio Wealth Management, LLC | 31.079 | -0,07 | 850 | 0,95 | ||||
| 2026-01-30 | 13F | Sigma Planning Corp | 0 | -100,00 | 0 | |||||
| 2026-02-17 | 13F | VestGen Advisors, LLC | 43.738 | 1.196 | ||||||
| 2026-01-21 | 13F | Trueblood Wealth Management, LLC | 13.868 | 1,51 | 379 | 2,43 | ||||
| 2026-01-23 | 13F | ABLE Financial Group, LLC | 9.286 | -1,07 | 254 | -0,39 | ||||
| 2026-02-10 | 13F/A | Northwestern Mutual Wealth Management Co | 9.149 | -3,97 | 250 | -3,10 | ||||
| 2026-02-17 | 13F | LaSalle St. Investment Advisors, LLC | 12.626 | -0,43 | 0 | |||||
| 2026-02-13 | 13F | Mariner, LLC | 9.695 | -14,72 | 265 | -13,96 | ||||
| 2026-02-03 | 13F | Fsb Premier Wealth Management, Inc. | 10.204 | -0,07 | 279 | 1,09 | ||||
| 2026-02-06 | 13F | IFP Advisors, Inc | 39.719 | -20,26 | 1.086 | -19,50 | ||||
| 2026-02-03 | 13F | We Are One Seven, LLC | 9.937 | 272 | ||||||
| 2026-01-23 | 13F | HBW Advisory Services LLC | 22.896 | 178,64 | 626 | 181,98 | ||||
| 2026-01-29 | 13F | Nbc Securities, Inc. | 649 | 0,78 | 18 | 0,00 | ||||
| 2026-01-30 | 13F | Us Bancorp \de\ | 400 | 0,00 | 11 | 0,00 | ||||
| 2026-02-13 | 13F | Integrated Wealth Concepts LLC | 22.507 | -10,07 | 616 | -9,29 | ||||
| 2025-11-04 | 13F | Flaharty Asset Management, LLC | 0 | -100,00 | 0 | |||||
| 2026-02-17 | 13F | Ameriflex Group, Inc. | 126 | -50,00 | 3 | -50,00 | ||||
| 2026-01-22 | 13F | Financial Consulate, Inc | 182 | 0,00 | 5 | 0,00 | ||||
| 2026-02-13 | 13F | Kestra Advisory Services, LLC | 0 | -100,00 | 0 | |||||
| 2026-01-16 | 13F | Balboa Wealth Partners | 8.389 | 229 | ||||||
| 2026-02-10 | 13F | Envestnet Asset Management Inc | 570.220 | -1,40 | 15.596 | -0,49 | ||||
| 2026-02-13 | 13F | Citigroup Inc | 567 | -93,67 | 16 | -93,80 | ||||
| 2026-02-05 | 13F | Western Wealth Management, LLC | 7.538 | -6,23 | 206 | -5,07 | ||||
| 2026-01-05 | 13F | Park Avenue Securities Llc | 39.477 | -1,63 | 1 | 0,00 | ||||
| 2026-02-18 | 13F | Crusonia Wealth Advisors LLC | 28.041 | 767 | ||||||
| 2026-02-17 | 13F | Coppell Advisory Solutions LLC | 37.539 | 1,09 | 1.033 | 3,30 | ||||
| 2026-01-27 | 13F | PFG Advisors | 0 | -100,00 | 0 | |||||
| 2026-02-06 | 13F | HighTower Advisors, LLC | 25.547 | -1,61 | 699 | -0,71 | ||||
| 2026-02-04 | 13F | Ameritas Advisory Services, LLC | 0 | -100,00 | 0 | |||||
| 2025-11-12 | 13F | Dunhill Financial, LLC | 0 | -100,00 | 0 |