Grundlæggende statistik
| Institutionelle ejere | 204 total, 204 long only, 0 short only, 0 long/short - change of 9,63% MRQ |
| Gennemsnitlig porteføljeallokering | 0.2612 % - change of -21,73% MRQ |
| Institutionelle aktier (lange) | 25.097.713 (ex 13D/G) - change of 1,15MM shares 4,79% MRQ |
| Institutionel værdi (lang) | $ 1.424.252 USD ($1000) |
Institutionelt ejerskab og aktionærer
iShares, Inc. - iShares Emerging Markets Equity Factor ETF (US:EMGF) har 204 institutionelle ejere og aktionærer, der har indsendt 13D/G- eller 13F-formularer til Securities Exchange Commission (SEC). Disse institutioner har i alt 25,097,713 aktier. Største aktionærer omfatter Vantagepoint Investment Advisers Llc, Jpmorgan Chase & Co, Strategic Financial Services, Inc,, Dynasty Wealth Management, Llc, Sagespring Wealth Partners, Llc, Wells Fargo & Company/mn, Ascent Group, LLC, Morgan Stanley, Fmr Llc, and LPL Financial LLC .
iShares, Inc. - iShares Emerging Markets Equity Factor ETF (BATS:EMGF) institutionel ejerskabsstruktur viser aktuelle positioner i virksomheden efter institutioner og fonde, samt seneste ændringer i positionsstørrelse. Større aktionærer kan omfatte individuelle investorer, investeringsforeninger, hedgefonde eller institutioner. Skema 13D angiver, at investoren besidder (eller besidder) mere end 5 % af virksomheden og har til hensigt (eller har til hensigt at) aktivt at forfølge en ændring i forretningsstrategi. Skema 13G indikerer en passiv investering på over 5%.
The share price as of April 20, 2026 is 67,36 / share. Previously, on April 21, 2025, the share price was 45,00 / share. This represents an increase of 49,68% over that period.

Fondens stemningsscore
Fund Sentiment Score (fka Ownership Accumulation Score) finder de aktier, der bliver mest købt af fonde. Det er resultatet af en sofistikeret, multi-faktor kvantitativ model, der identificerer virksomheder med de højeste niveauer af institutionel akkumulering. Scoringsmodellen bruger en kombination af den samlede stigning i oplyste ejere, ændringerne i porteføljeallokeringer i disse ejere og andre målinger. Tallet går fra 0 til 100, hvor højere tal indikerer et højere niveau af akkumulering for sine jævnaldrende, og 50 er gennemsnittet.
Opdateringsfrekvens: Dagligt
Se Ownership Explorer, som giver en liste over højest rangerende virksomheder.
AI+ Ask Fintel’s AI assistant about iShares, Inc. - iShares Emerging Markets Equity Factor ETF.
Select a question to share a public post with an AI-crafted answer.
Thinking of good questions…
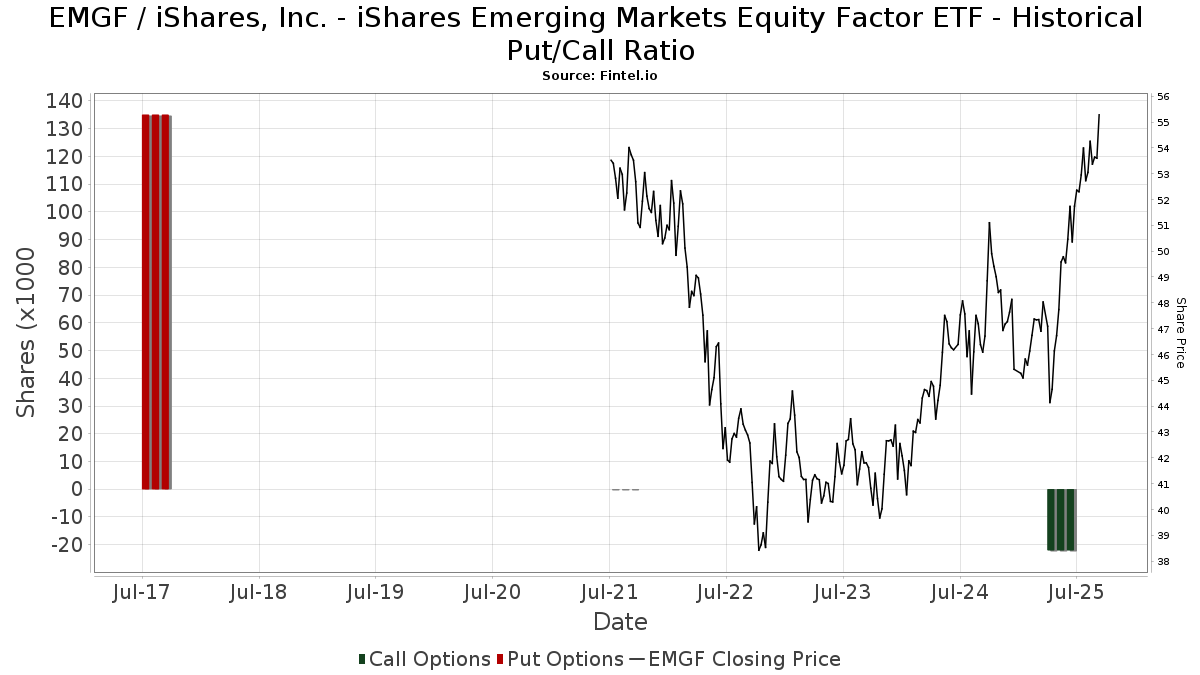
Institutionel Put/Call-forhold
Ud over at indberette standardaktie- og gældsudstedelser skal institutter med mere end 100 mill. aktiver under forvaltning også oplyse deres put- og call-optionsbeholdninger. Da salgsoptioner generelt indikerer negativ stemning, og købsoptioner indikerer positiv stemning, kan vi få en fornemmelse af den overordnede institutionelle stemning ved at plotte forholdet mellem put og kald. Diagrammet til højre viser det historiske put/call-forhold for dette instrument.
Brug af Put/Call Ratio som en indikator for investorernes stemning overvinder en af de vigtigste mangler ved at bruge totalt institutionelt ejerskab, som er, at en betydelig mængde af aktiver under forvaltning investeres passivt for at spore indekser. Passivt forvaltede fonde køber typisk ikke optioner, så indikatoren for put/call-forholdet følger mere nøje følelsen af aktivt forvaltede fonde.
13D/G-arkivering
Vi præsenterer 13D/G ansøgninger separat fra 13F ansøgninger på grund af den forskellige behandling af SEC. 13D/G-ansøgninger kan indgives af grupper af investorer (med én ledende), hvorimod 13F-ansøgninger ikke kan. Dette resulterer i situationer, hvor en investor kan indsende en 13D/G, der rapporterer én værdi for de samlede aktier (der repræsenterer alle de aktier, der ejes af investorgruppen), men derefter indsender en 13F, der rapporterer en anden værdi for de samlede aktier (der udelukkende repræsenterer deres egne) ejendomsret). Det betyder, at aktieejerskab af 13D/G-arkiver og 13F-arkiveringer ofte ikke er direkte sammenlignelige, så vi præsenterer dem separat.
Bemærk: Fra den 16. maj 2021 viser vi ikke længere ejere, der ikke har indsendt en 13D/G inden for det seneste år. Tidligere viste vi den fulde historie af 13D/G-arkiver. Generelt skal enheder, der er forpligtet til at indgive 13D/G-ansøgninger, indgive mindst årligt, før de indsender en afsluttende ansøgning. Dog forlader fonde nogle gange positioner uden at indsende en afsluttende ansøgning (dvs. de afvikler), så visning af den fulde historie resulterede nogle gange i forvirring om det nuværende ejerskab. For at undgå forvirring viser vi nu kun 'aktuelle' ejere - det vil sige - ejere, der har anmeldt inden for det seneste år.
Upgrade to unlock premium data.
| Fil dato | Form | Investor | Forrige Aktier |
Seneste Aktier |
Δ Aktier (Procent) |
Ejendomsret (Procent) |
Δ Ejerskab (Procent) |
|
|---|---|---|---|---|---|---|---|---|
| 2025-10-06 | International City Management Association Retirement Corp | 3,014,701 | 14.00 | |||||
| 2025-08-06 | FMR LLC | 1,443,669 | 868,756 | -39.82 | 4.90 | -43.02 |
13F og NPORT arkivering
Detaljer om 13F-arkivering er gratis. Detaljer om NP-ansøgninger kræver et premium-medlemskab. Grønne rækker angiver nye positioner. Røde rækker angiver lukkede positioner. Klik på linket ikon for at se den fulde transaktionshistorik.
Opgrader
for at låse premium-data op og eksportere til Excel ![]() .
.
| Fil dato | Kilde | Investor | Type | Gennemsnitlig pris (Øst) |
Aktier | Δ Aktier (%) |
Rapporteret Værdi ($1000) |
Δ Værdi (%) |
Port Alloc (%) |
|
|---|---|---|---|---|---|---|---|---|---|---|
| 2026-04-09 | 13F | Firethorn Wealth Partners, Llc | 4.300 | -1,17 | 260 | 3,19 | ||||
| 2026-02-11 | 13F | LPL Financial LLC | 727.846 | 41,90 | 42.106 | 45,08 | ||||
| 2026-04-10 | 13F | YHB Investment Advisors, Inc. | 30.711 | 1.856 | ||||||
| 2026-02-17 | 13F | KM Capital Management Ltd. | 7.915 | 23,17 | 458 | 25,90 | ||||
| 2026-04-13 | 13F | 5T Wealth, LLC | 34.335 | -13,29 | 2.075 | -9,43 | ||||
| 2026-01-29 | 13F | Beirne Wealth Consulting Services, LLC | 40.174 | 0,73 | 2.326 | 3,01 | ||||
| 2026-02-17 | 13F | Raymond James Financial Inc | 582.586 | 26,91 | 33.703 | 29,76 | ||||
| 2026-02-10 | 13F/A | Northwestern Mutual Wealth Management Co | 43.964 | -8,64 | 2.543 | -6,58 | ||||
| 2026-02-12 | 13F | Hrt Financial Lp | 0 | -100,00 | 0 | |||||
| 2026-01-26 | 13F | AE Wealth Management LLC | 1.021 | 6,91 | 59 | 9,26 | ||||
| 2026-01-26 | 13F | Cwm, Llc | 675.529 | -1,67 | 39 | 2,63 | ||||
| 2026-02-06 | 13F | Empirical Asset Management, LLC | 20.111 | 15,63 | 1.163 | 18,19 | ||||
| 2026-02-11 | 13F | O'shaughnessy Asset Management, Llc | 15.412 | 6,95 | 892 | 9,33 | ||||
| 2025-11-24 | 13F | CIBC Private Wealth Group, LLC | 0 | 0 | ||||||
| 2026-01-22 | 13F | TSA Wealth Managment LLC | 19.994 | 21,09 | 1.157 | 23,77 | ||||
| 2025-11-05 | 13F | Fullcircle Wealth Llc | 5.227 | -0,02 | 303 | 10,58 | ||||
| 2026-02-13 | 13F | Flow Traders U.s. Llc | 0 | -100,00 | 0 | |||||
| 2026-04-16 | 13F | Quotient Wealth Partners, LLC | 40.014 | 9,35 | 2.418 | 14,27 | ||||
| 2026-02-18 | 13F | GWM Advisors LLC | 0 | -100,00 | 0 | |||||
| 2026-02-17 | 13F | Aqr Capital Management Llc | 4.070 | -15,45 | 235 | -13,60 | ||||
| 2026-01-28 | 13F | Dentgroup LLC | 7.124 | 4,80 | 412 | 7,29 | ||||
| 2026-04-01 | 13F | Beacon Financial Group | 11.147 | 0,00 | 645 | 2,22 | ||||
| 2026-02-06 | 13F | Larson Financial Group LLC | 368.134 | 7,75 | 21.297 | 10,17 | ||||
| 2026-01-06 | 13F | Unique Wealth, Llc | 75.828 | 1,16 | 4.387 | 3,42 | ||||
| 2026-02-03 | 13F/A | Bank Of America Corp /de/ | Call | 0 | -100,00 | 0 | -100,00 | |||
| 2026-02-06 | 13F | HighTower Advisors, LLC | 48.748 | -0,05 | 2.820 | 2,21 | ||||
| 2025-11-06 | 13F | Abich Financial Wealth Management LLC | 79 | 4 | ||||||
| 2026-02-12 | 13F | Callan Family Office, LLC | 134.792 | 6,25 | 7.798 | 8,64 | ||||
| 2026-04-10 | 13F | Pure Financial Advisors, Inc. | 583.395 | 35.255 | ||||||
| 2026-02-12 | 13F | Principal Securities, Inc. | 4.270 | 3,69 | 247 | 5,58 | ||||
| 2026-02-13 | 13F | LGT Financial Advisors LLC | 0 | -100,00 | 0 | |||||
| 2026-02-12 | 13F | Federation des caisses Desjardins du Quebec | 109.753 | 6,06 | 6.349 | 8,44 | ||||
| 2026-02-04 | 13F | Nwam Llc | 3.716 | 232 | ||||||
| 2026-02-05 | 13F | Williams & Novak, LLC | 10.328 | -0,59 | 597 | 1,70 | ||||
| 2026-02-24 | 13F | Barnes Wealth Management Group, Inc | 5.904 | 1,79 | 342 | 3,96 | ||||
| 2026-04-08 | 13F | Red Reef Advisors Llc | 2.593 | 150 | ||||||
| 2026-02-13 | 13F | Aptus Capital Advisors, LLC | 218 | 13 | ||||||
| 2026-02-10 | 13F | Dynasty Wealth Management, Llc | 1.312.767 | 1,47 | 75.944 | 3,74 | ||||
| 2026-01-29 | 13F | UBS Group AG | 33.232 | -2,32 | 1.922 | -0,10 | ||||
| 2026-02-13 | 13F | Wells Fargo & Company/mn | 1.095.350 | 15,41 | 63.366 | 18,00 | ||||
| 2026-02-12 | 13F | Commonwealth Equity Services, Llc | 111.323 | 18,76 | 6.440 | 128.700,00 | ||||
| 2026-02-11 | 13F | Jpmorgan Chase & Co | 2.956.784 | -12,11 | 171.050 | -10,13 | ||||
| 2026-02-17 | 13F | Citadel Advisors Llc | 16.316 | -25,86 | 944 | -24,26 | ||||
| 2026-01-29 | 13F | Sanctuary Advisors, LLC | 53.973 | 22,78 | 3.122 | 25,53 | ||||
| 2026-02-06 | 13F | Global Retirement Partners, LLC | 15.016 | 120,11 | 869 | 124,87 | ||||
| 2026-02-09 | 13F | Arq Wealth Advisors, Llc | 86.165 | 4,29 | 4.985 | 6,63 | ||||
| 2026-02-10 | 13F | CFS Investment Advisory Services, LLC | 4.597 | 23,38 | 266 | 22,12 | ||||
| 2026-02-17 | 13F | Susquehanna International Group, Llp | 16.840 | 974 | ||||||
| 2026-04-13 | 13F | Mather Group, Llc. | 1.091 | 66 | ||||||
| 2026-02-12 | 13F | Scotia Capital Inc. | 5.148 | 298 | ||||||
| 2026-04-15 | 13F | DecisionMap Wealth Management, LLC | 3.506 | -19,79 | 212 | -16,27 | ||||
| 2026-02-10 | 13F | Meramec Financial Planners, LLC | 92 | 6 | ||||||
| 2026-04-13 | 13F | Ullmann Financial Group, Inc. | 38.700 | -18,01 | 2.339 | -15,66 | ||||
| 2026-04-20 | 13F | Hixon Zuercher, LLC | 147.661 | -9,48 | 8.923 | -5,44 | ||||
| 2026-04-13 | 13F | Amplius Wealth Advisors, LLC | 142.838 | 8.632 | ||||||
| 2026-02-17 | 13F | Blair William & Co/il | 274 | 16 | ||||||
| 2026-02-17 | 13F | Private Advisor Group, LLC | 159.638 | 100,05 | 9.235 | 104,54 | ||||
| 2026-04-08 | 13F | Dynamic Advisor Solutions LLC | 322.184 | 3,32 | 19.470 | 7,92 | ||||
| 2026-02-17 | 13F | Cetera Investment Advisers | 73.304 | 59,28 | 4.241 | 62,89 | ||||
| 2025-11-14 | 13F | Strategic Wealth Partners, Ltd. | 809 | 29,86 | 46 | 40,63 | ||||
| 2026-01-30 | 13F | Strategic Blueprint, LLC | 18.008 | -13,34 | 1.042 | -11,40 | ||||
| 2026-04-09 | 13F | Kelly Financial Group Llc | 3.853 | 7,96 | 233 | 12,62 | ||||
| 2026-04-15 | 13F | Valley National Advisers Inc | 142 | 0,00 | 0 | |||||
| 2026-01-23 | 13F | Armbruster Capital Management, Inc. | 132.702 | -0,16 | 7.677 | 2,07 | ||||
| 2026-02-13 | 13F | McAdam, LLC | 4.686 | -0,47 | 271 | 1,88 | ||||
| 2026-04-07 | 13F | Park Avenue Securities Llc | 62.410 | 20,16 | 4 | 0,00 | ||||
| 2026-02-09 | 13F | Kingsview Wealth Management, LLC | 30.257 | -1,92 | 1.750 | 0,29 | ||||
| 2026-02-06 | 13F | Envestnet Portfolio Solutions, Inc. | 5.071 | -1,95 | 293 | 0,34 | ||||
| 2026-03-05 | 13F | Bayban | 25 | 1 | ||||||
| 2026-04-16 | 13F | Phillips Financial Management, Llc | 18.978 | -11,09 | 1.147 | -7,13 | ||||
| 2026-02-13 | 13F | Wealth Alliance | 15.150 | 0,72 | 876 | 2,94 | ||||
| 2026-02-09 | 13F | Clearwater Capital Advisors, LLC | 15.337 | -1,69 | 887 | 0,57 | ||||
| 2026-02-13 | 13F | Mml Investors Services, Llc | 4.847 | 280 | ||||||
| 2026-02-13 | 13F | SRS Capital Advisors, Inc. | 86 | 5 | ||||||
| 2026-04-20 | 13F | Ronald Blue Trust, Inc. | 499 | 0,00 | 30 | 7,14 | ||||
| 2026-01-26 | 13F | Patriot Financial Group Insurance Agency, LLC | 4.558 | -0,61 | 264 | 1,54 | ||||
| 2026-02-05 | 13F | Cambridge Investment Research Advisors, Inc. | 6.025 | 18,28 | 0 | |||||
| 2026-01-28 | 13F | Kingswood Wealth Advisors, Llc | 20.510 | -24,71 | 1.187 | -23,04 | ||||
| 2026-02-13 | 13F | Gts Securities Llc | 6.521 | -32,13 | 377 | -30,57 | ||||
| 2026-01-20 | 13F | Ascent Group, LLC | 1.051.430 | 23,78 | 60.825 | 26,56 | ||||
| 2026-02-13 | 13F | 10Elms LLP | 2 | 0,00 | 0 | |||||
| 2026-04-08 | 13F | Wealth Enhancement Advisory Services, Llc | 8.056 | 486 | ||||||
| 2026-04-17 | 13F | Worth Asset Management, LLC | 8.378 | 506 | ||||||
| 2026-02-05 | 13F | AlphaCore Capital LLC | 120.326 | -0,29 | 6.961 | 1,95 | ||||
| 2026-02-17 | 13F | Modern Wealth Management, LLC | 108.742 | -0,30 | 6.291 | 1,93 | ||||
| 2025-11-12 | 13F | Transce3nd, LLC | 0 | -100,00 | 0 | |||||
| 2026-02-17 | 13F | Fmr Llc | 772.684 | -5,50 | 44.700 | -3,38 | ||||
| 2026-02-17 | 13F | Keebeck Wealth Management, LLC | 51.677 | -0,76 | 2.990 | 1,46 | ||||
| 2026-02-05 | 13F | Thrivent Financial For Lutherans | 49.980 | 12,00 | 3 | 0,00 | ||||
| 2026-04-13 | 13F | CGC Financial Services, LLC | 57 | 3 | ||||||
| 2025-11-12 | 13F | Creekmur Asset Management LLC | 1 | 0,00 | 0 | |||||
| 2026-02-06 | 13F | EverSource Wealth Advisors, LLC | 1.161 | 8,40 | 67 | 11,67 | ||||
| 2026-04-20 | 13F | Kastel Capital Advisors, LLC | 56.938 | 0,00 | 3.294 | 0,00 | ||||
| 2026-04-16 | 13F | Evolve Private Wealth, Llc | 363.367 | 4,00 | 21.958 | 8,64 | ||||
| 2026-01-26 | 13F | Private Trust Co Na | 1.770 | -11,50 | 102 | -9,73 | ||||
| 2026-01-08 | 13F | Traveka Wealth, LLC | 13.047 | 86,41 | 755 | 90,40 | ||||
| 2025-11-14 | 13F | NorthRock Partners, LLC | 0 | -100,00 | 0 | -100,00 | ||||
| 2026-01-29 | 13F | Atlas Legacy Advisors, LLC | 5.904 | 0,00 | 342 | 2,10 | ||||
| 2026-01-27 | 13F | Horst & Graben Wealth Management LLC | 23.171 | 1,54 | 1.340 | 3,80 | ||||
| 2026-01-29 | 13F | Comerica Bank | 8.513 | 0,00 | 492 | 2,29 | ||||
| 2026-02-12 | 13F | Bank Of Montreal /can/ | 56.588 | 92,48 | 3.274 | 96,81 | ||||
| 2026-02-10 | 13F | New Republic Capital, LLC | 30 | 0,00 | 2 | 0,00 | ||||
| 2026-02-17 | 13F | Stokes Family Office, LLC | 321.316 | 18,16 | 18.588 | 20,81 | ||||
| 2026-02-17 | 13F | Royal Bank Of Canada | 7.148 | -93,08 | 415 | -92,90 | ||||
| 2026-01-20 | 13F | Stratos Wealth Partners, LTD. | 20.828 | 3,95 | 1.205 | 6,27 | ||||
| 2026-02-03 | 13F | Gallacher Capital Management LLC | 16.191 | 76,05 | 937 | 80,00 | ||||
| 2026-04-16 | 13F | Heck Capital Advisors, LLC | 8.548 | -76,25 | 517 | -75,22 | ||||
| 2026-04-13 | 13F | IFP Advisors, Inc | 5.163 | -0,83 | 312 | 3,65 | ||||
| 2026-02-13 | 13F | Morgan Stanley | 814.633 | -2,76 | 47.127 | -0,58 | ||||
| 2025-11-04 | 13F | Guerra Advisors Inc | 279 | 16 | ||||||
| 2026-02-12 | 13F | Rossby Financial, LCC | 83 | 38,33 | 5 | 33,33 | ||||
| 2026-02-17 | 13F | Equitable Holdings, Inc. | 270.722 | 12,79 | 15.661 | 15,32 | ||||
| 2026-02-12 | 13F | Hibernia Wealth Partners, LLC | 14.381 | 832 | ||||||
| 2026-02-17 | 13F | Captrust Financial Advisors | 18.741 | 2,17 | 1.084 | 4,53 | ||||
| 2026-02-11 | 13F | J.w. Cole Advisors, Inc. | 9.072 | 6,57 | 525 | 8,94 | ||||
| 2026-01-14 | 13F | Pallas Capital Advisors LLC | 3.548 | -0,08 | 205 | 2,50 | ||||
| 2026-02-10 | 13F | Envestnet Asset Management Inc | 384.117 | -11,44 | 22.221 | -9,45 | ||||
| 2026-04-13 | 13F | Cyndeo Wealth Partners, LLC | 12.100 | -40,43 | 731 | -37,79 | ||||
| 2026-01-16 | 13F | Aspire Private Capital, LLC | 4.936 | -41,54 | 286 | -40,25 | ||||
| 2026-04-16 | 13F | Capital Advisors, Ltd. LLC | 3.274 | -9,93 | 0 | |||||
| 2026-02-14 | 13F | Rockefeller Capital Management L.P. | 520 | 642,86 | 30 | 900,00 | ||||
| 2026-01-21 | 13F | Signature Resources Capital Management, LLC | 112 | 0,00 | 6 | 0,00 | ||||
| 2025-10-28 | 13F | Qrg Capital Management, Inc. | 0 | -100,00 | 0 | |||||
| 2026-02-17 | 13F | Advisor Group Holdings, Inc. | 50.564 | 2,12 | 2.926 | 8,89 | ||||
| 2026-01-22 | 13F | Networth Advisors, LLC | 4 | 0 | ||||||
| 2026-02-11 | 13F | Parallel Advisors, LLC | 29 | 2 | ||||||
| 2026-02-17 | 13F | North Capital, Inc. | 0 | -100,00 | 0 | |||||
| 2026-01-27 | 13F | Vantagepoint Investment Advisers Llc | 3.014.701 | 0,00 | 174.400 | 2,24 | ||||
| 2026-02-12 | 13F | Jane Street Group, Llc | 200.000 | 11.570 | ||||||
| 2026-01-23 | 13F | Visionary Horizons, LLC | 0 | -100,00 | 0 | |||||
| 2026-01-30 | 13F | Us Bancorp \de\ | 3.204 | -38,43 | 185 | -37,07 | ||||
| 2025-11-05 | 13F | Howe & Rusling Inc | 0 | -100,00 | 0 | |||||
| 2026-04-15 | 13F | Exchange Traded Concepts, Llc | 100.720 | -32,87 | 6.087 | -29,88 | ||||
| 2026-01-16 | 13F | RHS Financial, LLC | 105.914 | -0,79 | 6.127 | 1,44 | ||||
| 2026-01-22 | 13F | Wetzel Investment Advisors, Inc. | 20.851 | 30,24 | 1.206 | 33,26 | ||||
| 2026-02-02 | 13F | Ascent Wealth Partners, LLC | 4.465 | 0,00 | 258 | 2,38 | ||||
| 2026-02-13 | 13F | National Bank Of Canada /fi/ | 194 | -4,43 | 11 | 0,00 | ||||
| 2026-04-08 | 13F | Seed Wealth Management, Inc. | 5.500 | 0,00 | 332 | 4,40 | ||||
| 2026-02-17 | 13F | Jones Financial Companies Lllp | 0 | -100,00 | 0 | |||||
| 2026-01-27 | 13F | PFG Advisors | 62.272 | -1,32 | 3.602 | 0,90 | ||||
| 2026-01-07 | 13F | Sagespring Wealth Partners, Llc | 1.191.033 | 3,24 | 68.901 | 5,56 | ||||
| 2026-02-13 | 13F | Citigroup Inc | 497 | 49.600,00 | 29 | |||||
| 2026-04-09 | 13F | Acropolis Investment Management, LLC | 3.601 | 0,00 | 218 | 4,33 | ||||
| 2026-04-20 | 13F | Hoxton Planning & Management, LLC | 4.474 | -8,43 | 270 | -4,26 | ||||
| 2026-04-15 | 13F | Parsons Capital Management Inc/ri | 10.874 | 16,01 | 657 | 21,22 | ||||
| 2026-02-13 | 13F | Mariner, LLC | 47.508 | -3,13 | 2.748 | -0,94 | ||||
| 2026-02-13 | 13F | Integrated Wealth Concepts LLC | 19.594 | -85,41 | 1.134 | -85,09 | ||||
| 2026-02-05 | 13F | Intrua Financial, LLC | 37.357 | 24,21 | 2.161 | 27,04 | ||||
| 2026-02-05 | 13F | Allworth Financial LP | 801 | 0,50 | 46 | 2,22 | ||||
| 2026-02-06 | 13F | Csenge Advisory Group | 4.982 | 8,21 | 288 | 10,77 | ||||
| 2026-04-15 | 13F | Cypress Wealth Services, LLC | 12.542 | 4,53 | 758 | 9,08 | ||||
| 2026-04-15 | 13F | Merit Financial Group, LLC | 6.913 | -31,91 | 418 | -28,96 | ||||
| 2026-02-17 | 13F | Ameriprise Financial Inc | 516.825 | -37,05 | 29.899 | -35,68 | ||||
| 2026-02-13 | 13F | Financial Freedom, LLC | 13.159 | -7,79 | 761 | -5,70 | ||||
| 2026-02-17 | 13F | SageView Advisory Group, LLC | 2.968 | 172 | ||||||
| 2026-01-23 | 13F | Diversify Advisory Services, LLC | 17.026 | 1.042 | ||||||
| 2026-04-15 | 13F | Signature Estate & Investment Advisors Llc | 14.685 | -4,49 | 887 | -0,22 | ||||
| 2026-01-21 | 13F | Capital Investment Advisory Services, LLC | 40 | 2 | ||||||
| 2026-02-05 | 13F | Bessemer Group Inc | 393 | 0,00 | 0 | |||||
| 2026-02-11 | 13F | Franklin Resources Inc | 47 | 0,00 | 3 | 0,00 | ||||
| 2026-04-16 | 13F | Stonebridge Wealth Management, LLC | 22.754 | 0,03 | 1.375 | 4,56 | ||||
| 2026-01-20 | 13F | Savvy Advisors, Inc. | 3.938 | -26,78 | 228 | -25,33 | ||||
| 2026-01-06 | 13F | Tucker Asset Management Llc | 0 | -100,00 | 0 | |||||
| 2026-02-17 | 13F | Old Mission Capital Llc | 30.470 | -65,52 | 1.763 | -64,76 | ||||
| 2026-02-17 | 13F | Bank Of America Corp /de/ | 249.349 | 1,15 | 14.425 | 3,42 | ||||
| 2026-02-10 | 13F | Foundations Investment Advisors, LLC | 161.217 | 1,99 | 9.326 | 4,28 | ||||
| 2026-04-14 | 13F | LifeGoal Wealth Advisors | 63.755 | 11,59 | 3.899 | 17,97 | ||||
| 2026-02-02 | 13F | One Wealth Advisors, LLC | 32.996 | 12,43 | 1.909 | 14,94 | ||||
| 2026-02-04 | 13F | Frontier Asset Management, LLC | 158.525 | -8,16 | 9.171 | -6,09 | ||||
| 2026-02-13 | 13F | Veridan Wealth LLC | 0 | -100,00 | 0 | |||||
| 2026-02-11 | 13F | Greykasell Wealth Strategies, Inc. | 95 | 6 | ||||||
| 2026-04-15 | 13F | Weil Company, Inc. | 130.197 | 7,45 | 7.868 | 12,24 | ||||
| 2026-02-11 | 13F | Cerity Partners LLC | 91.384 | 4,41 | 5.287 | 6,74 | ||||
| 2026-04-07 | 13F | CoreCap Advisors, LLC | 877 | -0,34 | 53 | 4,00 | ||||
| 2026-04-15 | 13F | Ridgeline Wealth, LLC | 4.030 | -1,42 | 244 | 2,97 | ||||
| 2026-02-19 | 13F | BFI Wealth Solutions, LLC | 4.917 | 284 | ||||||
| 2026-02-19 | 13F | Atomi Financial Group, Inc. | 12.914 | 0,00 | 747 | 2,33 | ||||
| 2025-11-12 | 13F | Duncan Williams Asset Management, LLC | 0 | -100,00 | 0 | |||||
| 2025-10-30 | 13F | Twin Peaks Wealth Advisors, LLC | 0 | -100,00 | 0 | |||||
| 2026-02-10 | 13F | Jordan Park Group LLC | 5.118 | 0,00 | 296 | 2,42 | ||||
| 2026-02-12 | 13F | JT Stratford LLC | 191.796 | 11.095 | ||||||
| 2026-02-10 | 13F | Root Financial Partners, LLC | 771 | 0,65 | 45 | 2,33 | ||||
| 2025-11-12 | 13F | Robertson Stephens Wealth Management, LLC | 0 | -100,00 | 0 | |||||
| 2026-01-26 | 13F | Lansing Street Advisors | 14.242 | -6,60 | 824 | -4,52 | ||||
| 2026-04-07 | 13F | U.S. Capital Wealth Advisors, LLC | 49.234 | 244,63 | 2.975 | 260,17 | ||||
| 2026-04-16 | 13F | Annex Advisory Services, LLC | 591.848 | 35.765 | ||||||
| 2026-02-02 | 13F | Fifth Third Bancorp | 226 | 13 | ||||||
| 2026-02-13 | 13F | Kestra Advisory Services, LLC | 0 | -100,00 | 0 | |||||
| 2026-01-26 | 13F | Asset Dedication, LLC | 2.556 | 0,00 | 148 | 2,08 | ||||
| 2026-02-09 | 13F | Harbour Investments, Inc. | 906 | 0,00 | 52 | 1,96 | ||||
| 2026-02-19 | 13F/A | Axxcess Wealth Management, Llc | 5.904 | 342 | ||||||
| 2026-02-13 | 13F | Golden State Wealth Management, LLC | 229 | 0,00 | 13 | 8,33 | ||||
| 2026-02-09 | 13F | Strategic Financial Services, Inc, | 1.888.930 | 0,85 | 120.060 | 13,29 | ||||
| 2026-02-09 | 13F | Hantz Financial Services, Inc. | 34 | 0,00 | 0 | |||||
| 2026-02-13 | 13F | MAI Capital Management | 317 | 0,00 | 18 | 5,88 | ||||
| 2025-11-14 | 13F | Qube Research & Technologies Ltd | 0 | -100,00 | 0 | -100,00 | ||||
| 2026-01-22 | 13F | HHM Wealth Advisors, LLC | 0 | -100,00 | 0 | |||||
| 2026-04-08 | 13F | Asempa Wealth Advisors | 6.950 | 2,10 | 425 | 7,89 | ||||
| 2026-04-13 | 13F | Bourgeon Capital Management Llc | 8.607 | -28,76 | 520 | -25,50 | ||||
| 2026-02-13 | 13F | OpenArc Corporate Advisory, LLC | 17.420 | 1.008 | ||||||
| 2026-02-03 | 13F | Cabot Wealth Management Inc | 3.745 | 217 | ||||||
| 2026-01-13 | 13F | Mayflower Financial Advisors, LLC | 8.906 | -2,97 | 515 | -0,77 | ||||
| 2026-02-12 | 13F | Steward Partners Investment Advisory, Llc | 5 | 0,00 | 0 | |||||
| 2026-02-09 | 13F | Blue Bell Private Wealth Management, Llc | 35 | 0,00 | 2 | 100,00 | ||||
| 2026-02-13 | 13F | Stark Wealth Management LLC | 0 | -100,00 | 0 | |||||
| 2026-02-18 | 13F | Beacon Pointe Advisors, LLC | 41.640 | 0,00 | 2.409 | 2,25 | ||||
| 2026-01-22 | 13F | Systelligence, LLC | 194.317 | -5,30 | 11.241 | -3,18 | ||||
| 2026-02-10 | 13F | Goldstein Advisors, LLC | 16.325 | 10,91 | 944 | 13,46 | ||||
| 2026-02-13 | 13F | Smartleaf Asset Management LLC | 406 | 5,18 | 24 | 9,52 | ||||
| 2026-02-12 | 13F | BlackRock, Inc. | 2.922 | 15,31 | 169 | 18,18 | ||||
| 2026-04-10 | 13F | Novem Group | 5.424 | -16,94 | 328 | -13,26 | ||||
| 2026-02-17 | 13F | Advisory Services Network, LLC | 5.153 | 1,86 | 298 | 4,20 | ||||
| 2026-02-17 | 13F | Mercer Global Advisors Inc /adv | 162.493 | -0,87 | 9.400 | 1,36 | ||||
| 2026-02-04 | 13F | Hirtle Callaghan & Co LLC | 21.314 | 1,67 | 1.233 | 3,96 | ||||
| 2026-04-13 | 13F | Affinity Capital Advisors, LLC | 8.130 | -18,90 | 491 | -15,20 | ||||
| 2026-04-07 | 13F | Farther Finance Advisors, LLC | 81.359 | 1,61 | 4.973 | 7,36 | ||||
| 2026-02-11 | 13F | Vise Technologies, Inc. | 76.634 | 186,65 | 4.433 | 193,19 | ||||
| 2026-04-13 | 13F | Wolff Wiese Magana Llc | 140 | 0,00 | 8 | 0,00 | ||||
| 2026-04-08 | 13F | Arlington Trust Co LLC | 135 | 0,00 | 8 | 14,29 | ||||
| 2026-01-23 | 13F | Sheridan Capital Management, LLC | 4.129 | 0,00 | 239 | 2,15 | ||||
| 2026-01-22 | 13F | Glass Jacobson Investment Advisors llc | 0 | -100,00 | 0 | |||||
| 2026-04-07 | 13F | First Citizens Financial Corp | 22.856 | 19,45 | 1.381 | 24,86 | ||||
| 2026-01-23 | 13F | Assetmark, Inc | 5.370 | 6,63 | 311 | 9,15 | ||||
| 2026-04-13 | 13F | Accelerate Investment Advisors LLC | 3.448 | 208 | ||||||
| 2026-02-02 | 13F | Oak Harbor Wealth Partners, Llc | 20 | 0,00 | 1 | 0,00 | ||||
| 2026-01-29 | 13F | Kickstand Ventures, Llc. | 22.519 | 0,71 | 1.303 | 2,92 |