Grundlæggende statistik
| Institutionelle ejere | 54 total, 54 long only, 0 short only, 0 long/short - change of 0,00% MRQ |
| Gennemsnitlig porteføljeallokering | 0.4438 % - change of -46,90% MRQ |
| Institutionelle aktier (lange) | 3.940.433 (ex 13D/G) - change of 0,18MM shares 4,92% MRQ |
| Institutionel værdi (lang) | $ 116.296 USD ($1000) |
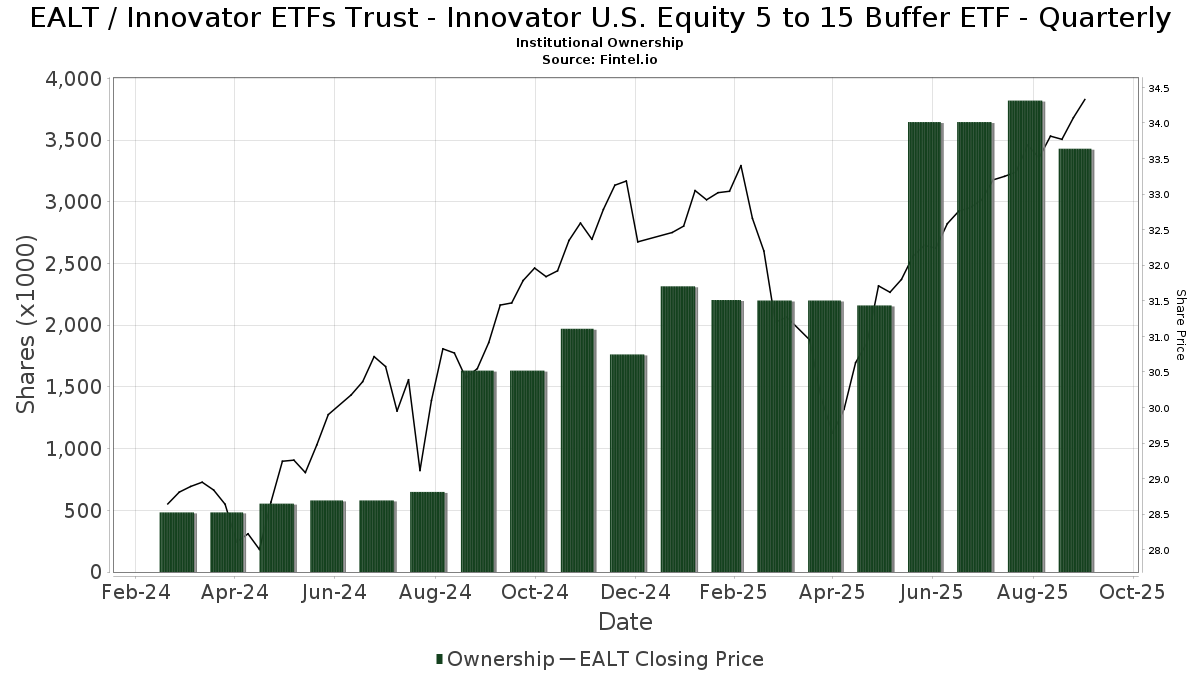
Institutionelt ejerskab og aktionærer
Innovator ETFs Trust - Innovator U.S. Equity 5 to 15 Buffer ETF - Quarterly (US:EALT) har 54 institutionelle ejere og aktionærer, der har indsendt 13D/G- eller 13F-formularer til Securities Exchange Commission (SEC). Disse institutioner har i alt 3,940,433 aktier. Største aktionærer omfatter Bullseye Investment Management, LLC, Cwm, Llc, Commonwealth Equity Services, Llc, Brinker Capital Investments, LLC, Mutual Advisors, LLC, Brookstone Capital Management, SMART Wealth LLC, Raymond James Financial Inc, Cetera Investment Advisers, and Farther Finance Advisors, LLC .
Innovator ETFs Trust - Innovator U.S. Equity 5 to 15 Buffer ETF - Quarterly (BATS:EALT) institutionel ejerskabsstruktur viser aktuelle positioner i virksomheden efter institutioner og fonde, samt seneste ændringer i positionsstørrelse. Større aktionærer kan omfatte individuelle investorer, investeringsforeninger, hedgefonde eller institutioner. Skema 13D angiver, at investoren besidder (eller besidder) mere end 5 % af virksomheden og har til hensigt (eller har til hensigt at) aktivt at forfølge en ændring i forretningsstrategi. Skema 13G indikerer en passiv investering på over 5%.
The share price as of April 14, 2026 is 34,77 / share. Previously, on April 15, 2025, the share price was 30,05 / share. This represents an increase of 15,71% over that period.
Fondens stemningsscore
Fund Sentiment Score (fka Ownership Accumulation Score) finder de aktier, der bliver mest købt af fonde. Det er resultatet af en sofistikeret, multi-faktor kvantitativ model, der identificerer virksomheder med de højeste niveauer af institutionel akkumulering. Scoringsmodellen bruger en kombination af den samlede stigning i oplyste ejere, ændringerne i porteføljeallokeringer i disse ejere og andre målinger. Tallet går fra 0 til 100, hvor højere tal indikerer et højere niveau af akkumulering for sine jævnaldrende, og 50 er gennemsnittet.
Opdateringsfrekvens: Dagligt
Se Ownership Explorer, som giver en liste over højest rangerende virksomheder.
AI+ Ask Fintel’s AI assistant about Innovator ETFs Trust - Innovator U.S. Equity 5 to 15 Buffer ETF - Quarterly.
Select a question to share a public post with an AI-crafted answer.
Thinking of good questions…
Institutionel Put/Call-forhold
Ud over at indberette standardaktie- og gældsudstedelser skal institutter med mere end 100 mill. aktiver under forvaltning også oplyse deres put- og call-optionsbeholdninger. Da salgsoptioner generelt indikerer negativ stemning, og købsoptioner indikerer positiv stemning, kan vi få en fornemmelse af den overordnede institutionelle stemning ved at plotte forholdet mellem put og kald. Diagrammet til højre viser det historiske put/call-forhold for dette instrument.
Brug af Put/Call Ratio som en indikator for investorernes stemning overvinder en af de vigtigste mangler ved at bruge totalt institutionelt ejerskab, som er, at en betydelig mængde af aktiver under forvaltning investeres passivt for at spore indekser. Passivt forvaltede fonde køber typisk ikke optioner, så indikatoren for put/call-forholdet følger mere nøje følelsen af aktivt forvaltede fonde.
13F og NPORT arkivering
Detaljer om 13F-arkivering er gratis. Detaljer om NP-ansøgninger kræver et premium-medlemskab. Grønne rækker angiver nye positioner. Røde rækker angiver lukkede positioner. Klik på linket ikon for at se den fulde transaktionshistorik.
Opgrader
for at låse premium-data op og eksportere til Excel ![]() .
.
| Fil dato | Kilde | Investor | Type | Gennemsnitlig pris (Øst) |
Aktier | Δ Aktier (%) |
Rapporteret Værdi ($1000) |
Δ Værdi (%) |
Port Alloc (%) |
|
|---|---|---|---|---|---|---|---|---|---|---|
| 2026-01-07 | 13F | Sagespring Wealth Partners, Llc | 11.614 | 0,00 | 410 | 2,00 | ||||
| 2026-02-17 | 13F | Old Mission Capital Llc | 9.460 | 334 | ||||||
| 2026-02-02 | 13F | Woodard & Co Asset Management Group Inc /adv | 892 | -42,15 | 31 | -41,51 | ||||
| 2026-02-05 | 13F | Sequent Planning LLC | 15.741 | -16,75 | 556 | -15,01 | ||||
| 2026-02-13 | 13F | Visionary Wealth Advisors | 18.567 | 25,00 | 655 | 27,68 | ||||
| 2026-02-13 | 13F | Kestra Advisory Services, LLC | 0 | -100,00 | 0 | |||||
| 2026-02-13 | 13F | Advyzon Investment Management, LLC | 13.717 | -0,44 | 484 | 1,89 | ||||
| 2026-02-20 | 13F | Sunbelt Securities, Inc. | 5.178 | 0,00 | 183 | 2,25 | ||||
| 2025-10-30 | 13F | 3EDGE Asset Management, LP | 0 | -100,00 | 0 | |||||
| 2026-02-02 | 13F | Benjamin Edwards Inc | 20.278 | 0,84 | 716 | 3,03 | ||||
| 2026-02-05 | 13F | Atria Investments Llc | 61.171 | 7,90 | 2.159 | 10,21 | ||||
| 2025-11-14 | 13F | Hrt Financial Lp | 0 | -100,00 | 0 | |||||
| 2026-04-13 | 13F | IFP Advisors, Inc | 5.513 | 17,35 | 185 | 12,12 | ||||
| 2025-10-22 | 13F | Blue Bell Private Wealth Management, Llc | 0 | -100,00 | 0 | -100,00 | ||||
| 2026-02-09 | 13F | Harbour Investments, Inc. | 26.912 | -4,36 | 950 | -2,37 | ||||
| 2026-04-07 | 13F | Farther Finance Advisors, LLC | 81.717 | 25,98 | 2.758 | 20,45 | ||||
| 2026-02-03 | 13F | Encompass More Asset Management | 50.572 | 8,72 | 1.785 | 11,01 | ||||
| 2026-01-22 | 13F | Triad Wealth Partners, LLC | 63.982 | 20,50 | 2.258 | 23,06 | ||||
| 2026-02-12 | 13F | Steward Partners Investment Advisory, Llc | 12.532 | 73,96 | 442 | 78,23 | ||||
| 2026-02-02 | 13F | Vantage Point Financial LLC | 6.332 | 223 | ||||||
| 2026-02-05 | 13F | Cambridge Investment Research Advisors, Inc. | 25.171 | 0,35 | 1 | |||||
| 2026-02-13 | 13F | Tableaux Llc | 25.694 | -58,49 | 907 | -57,62 | ||||
| 2026-02-12 | 13F | Triumph Capital Management | 400 | 0,00 | 14 | 7,69 | ||||
| 2026-02-17 | 13F | Advisory Services Network, LLC | 0 | -100,00 | 0 | |||||
| 2026-01-26 | 13F | AE Wealth Management LLC | 5.816 | 472,44 | 205 | 485,71 | ||||
| 2026-02-12 | 13F | Brinker Capital Investments, LLC | 260.189 | 11,12 | 9.182 | 13,51 | ||||
| 2026-02-03 | 13F | RFG Advisory, LLC | 33.173 | -0,18 | 1.171 | 1,92 | ||||
| 2026-02-12 | 13F | Commonwealth Equity Services, Llc | 334.716 | 178,49 | 11.812 | 295.200,00 | ||||
| 2026-01-23 | 13F | Smith, Moore & Co. | 20.021 | 0,00 | 707 | 2,17 | ||||
| 2026-02-05 | 13F | Bright Futures Wealth Management, LLC. | 26.451 | -4,17 | 933 | -2,10 | ||||
| 2026-02-17 | 13F | First Commonwealth Financial Corp /pa/ | 6.228 | 0,00 | 220 | 1,86 | ||||
| 2026-02-17 | 13F | Raymond James Financial Inc | 172.084 | 2,47 | 6.073 | 4,67 | ||||
| 2026-01-12 | 13F | Lee Johnson Capital Management, Llc | 32.211 | -1,29 | 1.137 | 0,80 | ||||
| 2026-01-22 | 13F | Brookwood Investment Group LLC | 33.812 | 22,61 | 1.193 | 25,32 | ||||
| 2026-01-29 | 13F | Concurrent Investment Advisors, LLC | 13.614 | 86,65 | 480 | 90,48 | ||||
| 2025-10-15 | 13F | Cambridge Advisors Inc. | 0 | -100,00 | 0 | |||||
| 2026-04-06 | 13F | Hiley Hunt Wealth Management | 12.293 | -31,09 | 413 | -34,50 | ||||
| 2026-02-06 | 13F | HighTower Advisors, LLC | 0 | -100,00 | 0 | |||||
| 2026-04-08 | 13F | First Heartland Consultants, Inc. | 7.883 | -1,93 | 265 | -6,71 | ||||
| 2026-02-10 | 13F | Goldman Sachs Group Inc | 0 | -100,00 | 0 | |||||
| 2026-02-17 | 13F | Cetera Investment Advisers | 115.682 | 0,96 | 4.082 | 3,13 | ||||
| 2026-02-11 | 13F | Jpmorgan Chase & Co | 571 | 20 | ||||||
| 2026-04-09 | 13F | C2P Capital Advisory Group, LLC d.b.a. Prosperity Capital Advisors | 34.951 | 55,25 | 1.174 | 47,86 | ||||
| 2025-11-14 | 13F | Royal Bank Of Canada | 0 | -100,00 | 0 | -100,00 | ||||
| 2026-02-17 | 13F | Susquehanna International Group, Llp | 22.377 | -46,42 | 790 | -45,28 | ||||
| 2026-01-29 | 13F | Sanctuary Advisors, LLC | 8.183 | 0,00 | 289 | 2,13 | ||||
| 2026-02-02 | 13F | Bullseye Investment Management, LLC | 880.391 | 0,00 | 27.067 | 0,00 | ||||
| 2026-01-15 | 13F | Brookstone Capital Management | 196.513 | 80,08 | 6.935 | 83,93 | ||||
| 2026-01-26 | 13F | Cwm, Llc | 503.121 | 8,38 | 18 | 6,25 | ||||
| 2026-02-11 | 13F | Stirlingshire Investments, Inc. | 13.551 | 478 | ||||||
| 2026-02-04 | 13F | Ameritas Advisory Services, LLC | 48.800 | 5.688,85 | 1.722 | 5.837,93 | ||||
| 2026-01-05 | 13F | Noble Wealth Management PBC | 0 | -100,00 | 0 | |||||
| 2026-02-17 | 13F | Advisor Group Holdings, Inc. | 66.118 | 26,73 | 2.333 | 30,63 | ||||
| 2026-01-29 | 13F | Ashton Thomas Private Wealth, LLC | 6.070 | -16,14 | 214 | -14,40 | ||||
| 2026-02-17 | 13F | IHT Wealth Management, LLC | 56.697 | -15,47 | 2.035 | -13,74 | ||||
| 2026-02-13 | 13F | Financial Network Wealth Advisors LLC | 8.519 | 8,18 | 301 | 10,29 | ||||
| 2026-02-17 | 13F | Claro Advisors LLC | 7.810 | 20,71 | 276 | 23,32 | ||||
| 2025-11-14 | 13F | Jane Street Group, Llc | 0 | -100,00 | 0 | |||||
| 2026-02-13 | 13F | Pinnacle Wealth Planning Services, Inc. | 8.361 | 4,02 | 295 | 6,50 | ||||
| 2026-02-09 | 13F | Arista Wealth Management, LLC | 30.095 | 413,30 | 1.062 | 425,74 | ||||
| 2026-01-29 | 13F | Wheelhouse Advisory Group LLC | 6.020 | 300 | ||||||
| 2026-02-02 | 13F | Mutual Advisors, LLC | 258.872 | 5,35 | 9.136 | 6,82 | ||||
| 2026-01-26 | 13F | SMART Wealth LLC | 191.833 | -9,15 | 6.770 | -7,21 | ||||
| 2026-02-10 | 13F | Envestnet Asset Management Inc | 53.995 | 7,16 | 1.905 | 9,48 | ||||
| 2026-02-13 | 13F | Barclays Plc | 0 | -100,00 | 0 | |||||
| 2026-02-13 | 13F | Ausdal Financial Partners, Inc. | 7.969 | 11,97 | 281 | 14,69 |