Grundlæggende statistik
| Institutionelle ejere | 94 total, 94 long only, 0 short only, 0 long/short - change of 11,90% MRQ |
| Gennemsnitlig porteføljeallokering | 1.5699 % - change of -18,71% MRQ |
| Institutionelle aktier (lange) | 53.998.061 (ex 13D/G) - change of 0,03MM shares 0,06% MRQ |
| Institutionel værdi (lang) | $ 1.531.659 USD ($1000) |
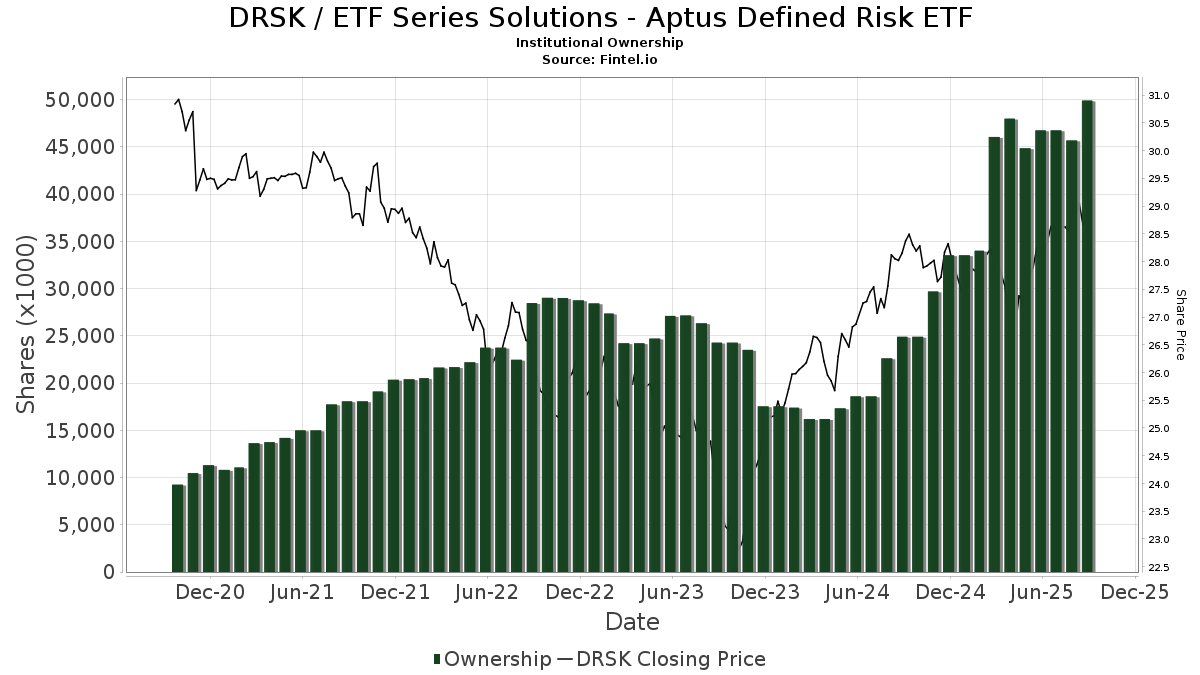
Institutionelt ejerskab og aktionærer
ETF Series Solutions - Aptus Defined Risk ETF (US:DRSK) har 94 institutionelle ejere og aktionærer, der har indsendt 13D/G- eller 13F-formularer til Securities Exchange Commission (SEC). Disse institutioner har i alt 53,998,061 aktier. Største aktionærer omfatter Aptus Capital Advisors, LLC, Integrated Wealth Concepts LLC, Guardian Wealth Advisors, Llc / Nc, CI Private Wealth, LLC, Diversified Enterprises, LLC, Kfg Wealth Management, Llc, Compass Ion Advisors, LLC, Second Line Capital, LLC, Clarus Group, Inc., and Gerber, Llc .
ETF Series Solutions - Aptus Defined Risk ETF (BATS:DRSK) institutionel ejerskabsstruktur viser aktuelle positioner i virksomheden efter institutioner og fonde, samt seneste ændringer i positionsstørrelse. Større aktionærer kan omfatte individuelle investorer, investeringsforeninger, hedgefonde eller institutioner. Skema 13D angiver, at investoren besidder (eller besidder) mere end 5 % af virksomheden og har til hensigt (eller har til hensigt at) aktivt at forfølge en ændring i forretningsstrategi. Skema 13G indikerer en passiv investering på over 5%.
The share price as of March 27, 2026 is 27,30 / share. Previously, on March 28, 2025, the share price was 27,37 / share. This represents a decline of 0,26% over that period.
Fondens stemningsscore
Fund Sentiment Score (fka Ownership Accumulation Score) finder de aktier, der bliver mest købt af fonde. Det er resultatet af en sofistikeret, multi-faktor kvantitativ model, der identificerer virksomheder med de højeste niveauer af institutionel akkumulering. Scoringsmodellen bruger en kombination af den samlede stigning i oplyste ejere, ændringerne i porteføljeallokeringer i disse ejere og andre målinger. Tallet går fra 0 til 100, hvor højere tal indikerer et højere niveau af akkumulering for sine jævnaldrende, og 50 er gennemsnittet.
Opdateringsfrekvens: Dagligt
Se Ownership Explorer, som giver en liste over højest rangerende virksomheder.
AI+ Ask Fintel’s AI assistant about ETF Series Solutions - Aptus Defined Risk ETF.
Select a question to share a public post with an AI-crafted answer.
Thinking of good questions…
Institutionel Put/Call-forhold
Ud over at indberette standardaktie- og gældsudstedelser skal institutter med mere end 100 mill. aktiver under forvaltning også oplyse deres put- og call-optionsbeholdninger. Da salgsoptioner generelt indikerer negativ stemning, og købsoptioner indikerer positiv stemning, kan vi få en fornemmelse af den overordnede institutionelle stemning ved at plotte forholdet mellem put og kald. Diagrammet til højre viser det historiske put/call-forhold for dette instrument.
Brug af Put/Call Ratio som en indikator for investorernes stemning overvinder en af de vigtigste mangler ved at bruge totalt institutionelt ejerskab, som er, at en betydelig mængde af aktiver under forvaltning investeres passivt for at spore indekser. Passivt forvaltede fonde køber typisk ikke optioner, så indikatoren for put/call-forholdet følger mere nøje følelsen af aktivt forvaltede fonde.
13F og NPORT arkivering
Detaljer om 13F-arkivering er gratis. Detaljer om NP-ansøgninger kræver et premium-medlemskab. Grønne rækker angiver nye positioner. Røde rækker angiver lukkede positioner. Klik på linket ikon for at se den fulde transaktionshistorik.
Opgrader
for at låse premium-data op og eksportere til Excel ![]() .
.
| Fil dato | Kilde | Investor | Type | Gennemsnitlig pris (Øst) |
Aktier | Δ Aktier (%) |
Rapporteret Værdi ($1000) |
Δ Værdi (%) |
Port Alloc (%) |
|
|---|---|---|---|---|---|---|---|---|---|---|
| 2026-01-20 | 13F | Princeton Global Asset Management LLC | 4.137 | 118 | ||||||
| 2026-02-04 | 13F | Independent Advisor Alliance | 98.407 | 245,29 | 2.802 | 241,17 | ||||
| 2026-02-12 | 13F | Chilton Capital Management Llc | 2.637 | 75 | ||||||
| 2026-01-22 | 13F | Brookwood Investment Group LLC | 386.913 | 11.015 | ||||||
| 2026-02-10 | 13F | Waterloo Capital, L.P. | 679.415 | -3,76 | 19.343 | -4,97 | ||||
| 2026-01-29 | 13F | Mendel Money Management | 91.344 | 53,69 | 2.601 | 51,78 | ||||
| 2026-02-06 | 13F | Pnc Financial Services Group, Inc. | 420 | -55,08 | 12 | -57,69 | ||||
| 2026-02-13 | 13F | Jacobi Capital Management LLC | 18.749 | -24,35 | 534 | -25,35 | ||||
| 2026-01-09 | 13F | Park Place Capital Corp | 657.299 | 8,70 | 18.713 | 7,34 | ||||
| 2026-02-05 | 13F | Wealth Advisory Team LLC | 413.104 | 4,01 | 11.761 | 3,03 | ||||
| 2026-01-26 | 13F | Financial Guidance Group, Inc. | 238.812 | 25,52 | 6.799 | 23,94 | ||||
| 2026-02-09 | 13F | Harbour Investments, Inc. | 1.897 | 4,63 | 54 | 3,85 | ||||
| 2026-01-21 | 13F | Sunburst Financial Group, LLC | 752.410 | 10,91 | 21.421 | 9,53 | ||||
| 2026-01-15 | 13F | One + One Wealth Management, Llc | 161.699 | 2,96 | 4.604 | 1,68 | ||||
| 2026-01-14 | 13F | True Vision MN LLC | 63.789 | -1,18 | 1.816 | -2,37 | ||||
| 2026-01-26 | 13F | Whittier Trust Co | 2.838 | 82 | ||||||
| 2025-11-14 | 13F | Mercer Global Advisors Inc /adv | 0 | -100,00 | 0 | |||||
| 2026-02-17 | 13F | Guardian Wealth Advisors, Llc / Nc | 4.354.072 | 1,11 | 123.960 | -0,15 | ||||
| 2026-01-07 | 13F | Cyndeo Wealth Partners, LLC | 80.133 | 2.281 | ||||||
| 2026-02-13 | 13F | Morgan Stanley | 999 | 99.800,00 | 28 | |||||
| 2026-01-15 | 13F | Brookstone Capital Management | 1.077.889 | 0,76 | 30.687 | -0,50 | ||||
| 2026-02-17 | 13F | Royal Bank Of Canada | 22.250 | 28,07 | 633 | 26,35 | ||||
| 2026-01-20 | 13F | Savvy Advisors, Inc. | 172.440 | 4.909 | ||||||
| 2026-01-23 | 13F | Assetmark, Inc | 23 | 0,00 | 1 | |||||
| 2026-02-11 | 13F | LPL Financial LLC | 862.385 | -1,01 | 24.552 | -2,25 | ||||
| 2026-01-23 | 13F | Visionary Horizons, LLC | 19.995 | 170,82 | 569 | 168,40 | ||||
| 2026-02-11 | 13F | Parallel Advisors, LLC | 15.699 | 3,73 | 447 | 2,29 | ||||
| 2026-01-21 | 13F | McElhenny Sheffield Capital Management, LLC | 7.400 | 0,00 | 211 | -1,41 | ||||
| 2026-02-13 | 13F | Kestra Advisory Services, LLC | 0 | -100,00 | 0 | |||||
| 2025-11-04 | 13F | Jones Financial Companies Lllp | 0 | -100,00 | 0 | -100,00 | ||||
| 2026-02-17 | 13F | Maripau Wealth Management Llc | 198.628 | 12,66 | 5.663 | 11,39 | ||||
| 2026-01-23 | 13F | Optima Capital Llc | 2.951 | 84 | ||||||
| 2026-03-16 | 13F/A | Rockefeller Capital Management L.P. | 306 | 9 | ||||||
| 2026-01-29 | 13F | UBS Group AG | 1.541 | 94,57 | 44 | 95,45 | ||||
| 2026-02-17 | 13F | Regal Investment Advisors LLC | 126.236 | 220,18 | 3.594 | 216,29 | ||||
| 2026-01-30 | 13F | Renasant Bank | 115.331 | -14,10 | 3.283 | -15,17 | ||||
| 2026-01-21 | 13F | Prime Capital Investment Advisors, LLC | 220.211 | 17,22 | 6.269 | 15,75 | ||||
| 2026-02-13 | 13F | Integrated Wealth Concepts LLC | 5.968.043 | -9,47 | 169.910 | -10,60 | ||||
| 2026-02-17 | 13F | Citadel Advisors Llc | 9.095 | -33,42 | 259 | -34,35 | ||||
| 2026-02-05 | 13F | Atria Investments Llc | 95.279 | 15,79 | 2.713 | 14,33 | ||||
| 2026-02-09 | 13F | Leavell Investment Management, Inc. | 86.000 | 0,00 | 2.448 | -1,25 | ||||
| 2026-01-14 | 13F | Wealthcare Advisory Partners LLC | 403.302 | 7,31 | 11.482 | 5,97 | ||||
| 2026-01-26 | 13F | Second Half Financial Partners, LLC | 108.980 | 1,75 | 3.103 | 0,49 | ||||
| 2026-02-17 | 13F | Advisor Group Holdings, Inc. | 45.469 | -14,61 | 1.295 | -15,70 | ||||
| 2026-02-12 | 13F | Principal Securities, Inc. | 0 | -100,00 | 0 | |||||
| 2026-02-04 | 13F | Meridian Wealth Management, LLC | 42.702 | 496,73 | 1.216 | 489,81 | ||||
| 2026-02-13 | 13F | Tcfg Wealth Management, Llc | 0 | -100,00 | 0 | -100,00 | ||||
| 2026-01-06 | 13F | RDA Financial Network | 10.740 | 9,70 | 306 | 8,16 | ||||
| 2026-01-21 | 13F | Gerber, Llc | 1.230.111 | 49,98 | 35.021 | 48,11 | ||||
| 2026-01-15 | 13F | Lord & Richards Wealth Management, LLC | 283.886 | 4,31 | 8.082 | 3,01 | ||||
| 2026-01-26 | 13F | Private Trust Co Na | 3.733 | 129,72 | 106 | 130,43 | ||||
| 2026-02-17 | 13F | Captrust Financial Advisors | 97.562 | -5,90 | 2.778 | -7,09 | ||||
| 2026-02-06 | 13F | Magnolia Private Wealth, LLC | 10.620 | 0,98 | 302 | -0,33 | ||||
| 2026-02-17 | 13F | Susquehanna International Group, Llp | 15.374 | 438 | ||||||
| 2026-02-12 | 13F | Betterment LLC | 26.546 | 18,81 | 1 | |||||
| 2026-01-13 | 13F | CoreCap Advisors, LLC | 212 | 0,00 | 6 | 0,00 | ||||
| 2026-01-23 | 13F | Lunt Capital Management, Inc. | 9.465 | 269 | ||||||
| 2026-02-06 | 13F | Global Retirement Partners, LLC | 3.768 | 0,69 | 107 | 0,00 | ||||
| 2026-02-10 | 13F | Envestnet Asset Management Inc | 0 | -100,00 | 0 | |||||
| 2026-01-14 | 13F | EdgeRock Capital LLC | 265.399 | 0,73 | 7.556 | -0,51 | ||||
| 2026-02-05 | 13F | Thrivent Financial For Lutherans | 166.365 | 5 | ||||||
| 2026-01-26 | 13F | Code Waechter LLC | 119.612 | -4,24 | 3.405 | -6,79 | ||||
| 2025-11-04 | 13F | Gibbs Wealth Management | 0 | -100,00 | 0 | |||||
| 2026-02-13 | 13F | Change Path, LLC | 70.741 | 2.014 | ||||||
| 2026-02-11 | 13F | O'shaughnessy Asset Management, Llc | 272 | -9,33 | 8 | -12,50 | ||||
| 2025-11-14 | 13F | Old Mission Capital Llc | 0 | -100,00 | 0 | |||||
| 2025-11-14 | 13F | Wolverine Trading, Llc | 0 | -100,00 | 0 | |||||
| 2026-01-13 | 13F | Signal Advisors Wealth, LLC | 986.272 | 15,45 | 28.079 | 14,01 | ||||
| 2026-02-06 | 13F | Wilian Securities, LLC | 50.449 | 1.436 | ||||||
| 2026-02-12 | 13F | Brogan Financial, Inc. | 988.515 | -1,28 | 28.143 | -2,51 | ||||
| 2026-01-16 | 13F | Clarus Group, Inc. | 1.264.557 | -2,25 | 36.002 | -3,47 | ||||
| 2026-02-02 | 13F | SevenBridge Financial Group, LLC | 1.144.153 | 4,33 | 32.391 | 0,29 | ||||
| 2026-01-09 | 13F | First Heartland Consultants, Inc. | 964.963 | 6,93 | 27.473 | 5,60 | ||||
| 2025-11-13 | 13F | Richard W. Paul & Associates, LLC | 0 | -100,00 | 0 | -100,00 | ||||
| 2026-01-02 | 13F | Global Wealth Strategies & Associates | 130 | 4 | ||||||
| 2026-01-21 | 13F | Kfg Wealth Management, Llc | 1.714.919 | 8,98 | 48.824 | 7,62 | ||||
| 2026-02-18 | 13F/A | Virtue Capital Management, LLC | 10.531 | 2.572,84 | 299 | 5,65 | ||||
| 2026-01-07 | 13F | TrueWealth Advisors, LLC | 426.746 | 6,05 | 12.149 | 4,73 | ||||
| 2026-02-13 | 13F | Uniting Wealth Partners, LLC | 0 | -100,00 | 0 | |||||
| 2026-02-03 | 13F | Retirement Planning Group | 21.776 | -16,14 | 620 | -17,25 | ||||
| 2026-01-15 | 13F | SILVER OAK SECURITIES, Inc | 332.801 | 2,33 | 9.518 | 1,51 | ||||
| 2026-02-04 | 13F | Pandora Wealth, Inc. | 373.268 | 0,96 | 10.627 | -0,30 | ||||
| 2026-02-19 | 13F | CI Private Wealth, LLC | 2.102.108 | 1,77 | 59.847 | 101.335,59 | ||||
| 2026-01-21 | 13F | MBE Wealth Management, LLC | 284.848 | 6,02 | 8.110 | 4,69 | ||||
| 2025-11-13 | 13F | Advisor Resource Council | 0 | -100,00 | 0 | |||||
| 2026-02-12 | 13F | BRYN MAWR TRUST Co | 1.791 | 0,00 | 51 | -1,96 | ||||
| 2026-02-17 | 13F | Raymond James Financial Inc | 1.100.851 | -1,79 | 31.341 | -3,02 | ||||
| 2025-11-17 | 13F | FSA Wealth Management LLC | 309 | 0,00 | 9 | 0,00 | ||||
| 2026-01-29 | 13F | Compass Ion Advisors, LLC | 1.375.514 | 7,60 | 39.161 | 6,26 | ||||
| 2026-02-17 | 13F | Gladstone Institutional Advisory LLC | 11.215 | -23,54 | 319 | -24,41 | ||||
| 2026-02-17 | 13F | Advisory Services Network, LLC | 797.323 | 4,46 | 22.700 | 3,15 | ||||
| 2026-01-13 | 13F | Synergy Financial Management, LLC | 40.771 | 1.161 | ||||||
| 2026-01-28 | 13F | Diversified Enterprises, LLC | 1.736.566 | 3,59 | 49.440 | 2,30 | ||||
| 2026-02-17 | 13F | Bienville Capital Management, LLC | 586.211 | 9,39 | 16.689 | 8,02 | ||||
| 2026-01-14 | 13F | Cushing Capital Partners, LLC | 287.382 | 1,92 | 8.182 | 0,64 | ||||
| 2026-02-12 | 13F | Jane Street Group, Llc | 24.910 | -91,92 | 709 | -92,02 | ||||
| 2026-01-16 | 13F | SWS Partners | 159.036 | 4,22 | 4.528 | 2,91 | ||||
| 2026-02-18 | 13F | Strong Retirement Solutions LLC | 14.095 | 401 | ||||||
| 2026-01-13 | 13F | Kathmere Capital Management, LLC | 7.074 | -93,89 | 201 | -94,37 | ||||
| 2025-11-12 | 13F | Creekmur Asset Management LLC | 0 | -100,00 | 0 | |||||
| 2026-02-17 | 13F | Second Line Capital, LLC | 1.338.657 | 3,48 | 38.112 | 2,19 | ||||
| 2026-01-26 | 13F | Cwm, Llc | 0 | -100,00 | 0 | |||||
| 2026-01-26 | 13F | United Advisor Group, LLC | 278.085 | 2,60 | 7.917 | 1,32 | ||||
| 2026-02-03 | 13F | Emerald Investment Partners, Llc | 62 | 0,00 | 2 | 0,00 | ||||
| 2026-02-11 | 13F | SmartHarvest Portfolios, LLC | 16.376 | 466 | ||||||
| 2026-02-03 | 13F | Bokf, Na | 0 | -100,00 | 0 | |||||
| 2026-02-13 | 13F | Wells Fargo & Company/mn | 1 | -98,44 | 0 | -100,00 | ||||
| 2025-11-07 | 13F | Fifth Third Bancorp | 0 | -100,00 | 0 | |||||
| 2026-02-13 | 13F | Aptus Capital Advisors, LLC | 15.627.811 | 16,24 | 444.924 | 14,79 | ||||
| 2025-11-07 | 13F | Beacon Capital Management, LLC | 0 | -100,00 | 0 | |||||
| 2026-02-11 | 13F | Jpmorgan Chase & Co | 2.350 | 67 |