Grundlæggende statistik
| Institutionelle ejere | 122 total, 122 long only, 0 short only, 0 long/short - change of 3,33% MRQ |
| Gennemsnitlig porteføljeallokering | 0.0607 % - change of -20,84% MRQ |
| Institutionelle aktier (lange) | 10.226.244 (ex 13D/G) - change of 0,91MM shares 9,73% MRQ |
| Institutionel værdi (lang) | $ 172.870 USD ($1000) |
Institutionelt ejerskab og aktionærer
Global X Funds - Global X SuperDividend U.S. ETF (US:DIV) har 122 institutionelle ejere og aktionærer, der har indsendt 13D/G- eller 13F-formularer til Securities Exchange Commission (SEC). Disse institutioner har i alt 10,226,244 aktier. Største aktionærer omfatter FUKOKU MUTUAL LIFE INSURANCE Co, Morgan Stanley, AE Wealth Management LLC, LPL Financial LLC, Wells Fargo & Company/mn, Bank Of America Corp /de/, Global X Japan Co., Ltd., Wealthfront Advisers Llc, Northwestern Mutual Wealth Management Co, and Commonwealth Equity Services, Llc .
Global X Funds - Global X SuperDividend U.S. ETF (ARCA:DIV) institutionel ejerskabsstruktur viser aktuelle positioner i virksomheden efter institutioner og fonde, samt seneste ændringer i positionsstørrelse. Større aktionærer kan omfatte individuelle investorer, investeringsforeninger, hedgefonde eller institutioner. Skema 13D angiver, at investoren besidder (eller besidder) mere end 5 % af virksomheden og har til hensigt (eller har til hensigt at) aktivt at forfølge en ændring i forretningsstrategi. Skema 13G indikerer en passiv investering på over 5%.
The share price as of September 8, 2025 is 17,66 / share. Previously, on September 9, 2024, the share price was 18,22 / share. This represents a decline of 3,09% over that period.

Fondens stemningsscore
Fund Sentiment Score (fka Ownership Accumulation Score) finder de aktier, der bliver mest købt af fonde. Det er resultatet af en sofistikeret, multi-faktor kvantitativ model, der identificerer virksomheder med de højeste niveauer af institutionel akkumulering. Scoringsmodellen bruger en kombination af den samlede stigning i oplyste ejere, ændringerne i porteføljeallokeringer i disse ejere og andre målinger. Tallet går fra 0 til 100, hvor højere tal indikerer et højere niveau af akkumulering for sine jævnaldrende, og 50 er gennemsnittet.
Opdateringsfrekvens: Dagligt
Se Ownership Explorer, som giver en liste over højest rangerende virksomheder.
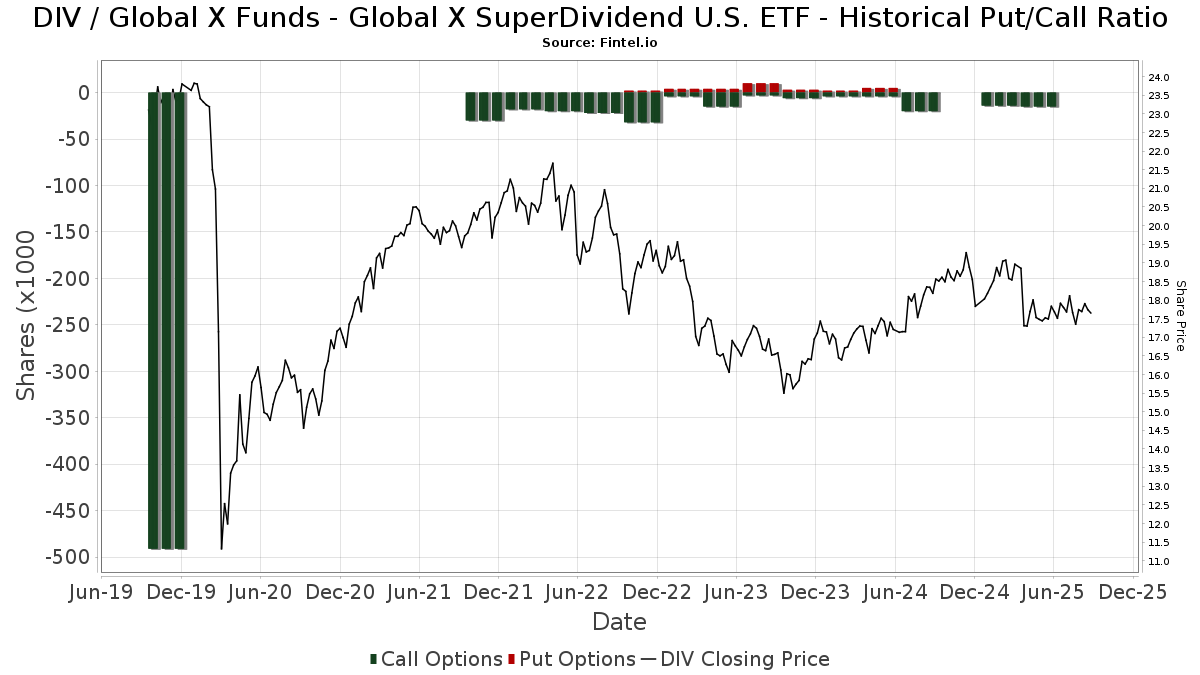
Institutionel Put/Call-forhold
Ud over at indberette standardaktie- og gældsudstedelser skal institutter med mere end 100 mill. aktiver under forvaltning også oplyse deres put- og call-optionsbeholdninger. Da salgsoptioner generelt indikerer negativ stemning, og købsoptioner indikerer positiv stemning, kan vi få en fornemmelse af den overordnede institutionelle stemning ved at plotte forholdet mellem put og kald. Diagrammet til højre viser det historiske put/call-forhold for dette instrument.
Brug af Put/Call Ratio som en indikator for investorernes stemning overvinder en af de vigtigste mangler ved at bruge totalt institutionelt ejerskab, som er, at en betydelig mængde af aktiver under forvaltning investeres passivt for at spore indekser. Passivt forvaltede fonde køber typisk ikke optioner, så indikatoren for put/call-forholdet følger mere nøje følelsen af aktivt forvaltede fonde.
13F og NPORT arkivering
Detaljer om 13F-arkivering er gratis. Detaljer om NP-ansøgninger kræver et premium-medlemskab. Grønne rækker angiver nye positioner. Røde rækker angiver lukkede positioner. Klik på linket ikon for at se den fulde transaktionshistorik.
Opgrader
for at låse premium-data op og eksportere til Excel ![]() .
.
| Fil dato | Kilde | Investor | Type | Gennemsnitlig pris (Øst) |
Aktier | Δ Aktier (%) |
Rapporteret Værdi ($1000) |
Δ Værdi (%) |
Port Alloc (%) |
|
|---|---|---|---|---|---|---|---|---|---|---|
| 2025-08-08 | 13F | Creative Planning | 16.065 | -2,44 | 282 | -9,03 | ||||
| 2025-07-21 | 13F | Curran Financial Partners, LLC | 121.947 | -65,16 | 2.144 | -67,50 | ||||
| 2025-07-21 | 13F | Crews Bank & Trust | 7.305 | 0,00 | 128 | -6,57 | ||||
| 2025-08-14 | 13F | UBS Group AG | 40.512 | 14,95 | 712 | 7,39 | ||||
| 2025-08-11 | 13F | Private Advisor Group, LLC | 11.608 | 4,48 | 204 | -2,39 | ||||
| 2025-08-14 | 13F | Qube Research & Technologies Ltd | 303 | 10.000,00 | 5 | |||||
| 2025-07-18 | 13F | PFG Investments, LLC | 11.189 | -22,42 | 197 | -27,68 | ||||
| 2025-07-17 | 13F | Janney Montgomery Scott LLC | 35.832 | -3,84 | 1 | |||||
| 2025-07-11 | 13F | Caldwell Securities, Inc | 100 | 0,00 | 2 | 0,00 | ||||
| 2025-07-18 | 13F | Truist Financial Corp | 19.724 | -0,48 | 347 | -7,24 | ||||
| 2025-08-12 | 13F | Jpmorgan Chase & Co | 42.154 | -3,40 | 741 | -9,85 | ||||
| 2025-07-17 | 13F | C2C Wealth Management, LLC | 19.000 | 0,00 | 334 | -6,44 | ||||
| 2025-08-14 | 13F | Two Sigma Investments, Lp | 121.300 | 98,85 | 2.132 | 85,55 | ||||
| 2025-07-25 | 13F | Cwm, Llc | 16.119 | 0,00 | 0 | |||||
| 2025-08-05 | 13F | GPS Wealth Strategies Group, LLC | 4.639 | 366,23 | 82 | 350,00 | ||||
| 2025-04-30 | 13F | Slagle Financial, LLC | 0 | -100,00 | 0 | -100,00 | ||||
| 2025-04-29 | 13F | Wood Tarver Financial Group, LLC | 0 | -100,00 | 0 | |||||
| 2025-07-31 | 13F | Wealthfront Advisers Llc | 304.537 | 5,08 | 5.354 | -1,96 | ||||
| 2025-07-31 | 13F | Cambridge Investment Research Advisors, Inc. | 92.713 | -0,44 | 2 | 0,00 | ||||
| 2025-07-21 | 13F | Ntv Asset Management Llc | 24.725 | -7,48 | 435 | -13,72 | ||||
| 2025-07-21 | 13F | Ameritas Advisory Services, LLC | 2.049 | 36 | ||||||
| 2025-08-14 | 13F | Goldman Sachs Group Inc | 84.097 | -0,04 | 1.478 | -6,69 | ||||
| 2025-07-28 | 13F | Mutual Advisors, LLC | 36.840 | 23,36 | 657 | 22,80 | ||||
| 2025-08-08 | 13F | Advyzon Investment Management, LLC | 25.402 | 18,47 | 447 | 10,67 | ||||
| 2025-07-14 | 13F | AdvisorNet Financial, Inc | 646 | 0,00 | 11 | -8,33 | ||||
| 2025-08-14 | 13F | Royal Bank Of Canada | 145.222 | 22,80 | 2.553 | 14,59 | ||||
| 2025-08-06 | 13F | AE Wealth Management LLC | 999.605 | 7,93 | 17.573 | 0,71 | ||||
| 2025-08-12 | 13F | Founders Financial Alliance, LLC | 11.258 | 3,44 | 198 | -3,90 | ||||
| 2025-08-07 | 13F | Kestra Private Wealth Services, Llc | 21.415 | 24,33 | 376 | 16,05 | ||||
| 2025-07-18 | 13F | Chelsea Counsel Co | 5.350 | 46,58 | 94 | 38,24 | ||||
| 2025-07-21 | 13F | Ameriflex Group, Inc. | 367 | 0,00 | 6 | 0,00 | ||||
| 2025-08-14 | 13F | Citadel Advisors Llc | Put | 0 | -100,00 | 0 | ||||
| 2025-08-08 | 13F | Wiser Advisor Group LLC | 0 | -100,00 | 0 | |||||
| 2025-07-25 | 13F | Atria Wealth Solutions, Inc. | 0 | -100,00 | 0 | |||||
| 2025-08-04 | 13F | Creekmur Asset Management LLC | 0 | 0 | ||||||
| 2025-08-04 | 13F | Joseph P. Lucia & Associates, LLC | 15.610 | -11,21 | 274 | -17,22 | ||||
| 2025-08-12 | 13F | Park Square Financial Group, LLC | 11.068 | 4,11 | 195 | -3,00 | ||||
| 2025-08-19 | 13F | Newbridge Financial Services Group, Inc. | 1.800 | -28,57 | 32 | -34,04 | ||||
| 2025-07-24 | 13F | IFP Advisors, Inc | 4.300 | -7,27 | 76 | -13,79 | ||||
| 2025-07-30 | 13F | Patten Group, Inc. | 15.625 | 0,00 | 275 | -6,80 | ||||
| 2025-08-06 | 13F | Commonwealth Equity Services, Llc | 191.027 | 2,42 | 3 | 0,00 | ||||
| 2025-08-12 | 13F | Global Retirement Partners, LLC | 28.963 | 1,18 | 509 | -1,36 | ||||
| 2025-07-11 | 13F | Global X Japan Co., Ltd. | 424.451 | 22,92 | 7.462 | 14,70 | ||||
| 2025-08-13 | 13F | SMART Wealth LLC | 163.275 | 17,84 | 2.870 | 9,96 | ||||
| 2025-08-14 | 13F | Harwood Advisory Group, LLC | 1 | 0,00 | 0 | |||||
| 2025-07-16 | 13F | Perigon Wealth Management, LLC | 10.005 | 0,00 | 176 | -6,91 | ||||
| 2025-08-12 | 13F | BlackRock, Inc. | 188 | 2,17 | 3 | 0,00 | ||||
| 2025-07-28 | 13F | RFG Advisory, LLC | 21.149 | 0,16 | 372 | -6,55 | ||||
| 2025-08-11 | 13F | Pineridge Advisors LLC | 1.819 | 0,55 | 32 | -8,82 | ||||
| 2025-08-14 | 13F | Bank Of America Corp /de/ | 704.289 | -18,33 | 12.381 | -23,80 | ||||
| 2025-08-12 | 13F | FUKOKU MUTUAL LIFE INSURANCE Co | 1.873.000 | 26,98 | 32.927 | 18,49 | ||||
| 2025-07-09 | 13F | Triumph Capital Management | 29.515 | -0,05 | 519 | -6,83 | ||||
| 2025-08-04 | 13F | Daymark Wealth Partners, Llc | 10.789 | 0,00 | 190 | -6,90 | ||||
| 2025-08-08 | 13F | Kingsview Wealth Management, LLC | 36.417 | 10,67 | 640 | 3,39 | ||||
| 2025-08-08 | 13F | Cetera Investment Advisers | 77.466 | 12,92 | 1.362 | 5,34 | ||||
| 2025-08-14 | 13F | Sequent Planning LLC | 13.047 | 229 | ||||||
| 2025-08-12 | 13F | Proequities, Inc. | 0 | 0 | ||||||
| 2025-08-06 | 13F | Walkner Condon Financial Advisors LLC | 16.650 | 0,75 | 293 | -6,11 | ||||
| 2025-08-13 | 13F | Colonial Trust Advisors | 500 | 0,00 | 9 | -11,11 | ||||
| 2025-07-29 | 13F | Stratos Wealth Partners, LTD. | 68.423 | 2,61 | 1.203 | -4,30 | ||||
| 2025-08-14 | 13F | Stifel Financial Corp | 15.150 | -3,73 | 266 | -10,14 | ||||
| 2025-07-24 | 13F | Blair William & Co/il | 1.005 | 18 | ||||||
| 2025-05-01 | 13F | Quest 10 Wealth Builders, Inc. | 22.040 | -2,18 | 415 | 2,22 | ||||
| 2025-07-15 | 13F | FLP Wealth Management, LLC | 0 | -100,00 | 0 | |||||
| 2025-08-04 | 13F | Assetmark, Inc | 5 | 0,00 | 0 | |||||
| 2025-08-08 | 13F | SBI Securities Co., Ltd. | 7.206 | 8,46 | 127 | 0,80 | ||||
| 2025-08-08 | 13F | Fortis Group Advisors, LLC | 300 | 0,00 | 5 | 0,00 | ||||
| 2025-07-24 | 13F | Us Bancorp \de\ | 5.320 | 0,00 | 94 | -7,00 | ||||
| 2025-08-15 | 13F | Tower Research Capital LLC (TRC) | 47 | 1 | ||||||
| 2025-07-21 | 13F | Monticello Wealth Management, Llc | 10.267 | 0,00 | 180 | -6,74 | ||||
| 2025-08-15 | 13F | Morgan Stanley | 1.091.703 | 10,85 | 19.192 | 3,44 | ||||
| 2025-08-13 | 13F | Northwestern Mutual Wealth Management Co | 264.502 | 526,95 | 4.650 | 485,52 | ||||
| 2025-05-06 | 13F | Venturi Wealth Management, LLC | 0 | -100,00 | 0 | |||||
| 2025-07-14 | 13F | Wealth Advisory Solutions, LLC | 24.725 | 44,17 | 435 | 34,37 | ||||
| 2025-08-12 | 13F | SRS Capital Advisors, Inc. | 64 | 0,00 | 1 | 0,00 | ||||
| 2025-07-18 | 13F | B.O.S.S. Retirement Advisors, LLC | 100.726 | -0,36 | 1.771 | -7,04 | ||||
| 2025-08-15 | 13F | Kestra Advisory Services, LLC | 18.861 | 28,64 | 332 | 19,93 | ||||
| 2025-07-31 | 13F | Buckingham Strategic Partners | 14.145 | 0,01 | 249 | -6,77 | ||||
| 2025-07-29 | 13F | Ballast, Inc. | 15.610 | 274 | ||||||
| 2025-08-06 | 13F | Hallmark Capital Management Inc | 1 | 0,00 | 0 | |||||
| 2025-08-08 | 13F | Foundations Investment Advisors, LLC | 18.415 | 1,63 | 324 | -5,28 | ||||
| 2025-09-04 | 13F/A | Advisor Group Holdings, Inc. | 148.764 | 74,54 | 2.616 | 62,83 | ||||
| 2025-08-18 | 13F/A | National Bank Of Canada /fi/ | 4.650 | 2,20 | 82 | -4,71 | ||||
| 2025-08-14 | 13F | Mariner, LLC | 28.170 | 0,44 | 495 | -6,25 | ||||
| 2025-07-11 | 13F | Farther Finance Advisors, LLC | 22.080 | 4,28 | 388 | -2,76 | ||||
| 2025-08-14 | 13F | Fmr Llc | 2.454 | -38,14 | 43 | -41,89 | ||||
| 2025-08-14 | 13F | Sunbelt Securities, Inc. | 6.900 | -0,26 | 124 | -4,62 | ||||
| 2025-08-08 | 13F/A | Sterling Capital Management LLC | 52 | 1,96 | 1 | |||||
| 2025-08-08 | 13F | Tortoise Investment Management, LLC | 1.000 | 0,00 | 18 | -5,56 | ||||
| 2025-08-05 | 13F | Huntington National Bank | 79 | -5,95 | ||||||
| 2025-07-09 | 13F | Breakwater Investment Management | 33 | 0,00 | 1 | |||||
| 2025-08-12 | 13F | CIBC Private Wealth Group, LLC | 992 | 39,52 | 17 | 54,55 | ||||
| 2025-07-14 | 13F | Caitlin John, LLC | 22.855 | 1,88 | 402 | -4,98 | ||||
| 2025-08-06 | 13F | Wedbush Securities Inc | 35.386 | -6,96 | 1 | |||||
| 2025-07-24 | 13F | Jfs Wealth Advisors, Llc | 1.544 | 0,00 | 27 | -6,90 | ||||
| 2025-07-24 | 13F | Ronald Blue Trust, Inc. | 250 | 0,00 | 4 | 0,00 | ||||
| 2025-08-12 | 13F | Steward Partners Investment Advisory, Llc | 33.408 | 12,93 | 587 | 5,39 | ||||
| 2025-08-14 | 13F | Comerica Bank | 2.644 | 0,00 | 46 | -6,12 | ||||
| 2025-08-14 | 13F | Raymond James Financial Inc | 108.546 | -20,64 | 1.908 | -25,93 | ||||
| 2025-08-14 | 13F | Citadel Advisors Llc | Call | 15.400 | 9,22 | 271 | 1,89 | |||
| 2025-08-12 | 13F | MAI Capital Management | 947 | 0,00 | 17 | -5,88 | ||||
| 2025-08-11 | 13F | HighTower Advisors, LLC | 14.817 | 29,79 | 260 | 20,93 | ||||
| 2025-08-13 | 13F | Scotia Capital Inc. | 10.888 | 0,00 | 191 | -6,83 | ||||
| 2025-08-05 | 13F | Cherry Tree Wealth Management, LLC | 1.064 | 0,00 | 19 | -10,00 | ||||
| 2025-07-07 | 13F | Teamwork Financial Advisors, LLC | 12.388 | -0,26 | 218 | -6,87 | ||||
| 2025-08-14 | 13F | Mml Investors Services, Llc | 21.131 | 2,13 | 0 | |||||
| 2025-08-11 | 13F | Principal Securities, Inc. | 4.250 | 0,00 | 75 | -2,63 | ||||
| 2025-08-13 | 13F | Transce3nd, LLC | 4.352 | 3,20 | 77 | -3,80 | ||||
| 2025-07-21 | 13F | Mirae Asset Global Investments Co., Ltd. | 124.000 | 5,08 | 2.180 | -1,40 | ||||
| 2025-04-23 | 13F | Golden State Wealth Management, LLC | 0 | -100,00 | 0 | |||||
| 2025-08-06 | 13F | New Millennium Group LLC | 91 | 0,00 | 2 | 0,00 | ||||
| 2025-07-30 | 13F | Whittier Trust Co | 50 | 0,00 | 1 | |||||
| 2025-08-12 | 13F | J.w. Cole Advisors, Inc. | 15.456 | 272 | ||||||
| 2025-08-08 | 13F | Avantax Advisory Services, Inc. | 16.192 | -14,73 | 285 | -20,45 | ||||
| 2025-08-14 | 13F | GWM Advisors LLC | 4.858 | -0,96 | 85 | -7,61 | ||||
| 2025-07-22 | 13F | Simplicity Wealth,LLC | 27.414 | 72,77 | 482 | 61,41 | ||||
| 2025-08-14 | 13F | Susquehanna International Group, Llp | 25.718 | 452 | ||||||
| 2025-08-08 | 13F | Good Life Advisors, LLC | 23.339 | 3,62 | 410 | -3,30 | ||||
| 2025-08-11 | 13F | Citigroup Inc | 600 | 0,00 | 11 | -9,09 | ||||
| 2025-07-25 | 13F | Concord Wealth Partners | 725 | 13 | ||||||
| 2025-08-11 | 13F | TRUE Private Wealth Advisors | 12.175 | -17,73 | 214 | -23,02 | ||||
| 2025-08-01 | 13F | Envestnet Asset Management Inc | 64.596 | -2,25 | 1.136 | -8,84 | ||||
| 2025-07-23 | 13F | Eagle Strategies LLC | 39.354 | 6,99 | 692 | -0,14 | ||||
| 2025-08-14 | 13F | Arete Wealth Advisors, LLC | 0 | -100,00 | 0 | |||||
| 2025-08-13 | 13F | Jones Financial Companies Lllp | 45.727 | 24,12 | 803 | 16,38 | ||||
| 2025-07-31 | 13F | Cornerstone Management, Inc. | 11.663 | 0,00 | 205 | -6,39 | ||||
| 2025-08-11 | 13F | FSA Wealth Management LLC | 365 | 1,96 | 6 | 0,00 | ||||
| 2025-07-29 | 13F | Private Trust Co Na | 2.000 | 0,00 | 35 | -5,41 | ||||
| 2025-07-30 | 13F | LifeWealth Investments, LLC | 29.689 | 25,70 | 522 | 17,34 | ||||
| 2025-08-14 | 13F | Wells Fargo & Company/mn | 775.844 | 13,50 | 13.639 | 5,91 | ||||
| 2025-07-25 | 13F | Cypress Capital Group | 25.319 | 445 | ||||||
| 2025-07-25 | 13F | Apollon Wealth Management, LLC | 0 | -100,00 | 0 | -100,00 | ||||
| 2025-08-12 | 13F | LPL Financial LLC | 925.738 | -1,31 | 16.274 | -7,91 | ||||
| 2025-04-17 | 13F | Authentikos Wealth Advisory, LLC | 0 | -100,00 | 0 | |||||
| 2025-07-14 | 13F | Painted Porch Advisors LLC | 0 | -100,00 | 0 | |||||
| 2025-08-07 | 13F | Allworth Financial LP | 185 | -30,45 | 3 | -25,00 | ||||
| 2025-03-21 | 13F | Prostatis Group LLC | 0 | -100,00 | 0 | |||||
| 2025-08-14 | 13F | Bnp Paribas Arbitrage, Sa | 0 | -100,00 | 0 | |||||
| 2025-07-16 | 13F | Squire Investment Management Company, LLC | 14.089 | 0,00 | 248 | -6,79 |