Grundlæggende statistik
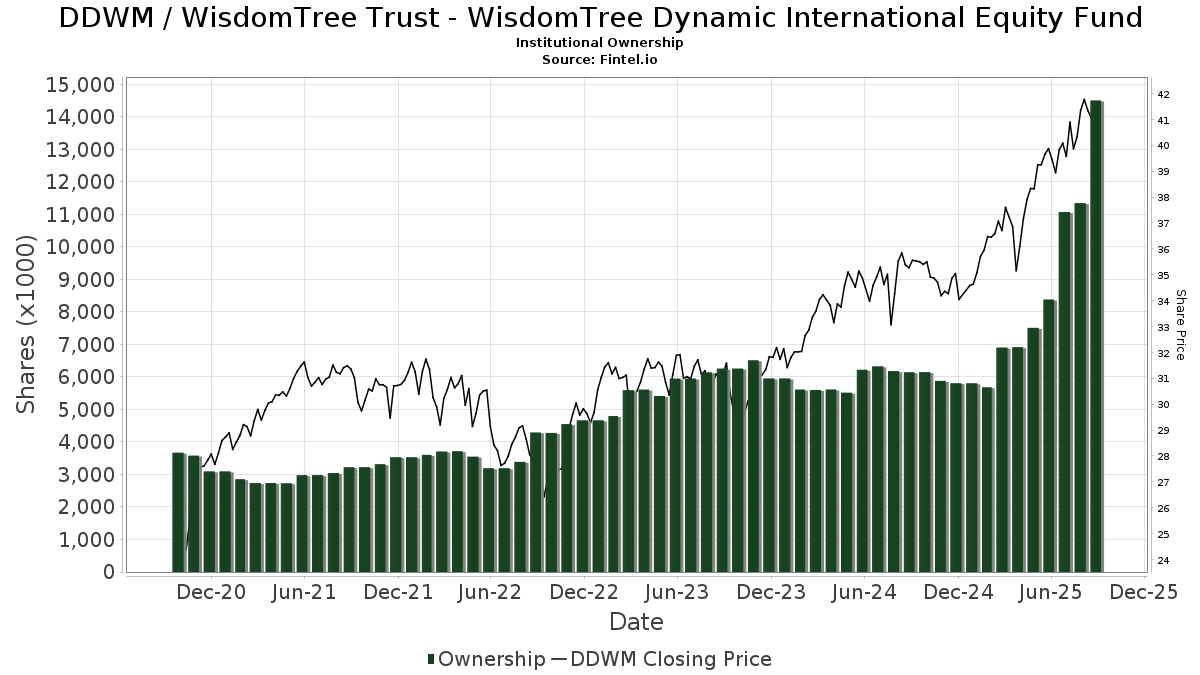
| Institutionelle ejere | 133 total, 133 long only, 0 short only, 0 long/short - change of 14,66% MRQ |
| Gennemsnitlig porteføljeallokering | 0.4866 % - change of 24,91% MRQ |
| Institutionelle aktier (lange) | 23.012.324 (ex 13D/G) - change of 3,48MM shares 17,79% MRQ |
| Institutionel værdi (lang) | $ 995.474 USD ($1000) |
Institutionelt ejerskab og aktionærer
WisdomTree Trust - WisdomTree Dynamic International Equity Fund (US:DDWM) har 133 institutionelle ejere og aktionærer, der har indsendt 13D/G- eller 13F-formularer til Securities Exchange Commission (SEC). Disse institutioner har i alt 23,012,324 aktier. Største aktionærer omfatter Park National Corp /oh/, LPL Financial LLC, Morgan Stanley, Hennion & Walsh Asset Management, Inc., Raymond James Financial Inc, Capital Asset Advisory Services LLC, Axxcess Wealth Management, Llc, SK Wealth Management, LLC, Bank Of America Corp /de/, and Cetera Investment Advisers .
WisdomTree Trust - WisdomTree Dynamic International Equity Fund (BATS:DDWM) institutionel ejerskabsstruktur viser aktuelle positioner i virksomheden efter institutioner og fonde, samt seneste ændringer i positionsstørrelse. Større aktionærer kan omfatte individuelle investorer, investeringsforeninger, hedgefonde eller institutioner. Skema 13D angiver, at investoren besidder (eller besidder) mere end 5 % af virksomheden og har til hensigt (eller har til hensigt at) aktivt at forfølge en ændring i forretningsstrategi. Skema 13G indikerer en passiv investering på over 5%.
The share price as of March 20, 2026 is 42,68 / share. Previously, on March 24, 2025, the share price was 37,27 / share. This represents an increase of 14,52% over that period.
Fondens stemningsscore
Fund Sentiment Score (fka Ownership Accumulation Score) finder de aktier, der bliver mest købt af fonde. Det er resultatet af en sofistikeret, multi-faktor kvantitativ model, der identificerer virksomheder med de højeste niveauer af institutionel akkumulering. Scoringsmodellen bruger en kombination af den samlede stigning i oplyste ejere, ændringerne i porteføljeallokeringer i disse ejere og andre målinger. Tallet går fra 0 til 100, hvor højere tal indikerer et højere niveau af akkumulering for sine jævnaldrende, og 50 er gennemsnittet.
Opdateringsfrekvens: Dagligt
Se Ownership Explorer, som giver en liste over højest rangerende virksomheder.
AI+ Ask Fintel’s AI assistant about WisdomTree Trust - WisdomTree Dynamic International Equity Fund.
Select a question to share a public post with an AI-crafted answer.
Thinking of good questions…
Institutionel Put/Call-forhold
Ud over at indberette standardaktie- og gældsudstedelser skal institutter med mere end 100 mill. aktiver under forvaltning også oplyse deres put- og call-optionsbeholdninger. Da salgsoptioner generelt indikerer negativ stemning, og købsoptioner indikerer positiv stemning, kan vi få en fornemmelse af den overordnede institutionelle stemning ved at plotte forholdet mellem put og kald. Diagrammet til højre viser det historiske put/call-forhold for dette instrument.
Brug af Put/Call Ratio som en indikator for investorernes stemning overvinder en af de vigtigste mangler ved at bruge totalt institutionelt ejerskab, som er, at en betydelig mængde af aktiver under forvaltning investeres passivt for at spore indekser. Passivt forvaltede fonde køber typisk ikke optioner, så indikatoren for put/call-forholdet følger mere nøje følelsen af aktivt forvaltede fonde.
13F og NPORT arkivering
Detaljer om 13F-arkivering er gratis. Detaljer om NP-ansøgninger kræver et premium-medlemskab. Grønne rækker angiver nye positioner. Røde rækker angiver lukkede positioner. Klik på linket ikon for at se den fulde transaktionshistorik.
Opgrader
for at låse premium-data op og eksportere til Excel ![]() .
.
| Fil dato | Kilde | Investor | Type | Gennemsnitlig pris (Øst) |
Aktier | Δ Aktier (%) |
Rapporteret Værdi ($1000) |
Δ Værdi (%) |
Port Alloc (%) |
|
|---|---|---|---|---|---|---|---|---|---|---|
| 2026-01-05 | 13F | Park Avenue Securities Llc | 12.557 | -3,90 | 1 | |||||
| 2026-01-13 | 13F | CoreCap Advisors, LLC | 4.079 | 1,44 | 178 | 5,36 | ||||
| 2026-02-17 | 13F | Gotham Asset Management, LLC | 24.215 | 5,20 | 1.054 | 9,56 | ||||
| 2026-02-11 | 13F | LPL Financial LLC | 2.401.402 | 13,27 | 104.557 | 17,99 | ||||
| 2026-01-26 | 13F | Cwm, Llc | 2.476 | -55,40 | 0 | |||||
| 2026-02-04 | 13F | AIFG Consultants Ltd. | 24.907 | 1.084 | ||||||
| 2026-02-10 | 13F | Rothschild Investment Llc | 650 | 0,00 | 28 | 3,70 | ||||
| 2026-02-09 | 13F | Rooted Wealth Advisors, Inc. | 4.429 | 203 | ||||||
| 2026-01-12 | 13F | Ffg Retirement Advisors Llc | 98.335 | -1,90 | 4.282 | 2,17 | ||||
| 2026-02-06 | 13F | Global Retirement Partners, LLC | 35.892 | 4,74 | 1.563 | 9,08 | ||||
| 2026-02-17 | 13F | Fmr Llc | 602 | 0,17 | 26 | 4,00 | ||||
| 2026-01-28 | 13F | CAPROCK Group, Inc. | 56.413 | 0,91 | 2.456 | 6,46 | ||||
| 2026-02-13 | 13F | Colony Group, LLC | 60.998 | -0,11 | 2.656 | 3,95 | ||||
| 2026-01-29 | 13F | Nbc Securities, Inc. | 73.154 | 334,46 | 3.185 | 353,06 | ||||
| 2026-02-09 | 13F | Harbour Investments, Inc. | 22.547 | 20,38 | 982 | 25,45 | ||||
| 2026-02-12 | 13F | Insigneo Advisory Services, Llc | 10.062 | 0,20 | 438 | 4,53 | ||||
| 2026-02-10 | 13F | Lido Advisors, LLC | 442.906 | 0,07 | 19.282 | 4,23 | ||||
| 2026-02-13 | 13F | MAI Capital Management | 4.006 | 0,02 | 174 | 4,19 | ||||
| 2026-02-13 | 13F | Morgan Stanley | 2.041.359 | 7,01 | 88.881 | 11,47 | ||||
| 2026-02-10 | 13F | Cherry Tree Wealth Management, LLC | 3.175 | 0,00 | 138 | 4,55 | ||||
| 2026-02-13 | 13F | Flow Traders U.s. Llc | 0 | -100,00 | 0 | |||||
| 2026-01-05 | 13F | Park National Corp /oh/ | 3.541.209 | 7,86 | 154.184 | 12,35 | ||||
| 2026-01-28 | 13F | Geneos Wealth Management Inc. | 48.983 | 0,76 | 2.133 | 4,92 | ||||
| 2026-02-11 | 13F | WESCAP Management Group, Inc. | 10.709 | -2,17 | 466 | 1,97 | ||||
| 2026-02-12 | 13F | Hrt Financial Lp | 8.110 | 0 | ||||||
| 2026-02-11 | 13F | Jpmorgan Chase & Co | 6.112 | 53,88 | 266 | 60,24 | ||||
| 2026-01-13 | 13F | Signal Advisors Wealth, LLC | 20.632 | 37,10 | 898 | 42,77 | ||||
| 2026-02-11 | 13F | O'shaughnessy Asset Management, Llc | 15.364 | 27,17 | 669 | 32,54 | ||||
| 2025-11-10 | 13F | Atomi Financial Group, Inc. | 0 | -100,00 | 0 | |||||
| 2026-01-29 | 13F | D.a. Davidson & Co. | 75.148 | 3,57 | 3.272 | 7,88 | ||||
| 2026-02-17 | 13F | Royal Bank Of Canada | 6.338 | -59,16 | 276 | -57,47 | ||||
| 2026-02-11 | 13F | Gateway Wealth Partners, LLC | 6.643 | 289 | ||||||
| 2026-02-17 | 13F | Advisor Group Holdings, Inc. | 16.192 | -1,92 | 705 | 2,77 | ||||
| 2026-01-23 | 13F | Assetmark, Inc | 114 | 0,00 | 5 | 0,00 | ||||
| 2026-01-29 | 13F | Concurrent Investment Advisors, LLC | 147.412 | 298,21 | 6.418 | 314,87 | ||||
| 2026-02-04 | 13F | Money Concepts Capital Corp | 10.559 | 5,52 | 460 | 9,81 | ||||
| 2026-02-10 | 13F | Tidemark, LLC | 387.053 | 5,56 | 16.852 | 9,96 | ||||
| 2025-11-06 | 13F | Stratos Wealth Advisors, LLC | 0 | -100,00 | 0 | |||||
| 2026-01-26 | 13F | Merit Financial Group, LLC | 4.731 | 206 | ||||||
| 2026-02-11 | 13F | Insight Advisors, LLC/ PA | 185.854 | 8.092 | ||||||
| 2026-02-17 | 13F | Pacific Financial Group Inc | 4.915 | 214 | ||||||
| 2025-10-15 | 13F | Defined Financial Planning LLC | 164.875 | 3.146,21 | 6.938 | 3.368,50 | ||||
| 2026-02-17 | 13F | Private Advisor Group, LLC | 106.296 | 263,55 | 4.628 | 278,72 | ||||
| 2026-02-17 | 13F | National Asset Management, Inc. | 20.616 | 5,28 | 898 | 9,66 | ||||
| 2026-02-05 | 13F | Atria Investments Llc | 390.357 | -3,27 | 16.996 | 0,76 | ||||
| 2026-02-17 | 13F | Bank Of America Corp /de/ | 882.583 | 46,03 | 38.428 | 52,11 | ||||
| 2026-01-14 | 13F | Wealthcare Advisory Partners LLC | 22.531 | 8,82 | 981 | 13,29 | ||||
| 2026-02-03 | 13F | AssuredPartners Investment Advisors, LLC | 33.989 | 1.480 | ||||||
| 2026-02-06 | 13F | GPS Wealth Strategies Group, LLC | 0 | -100,00 | 0 | |||||
| 2026-01-20 | 13F | Stratos Wealth Partners, LTD. | 12.944 | 4,83 | 564 | 9,11 | ||||
| 2026-01-29 | 13F | Comerica Bank | 1.531 | -15,23 | 67 | -12,00 | ||||
| 2026-02-17 | 13F | Two Sigma Securities, Llc | 0 | -100,00 | 0 | |||||
| 2026-02-10 | 13F | WCG Wealth Advisors LLC | 10.302 | 0,35 | 449 | 4,43 | ||||
| 2026-01-29 | 13F | UBS Group AG | 308.642 | 319,60 | 13.438 | 337,15 | ||||
| 2026-01-16 | 13F | Perigon Wealth Management, LLC | 11.785 | 59,80 | 513 | 66,56 | ||||
| 2026-01-07 | 13F | Impact Capital Partners LLC | 200.163 | 1,09 | 8.715 | 5,30 | ||||
| 2026-01-15 | 13F | Burns Matteson Capital Management, LLC | 112.317 | 2,30 | 4.890 | 6,56 | ||||
| 2026-01-20 | 13F | Fundamentun, Llc | 593.277 | 2,91 | 25.831 | 7,20 | ||||
| 2026-02-13 | 13F | Kestra Advisory Services, LLC | 0 | -100,00 | 0 | |||||
| 2026-02-12 | 13F | Bank Of Montreal /can/ | 1.007 | 0,00 | 44 | 2,38 | ||||
| 2026-01-23 | 13F | Optima Capital Llc | 55.576 | -27,77 | 2.420 | -24,78 | ||||
| 2026-02-18 | 13F | SkyView Investment Advisors, LLC | 5.807 | 0 | ||||||
| 2026-01-22 | 13F | Trilogy Capital Inc. | 37.292 | 323,34 | 1.624 | 341,03 | ||||
| 2026-01-22 | 13F | HHM Wealth Advisors, LLC | 1.354 | 0,00 | 59 | 3,57 | ||||
| 2026-02-10 | 13F | Root Financial Partners, LLC | 1.717 | 0,00 | 75 | 4,23 | ||||
| 2026-01-30 | 13F | Caldwell Trust Co | 1.304 | 57 | ||||||
| 2026-02-06 | 13F | Creative Financial Designs Inc /adv | 378 | 0,00 | 16 | 6,67 | ||||
| 2026-03-12 | 13F | Vericrest Private Wealth | 73.375 | 3.195 | ||||||
| 2026-02-13 | 13F | Wells Fargo & Company/mn | 33 | 3.200,00 | 1 | |||||
| 2026-01-12 | 13F | World Equity Group, Inc. | 30.266 | 5,68 | 1.318 | 10,03 | ||||
| 2026-02-12 | 13F | Summit Financial, LLC | 7.617 | 332 | ||||||
| 2026-02-17 | 13F | Raymond James Financial Inc | 1.243.665 | 108,84 | 54.149 | 117,54 | ||||
| 2026-02-12 | 13F | Grey Fox Wealth Advisors, LLC | 0 | -100,00 | 0 | |||||
| 2026-01-23 | 13F | Nbt Bank N A /ny | 44 | 6 | ||||||
| 2026-02-06 | 13F | Covestor Ltd | 263 | 4,37 | 0 | |||||
| 2026-01-29 | 13F | Sanctuary Advisors, LLC | 12.366 | 31,19 | 538 | 36,55 | ||||
| 2026-02-13 | 13F | Change Path, LLC | 18.358 | 799 | ||||||
| 2025-11-12 | 13F | Armis Advisers, LLC | 0 | -100,00 | 0 | |||||
| 2026-01-23 | 13F | Ritholtz Wealth Management | 6.944 | 0,43 | 302 | 4,86 | ||||
| 2026-01-23 | 13F | Bellevue Asset Management, Llc | 915 | 0,11 | 40 | 2,63 | ||||
| 2026-02-12 | 13F | Steward Partners Investment Advisory, Llc | 641.506 | 23,97 | 27.931 | 29,14 | ||||
| 2026-01-30 | 13F | Seek First Inc. | 8.261 | 0,44 | 360 | 4,66 | ||||
| 2026-01-09 | 13F | Capital Asset Advisory Services LLC | 1.162.052 | 4,50 | 51.479 | 10,75 | ||||
| 2026-01-26 | 13F | Paradigm Financial Partners, Llc | 64.236 | -0,26 | 2.797 | 3,86 | ||||
| 2026-02-06 | 13F | Axxcess Wealth Management, Llc | 1.157.125 | 4,13 | 50.381 | 8,47 | ||||
| 2026-02-10 | 13F | Savant Capital, LLC | 26.871 | -17,35 | 1.170 | -13,98 | ||||
| 2026-01-21 | 13F | Modera Wealth Management, LLC | 9.832 | 0,00 | 428 | 4,39 | ||||
| 2026-02-10 | 13F | American Money Management, LLC | 9.380 | -1,54 | 408 | 2,51 | ||||
| 2025-11-06 | 13F | Western Wealth Management, LLC | 0 | -100,00 | 0 | |||||
| 2026-02-17 | 13F | Ameriprise Financial Inc | 6.558 | 3,96 | 286 | 8,37 | ||||
| 2026-02-17 | 13F | Qube Research & Technologies Ltd | 34 | 1 | ||||||
| 2025-11-14 | 13F | Citadel Advisors Llc | 0 | -100,00 | 0 | |||||
| 2026-02-11 | 13F | Greykasell Wealth Strategies, Inc. | 7.588 | 0,00 | 330 | 4,10 | ||||
| 2026-02-10 | 13F | REAP Financial Group, LLC | 222 | 0,00 | 10 | 0,00 | ||||
| 2026-02-06 | 13F | IFP Advisors, Inc | 13.222 | -0,80 | 576 | 3,23 | ||||
| 2026-02-13 | 13F | Mariner, LLC | 150.745 | 6.563 | ||||||
| 2026-02-06 | 13F | Empirical Asset Management, LLC | 6.629 | 289 | ||||||
| 2026-02-17 | 13F | VestGen Advisors, LLC | 62.686 | -61,34 | 2.729 | -59,73 | ||||
| 2026-01-12 | 13F | Moody National Bank Trust Division | 46.177 | 0,00 | 2.011 | 4,15 | ||||
| 2026-01-14 | 13F | Hennion & Walsh Asset Management, Inc. | 1.259.777 | 3,15 | 54.851 | 7,44 | ||||
| 2026-01-30 | 13F | SK Wealth Management, LLC | 990.476 | 500,06 | 44.928 | 551,68 | ||||
| 2026-02-12 | 13F | Financial Engines Advisors L.L.C. | 13.658 | 13,38 | 595 | 18,09 | ||||
| 2026-01-26 | 13F | AE Wealth Management LLC | 8.852 | -5,12 | 385 | -1,28 | ||||
| 2026-02-12 | 13F | Great Valley Advisor Group, Inc. | 10.142 | 51,22 | 442 | 57,50 | ||||
| 2026-01-21 | 13F | Crux Wealth Advisors | 10.916 | -22,22 | 475 | -18,94 | ||||
| 2026-02-13 | 13F | Baird Financial Group, Inc. | 139.441 | 0,77 | 6.071 | 4,98 | ||||
| 2026-01-16 | 13F | Oregon Pacific Wealth Management, LLC | 12.166 | 61,22 | 530 | 67,94 | ||||
| 2025-10-08 | 13F | Beacon Financial Group | 9.689 | 0,00 | 405 | 5,47 | ||||
| 2026-02-10 | 13F/A | Northwestern Mutual Wealth Management Co | 1.821 | -11,90 | 79 | -8,14 | ||||
| 2026-02-12 | 13F | Jane Street Group, Llc | 20.875 | -93,04 | 909 | -92,76 | ||||
| 2026-02-05 | 13F | Cambridge Investment Research Advisors, Inc. | 179.066 | 15,20 | 8 | 16,67 | ||||
| 2025-11-20 | 13F | Asset Dedication, LLC | 0 | -100,00 | 0 | |||||
| 2026-02-13 | 13F | Glen Eagle Advisors, LLC | 110 | 0,00 | 5 | 0,00 | ||||
| 2026-02-12 | 13F | Commonwealth Equity Services, Llc | 47.744 | 9,33 | 2.079 | 207.700,00 | ||||
| 2026-01-22 | 13F | Comprehensive Money Management Services LLC | 13.367 | 0,00 | 582 | 4,12 | ||||
| 2025-09-26 | 13F | Capital A Wealth Management, LLC | 2.328 | 75 | ||||||
| 2026-02-13 | 13F | Mml Investors Services, Llc | 586.304 | -0,23 | 25.528 | 3,92 | ||||
| 2025-11-13 | 13F | Obsidian Personal Planning Solutions LLC | 5.252 | -3,15 | 220 | 2,33 | ||||
| 2026-02-06 | 13F | Portland Financial Advisors Inc | 6.598 | 0,00 | 287 | 4,36 | ||||
| 2026-01-08 | 13F | Occidental Asset Management, LLC | 99.945 | 0,28 | 4.352 | 4,44 | ||||
| 2026-02-04 | 13F | Pensionmark Financial Group, Llc | 32.416 | -0,37 | 1.411 | 3,83 | ||||
| 2026-01-20 | 13F | Nvwm, Llc | 1.010 | 10.000,00 | 44 | |||||
| 2026-01-30 | 13F | Us Bancorp \de\ | 1.573 | 40,45 | 68 | 47,83 | ||||
| 2026-02-13 | 13F | Stifel Financial Corp | 46.559 | 1,01 | 2.027 | 5,24 | ||||
| 2026-01-29 | 13F | Riverbend Wealth Management, LLC | 6.837 | 298 | ||||||
| 2026-02-11 | 13F | Howard Bailey Securities, Llc | 16.238 | -92,21 | 707 | -91,88 | ||||
| 2026-02-10 | 13F | Evolution Wealth Management Inc. | 14.478 | -0,36 | 630 | 3,79 | ||||
| 2026-02-03 | 13F | RFG Advisory, LLC | 25.402 | 1.106 | ||||||
| 2026-02-17 | 13F | Mercer Global Advisors Inc /adv | 5.124 | 223 | ||||||
| 2026-02-02 | 13F | Truist Financial Corp | 20.233 | 4,42 | 881 | 8,78 | ||||
| 2026-01-29 | 13F | Quest 10 Wealth Builders, Inc. | 0 | -100,00 | 0 | |||||
| 2026-02-13 | 13F | Smartleaf Asset Management LLC | 65.815 | 107.793,44 | 2.873 | 143.550,00 | ||||
| 2026-01-30 | 13F | Simplicity Wealth,LLC | 80.249 | 14,42 | 3.494 | 19,21 | ||||
| 2026-02-19 | 13F | WealthPoint Financial, LLC | 7.175 | 312 | ||||||
| 2026-01-23 | 13F/A | HF Advisory Group, LLC | 27.312 | 0,92 | 1.189 | 5,13 | ||||
| 2026-02-10 | 13F | Envestnet Asset Management Inc | 659.594 | -5,89 | 28.719 | -1,97 | ||||
| 2026-02-13 | 13F | Tcfg Wealth Management, Llc | 29.126 | -12,71 | 1.311 | -6,29 | ||||
| 2026-02-12 | 13F | Principal Securities, Inc. | 0 | -100,00 | 0 | -100,00 | ||||
| 2025-11-07 | 13F | BOK Financial Private Wealth, Inc. | 0 | -100,00 | 0 | |||||
| 2026-02-17 | 13F | Cetera Investment Advisers | 709.217 | 129,16 | 30.879 | 138,71 | ||||
| 2026-02-09 | 13F | Frazier Financial Advisors, LLC | 137.145 | -2,42 | 5.971 | 1,65 | ||||
| 2026-01-30 | 13F | Sigma Planning Corp | 16.372 | -8,81 | 713 | -5,07 | ||||
| 2026-01-20 | 13F | Sheets Smith Wealth Management | 17.071 | 10,69 | 743 | 15,37 | ||||
| 2026-02-13 | 13F | Aptus Capital Advisors, LLC | 1.420 | 62 | ||||||
| 2026-02-10 | 13F | Foundations Investment Advisors, LLC | 8.244 | 0,88 | 359 | 4,99 | ||||
| 2026-02-11 | 13F | Premier Private Wealth Management LLC | 88.698 | 4.049 | ||||||
| 2026-02-06 | 13F | Signature Estate & Investment Advisors Llc | 12.634 | 0,42 | 550 | 4,76 |