Grundlæggende statistik
| Institutionelle aktier (lange) | 35.984.341 - 83,74% (ex 13D/G) - change of -4,36MM shares -10,81% MRQ |
| Institutionel værdi (lang) | $ 264.521 USD ($1000) |
Institutionelt ejerskab og aktionærer
Designer Brands Inc. (US:DBI) har 142 institutionelle ejere og aktionærer, der har indsendt 13D/G- eller 13F-formularer til Securities Exchange Commission (SEC). Disse institutioner har i alt 35,984,341 aktier. Største aktionærer omfatter Stone House Capital Management, LLC, BlackRock, Inc., Charles Schwab Investment Management Inc, Vanguard Group Inc, Dimensional Fund Advisors Lp, Raymond James Financial Inc, Ameriprise Financial Inc, Stone House Capital Management, LLC, American Century Companies Inc, and Arrowstreet Capital, Limited Partnership .
Designer Brands Inc. (NYSE:DBI) institutionel ejerskabsstruktur viser aktuelle positioner i virksomheden efter institutioner og fonde, samt seneste ændringer i positionsstørrelse. Større aktionærer kan omfatte individuelle investorer, investeringsforeninger, hedgefonde eller institutioner. Skema 13D angiver, at investoren besidder (eller besidder) mere end 5 % af virksomheden og har til hensigt (eller har til hensigt at) aktivt at forfølge en ændring i forretningsstrategi. Skema 13G indikerer en passiv investering på over 5%.
The share price as of April 24, 2026 is 8,11 / share. Previously, on April 28, 2025, the share price was 2,86 / share. This represents an increase of 183,57% over that period.

Fondens stemningsscore
Fund Sentiment Score (fka Ownership Accumulation Score) finder de aktier, der bliver mest købt af fonde. Det er resultatet af en sofistikeret, multi-faktor kvantitativ model, der identificerer virksomheder med de højeste niveauer af institutionel akkumulering. Scoringsmodellen bruger en kombination af den samlede stigning i oplyste ejere, ændringerne i porteføljeallokeringer i disse ejere og andre målinger. Tallet går fra 0 til 100, hvor højere tal indikerer et højere niveau af akkumulering for sine jævnaldrende, og 50 er gennemsnittet.
Opdateringsfrekvens: Dagligt
Se Ownership Explorer, som giver en liste over højest rangerende virksomheder.
AI+ Ask Fintel’s AI assistant about Designer Brands Inc..
Select a question to share a public post with an AI-crafted answer.
Thinking of good questions…
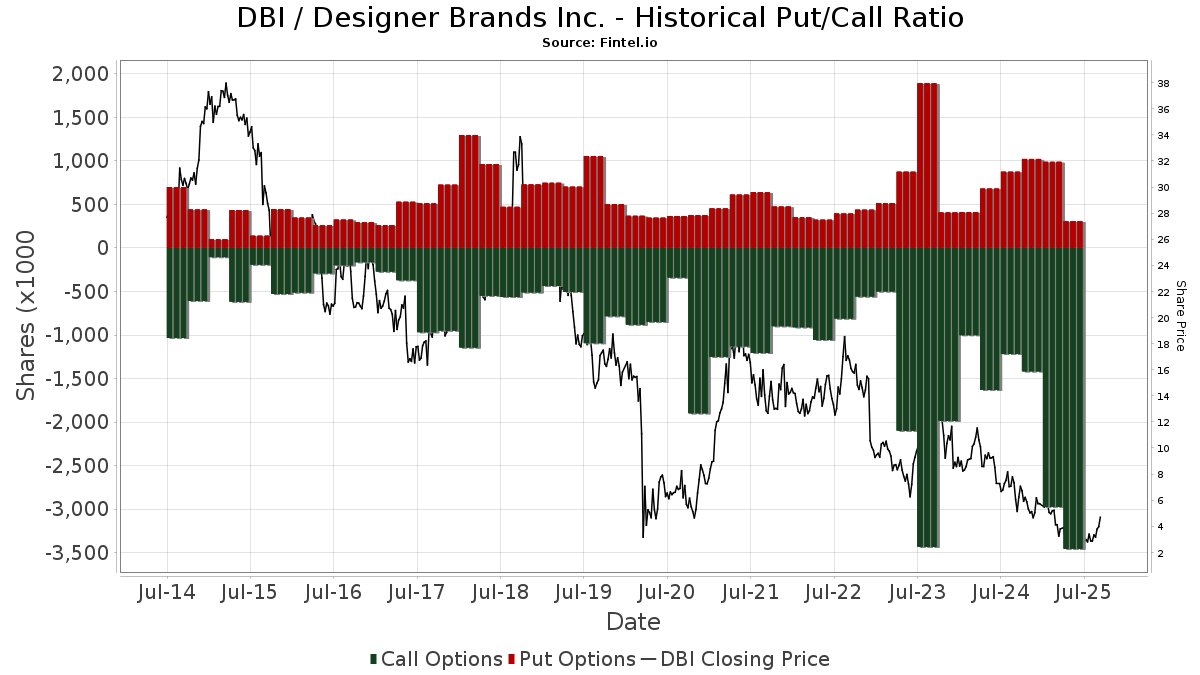
Institutionel Put/Call-forhold
Ud over at indberette standardaktie- og gældsudstedelser skal institutter med mere end 100 mill. aktiver under forvaltning også oplyse deres put- og call-optionsbeholdninger. Da salgsoptioner generelt indikerer negativ stemning, og købsoptioner indikerer positiv stemning, kan vi få en fornemmelse af den overordnede institutionelle stemning ved at plotte forholdet mellem put og kald. Diagrammet til højre viser det historiske put/call-forhold for dette instrument.
Brug af Put/Call Ratio som en indikator for investorernes stemning overvinder en af de vigtigste mangler ved at bruge totalt institutionelt ejerskab, som er, at en betydelig mængde af aktiver under forvaltning investeres passivt for at spore indekser. Passivt forvaltede fonde køber typisk ikke optioner, så indikatoren for put/call-forholdet følger mere nøje følelsen af aktivt forvaltede fonde.
13D/G-arkivering
Vi præsenterer 13D/G ansøgninger separat fra 13F ansøgninger på grund af den forskellige behandling af SEC. 13D/G-ansøgninger kan indgives af grupper af investorer (med én ledende), hvorimod 13F-ansøgninger ikke kan. Dette resulterer i situationer, hvor en investor kan indsende en 13D/G, der rapporterer én værdi for de samlede aktier (der repræsenterer alle de aktier, der ejes af investorgruppen), men derefter indsender en 13F, der rapporterer en anden værdi for de samlede aktier (der udelukkende repræsenterer deres egne) ejendomsret). Det betyder, at aktieejerskab af 13D/G-arkiver og 13F-arkiveringer ofte ikke er direkte sammenlignelige, så vi præsenterer dem separat.
Bemærk: Fra den 16. maj 2021 viser vi ikke længere ejere, der ikke har indsendt en 13D/G inden for det seneste år. Tidligere viste vi den fulde historie af 13D/G-arkiver. Generelt skal enheder, der er forpligtet til at indgive 13D/G-ansøgninger, indgive mindst årligt, før de indsender en afsluttende ansøgning. Dog forlader fonde nogle gange positioner uden at indsende en afsluttende ansøgning (dvs. de afvikler), så visning af den fulde historie resulterede nogle gange i forvirring om det nuværende ejerskab. For at undgå forvirring viser vi nu kun 'aktuelle' ejere - det vil sige - ejere, der har anmeldt inden for det seneste år.
Upgrade to unlock premium data.
| Fil dato | Form | Investor | Forrige Aktier |
Seneste Aktier |
Δ Aktier (Procent) |
Ejendomsret (Procent) |
Δ Ejerskab (Procent) |
|
|---|---|---|---|---|---|---|---|---|
| 2026-01-30 | VANGUARD GROUP INC | 2,111,443 | 2,016,431 | -4.50 | 4.81 | -8.21 | ||
| 2025-10-17 | BlackRock, Inc. | 3,517,829 | 2,660,397 | -24.37 | 6.40 | -13.51 | ||
| 2025-10-09 | DIMENSIONAL FUND ADVISORS LP | 2,754,126 | 1,937,413 | -29.65 | 4.70 | -18.97 | ||
| 2025-08-14 | Fund 1 Investments, LLC | 2,485,665 | 1,000,000 | -59.77 | 2.43 | -60.68 | ||
| 2025-05-15 | Stone House Capital Management, LLC | 5,000,000 | 7,000,000 | 40.00 | 17.40 | 40.32 |
13F og NPORT arkivering
Detaljer om 13F-arkivering er gratis. Detaljer om NP-ansøgninger kræver et premium-medlemskab. Grønne rækker angiver nye positioner. Røde rækker angiver lukkede positioner. Klik på linket ikon for at se den fulde transaktionshistorik.
Opgrader
for at låse premium-data op og eksportere til Excel ![]() .
.
| Fil dato | Kilde | Investor | Type | Gennemsnitlig pris (Øst) |
Aktier | Δ Aktier (%) |
Rapporteret Værdi ($1000) |
Δ Værdi (%) |
Port Alloc (%) |
|
|---|---|---|---|---|---|---|---|---|---|---|
| 2026-01-30 | 13F | Torren Management, LLC | 2 | 0 | ||||||
| 2025-11-14 | 13F | Susquehanna International Group, Llp | 0 | -100,00 | 0 | -100,00 | ||||
| 2026-02-09 | 13F | Hartland & Co., LLC | 0 | -100,00 | 0 | |||||
| 2026-02-17 | 13F | Price T Rowe Associates Inc /md/ | 56.887 | 9,61 | 0 | |||||
| 2025-11-14 | 13F | Dark Forest Capital Management Lp | 171.230 | 0,00 | 408 | 0,00 | ||||
| 2026-02-17 | 13F | Fmr Llc | 38.892 | -2,37 | 289 | 104,26 | ||||
| 2026-02-09 | 13F | Keating Financial Advisory Services, Inc. | 300 | 2 | ||||||
| 2026-02-17 | 13F | Cetera Investment Advisers | 34.728 | 258 | ||||||
| 2026-02-17 | 13F | Advisor Group Holdings, Inc. | 10.284 | 3.282,89 | 76 | 7.500,00 | ||||
| 2026-02-17 | 13F | Graham Capital Management, L.P. | 34.077 | -21,40 | 253 | 65,36 | ||||
| 2026-02-13 | 13F | Great West Life Assurance Co /can/ | 0 | -100,00 | 0 | |||||
| 2026-01-22 | 13F | Yarger Wealth Strategies, Llc | 446.690 | -40,99 | 3.319 | 23,85 | ||||
| 2026-02-17 | 13F/A | RBF Capital, LLC | 45.195 | 0,00 | 336 | 110,69 | ||||
| 2026-02-17 | 13F | Trexquant Investment LP | 189.503 | 1.408 | ||||||
| 2026-02-13 | 13F | Headlands Technologies LLC | 19.427 | 144 | ||||||
| 2026-04-22 | 13F | Sterling Capital Management LLC | 1.106 | -42,61 | 6 | -57,14 | ||||
| 2026-02-17 | 13F | Canada Pension Plan Investment Board | 0 | -100,00 | 0 | |||||
| 2026-02-13 | 13F | American Century Companies Inc | 1.300.460 | 9,34 | 9.662 | 129,50 | ||||
| 2026-02-04 | 13F | Pacific Ridge Capital Partners, LLC | 161.465 | -7,72 | 1.200 | 93,70 | ||||
| 2026-02-13 | 13F | Pinnacle Wealth Planning Services, Inc. | 2.449 | 18 | ||||||
| 2026-01-12 | 13F | Rialto Wealth Management, LLC | 182 | 0,00 | 1 | |||||
| 2026-03-03 | 13F/A | Caitong International Asset Management Co., Ltd | 2.587 | 19 | ||||||
| 2026-02-10 | 13F | Bnp Paribas Arbitrage, Sa | 231.690 | 2.637,03 | 1.721 | 5.834,48 | ||||
| 2026-02-17 | 13F | Optiver Holding B.V. | 561 | 0,00 | 4 | 300,00 | ||||
| 2026-02-11 | 13F | Metis Global Partners, LLC | 48.478 | 0,00 | 360 | 110,53 | ||||
| 2026-02-13 | 13F | Police & Firemen's Retirement System of New Jersey | 8.611 | 0,00 | 64 | 110,00 | ||||
| 2026-02-17 | 13F | Public Employees Retirement System Of Ohio | 51.968 | 1,06 | 386 | 112,09 | ||||
| 2026-02-17 | 13F | Millennium Management Llc | 45.085 | -94,11 | 335 | -87,67 | ||||
| 2026-04-21 | 13F | PharVision Advisers, LLC | 0 | -100,00 | 0 | |||||
| 2026-02-17 | 13F | Ameriprise Financial Inc | 1.508.376 | 1,39 | 11.207 | 112,82 | ||||
| 2026-02-11 | 13F | Barrow Hanley Mewhinney & Strauss Llc | 600 | 0,00 | 4 | 100,00 | ||||
| 2026-02-05 | 13F | Allworth Financial LP | 45 | 309,09 | 0 | |||||
| 2026-02-13 | 13F | Arrowstreet Capital, Limited Partnership | 1.170.294 | -17,40 | 8.695 | 73,38 | ||||
| 2026-02-17 | 13F | Occudo Quantitative Strategies Lp | 10.835 | 81 | ||||||
| 2026-02-06 | 13F | Global Retirement Partners, LLC | 408 | 0,00 | 3 | 200,00 | ||||
| 2026-02-13 | 13F | Charles Schwab Investment Management Inc | 2.185.825 | 28,45 | 16.241 | 169,63 | ||||
| 2026-04-08 | 13F | Oliver Luxxe Assets LLC | 34.700 | 0,00 | 197 | -23,35 | ||||
| 2025-11-14 | 13F | Nomura Holdings Inc | 0 | -100,00 | 0 | |||||
| 2025-11-14 | 13F | National Bank Of Canada /fi/ | 0 | -100,00 | 0 | |||||
| 2026-02-17 | 13F | Susquehanna Portfolio Strategies, LLC | 29.401 | 0,00 | 218 | 109,62 | ||||
| 2025-11-04 | 13F | Principal Financial Group Inc | 0 | -100,00 | 0 | -100,00 | ||||
| 2026-04-03 | 13F | Investors Research Corp | 17.517 | 0,00 | 100 | -23,85 | ||||
| 2026-02-10 | 13F | Goldman Sachs Group Inc | 779.569 | 158,45 | 5.792 | 442,83 | ||||
| 2026-02-17 | 13F | Citadel Advisors Llc | 146.786 | 594,88 | 1.091 | 1.372,97 | ||||
| 2026-02-17 | 13F | Citadel Advisors Llc | Call | 152.800 | 16,82 | 1.135 | 145,14 | |||
| 2026-02-13 | 13F | SRS Capital Advisors, Inc. | 6 | -99,93 | 0 | -100,00 | ||||
| 2026-02-17 | 13F | Citadel Advisors Llc | Put | 14.500 | -86,54 | 108 | -71,92 | |||
| 2025-11-14 | 13F | Engineers Gate Manager LP | 0 | -100,00 | 0 | |||||
| 2025-11-12 | 13F | Victory Capital Management Inc | 0 | -100,00 | 0 | |||||
| 2025-11-10 | 13F | MAI Capital Management | 0 | -100,00 | 0 | |||||
| 2026-02-17 | 13F | Susquehanna International Group, Llp | Put | 92.100 | 48,55 | 684 | 212,33 | |||
| 2026-02-17 | 13F | Tower Research Capital LLC (TRC) | 891 | -83,57 | 7 | -68,42 | ||||
| 2026-02-17 | 13F | Susquehanna International Group, Llp | Call | 344.900 | 52,41 | 2.563 | 219,85 | |||
| 2026-02-11 | 13F | Empowered Funds, LLC | 314.738 | 10,72 | 2.339 | 132,41 | ||||
| 2026-02-12 | 13F | BlackRock, Inc. | 2.816.914 | 2,79 | 20.930 | 115,74 | ||||
| 2026-02-17 | 13F | Kemnay Advisory Services Inc. | 12.003 | 89 | ||||||
| 2025-11-06 | 13F | Lsv Asset Management | 0 | -100,00 | 0 | |||||
| 2026-02-17 | 13F | Two Sigma Advisers, Lp | 784.484 | 18,45 | 5.829 | 148,63 | ||||
| 2025-11-13 | 13F | Public Employees Retirement Association Of Colorado | 0 | -100,00 | 0 | |||||
| 2026-02-06 | 13F | Bare Financial Services, Inc | 0 | -100,00 | 0 | |||||
| 2026-02-17 | 13F | Russell Investments Group, Ltd. | 19.899 | -67,74 | 148 | -32,57 | ||||
| 2026-04-16 | 13F | SG Americas Securities, LLC | 0 | -100,00 | 0 | |||||
| 2026-04-24 | 13F | UMA Financial Services, Inc. | 0 | -100,00 | 0 | |||||
| 2026-02-11 | 13F | LPL Financial LLC | 11.912 | -60,15 | 89 | -16,19 | ||||
| 2026-02-17 | 13F | Alliancebernstein L.p. | 32.320 | -41,90 | 240 | 22,45 | ||||
| 2026-02-10 | 13F | State of Wyoming | 71.228 | 529 | ||||||
| 2026-02-11 | 13F | Simplex Trading, Llc | Put | 140.800 | 871,03 | 1.046 | ||||
| 2026-02-11 | 13F | Simplex Trading, Llc | 248.744 | 220,45 | 1.848 | |||||
| 2026-04-07 | 13F | Estate Planners Group, LLC | 95 | 1 | ||||||
| 2026-02-11 | 13F | Simplex Trading, Llc | Call | 18.100 | -72,53 | 134 | ||||
| 2026-02-10 | 13F | Intech Investment Management Llc | 13.210 | -10,34 | 98 | 88,46 | ||||
| 2026-02-06 | 13F | Pnc Financial Services Group, Inc. | 10.203 | 0,06 | 76 | 108,33 | ||||
| 2026-02-13 | 13F | Panagora Asset Management Inc | 0 | -100,00 | 0 | |||||
| 2026-02-06 | 13F | Gsa Capital Partners Llp | 0 | -100,00 | 0 | |||||
| 2026-04-23 | 13F | SJS Investment Consulting Inc. | 137 | -31,50 | 1 | -100,00 | ||||
| 2026-02-13 | 13F | Citigroup Inc | 960 | -67,09 | 7 | -30,00 | ||||
| 2026-02-12 | 13F | Renaissance Technologies Llc | 274.800 | 2.042 | ||||||
| 2026-01-15 | 13F | Nisa Investment Advisors, Llc | 514 | 0,00 | 4 | 200,00 | ||||
| 2026-02-13 | 13F | C M Bidwell & Associates Ltd | 101 | 1 | ||||||
| 2026-02-17 | 13F | D. E. Shaw & Co., Inc. | 849.479 | 72,58 | 6.312 | 262,28 | ||||
| 2026-02-17 | 13F | State Of Wisconsin Investment Board | 111.500 | 828 | ||||||
| 2026-02-13 | 13F | Barclays Plc | 53.446 | 15,66 | 397 | 143,56 | ||||
| 2026-02-17 | 13F | Odyssean, LLC | 21.561 | 160 | ||||||
| 2025-11-05 | 13F | Bessemer Group Inc | 0 | -100,00 | 0 | |||||
| 2026-04-13 | 13F | IFP Advisors, Inc | 5 | 0,00 | 0 | |||||
| 2026-02-04 | 13F | Bailard, Inc. | 0 | -100,00 | 0 | |||||
| 2026-02-09 | 13F | Geode Capital Management, Llc | 823.792 | -1,44 | 6.123 | 106,89 | ||||
| 2026-01-27 | 13F | Keeler & Nadler Financial Planning & Wealth Management | 19.166 | 0,00 | 142 | 111,94 | ||||
| 2026-02-13 | 13F | Verition Fund Management LLC | 212.252 | 30,86 | 1.577 | 174,74 | ||||
| 2026-02-17 | 13F | Prelude Capital Management, Llc | 37.000 | 0,00 | 275 | 110,77 | ||||
| 2026-02-11 | 13F | Ameritas Investment Partners, Inc. | 2.771 | 21 | ||||||
| 2026-02-17 | 13F | XTX Topco Ltd | 151.633 | -15,09 | 1.127 | 78,16 | ||||
| 2026-02-13 | 13F | Walleye Trading LLC | Call | 51.900 | -26,69 | 386 | 54,00 | |||
| 2026-01-29 | 13F | UBS Group AG | 1.075.167 | 61,97 | 7.988 | 240,06 | ||||
| 2026-02-13 | 13F | Walleye Trading LLC | Put | 1.700 | -97,36 | 13 | -94,71 | |||
| 2025-11-13 | 13F | Marshall Wace, Llp | 0 | -100,00 | 0 | |||||
| 2026-01-16 | 13F | FNY Investment Advisers, LLC | 0 | -100,00 | 0 | |||||
| 2026-02-12 | 13F | Dimensional Fund Advisors Lp | 1.807.814 | -6,69 | 13.435 | 95,89 | ||||
| 2026-02-17 | 13F | Two Sigma Securities, Llc | 0 | -100,00 | 0 | |||||
| 2026-02-17 | 13F | Bank Of America Corp /de/ | 150.145 | -41,94 | 1.116 | 21,86 | ||||
| 2026-02-13 | 13F | State Street Corp | 918.978 | -4,15 | 6.828 | 101,24 | ||||
| 2026-02-13 | 13F | Divisadero Street Capital Management, LP | 0 | -100,00 | 0 | |||||
| 2026-02-12 | 13F | Nuveen, LLC | 101.339 | 0,00 | 753 | 110,06 | ||||
| 2025-11-14 | 13F | Squarepoint Ops LLC | Call | 0 | -100,00 | 0 | -100,00 | |||
| 2026-02-17 | 13F | Tudor Investment Corp Et Al | 227.220 | 55,09 | 1.688 | 225,87 | ||||
| 2026-04-10 | 13F | Linden Thomas Advisory Services, LLC | 139.201 | 1,39 | 792 | -22,35 | ||||
| 2026-02-12 | 13F | New York State Common Retirement Fund | 9.455 | 0,00 | 70 | 112,12 | ||||
| 2026-02-13 | 13F | Prudential Financial Inc | 33.097 | -53,70 | 246 | -3,16 | ||||
| 2026-01-26 | 13F | Cwm, Llc | 13.642 | 4,58 | 0 | |||||
| 2026-02-10 | 13F | Bank of New York Mellon Corp | 299.383 | -16,49 | 2.224 | 75,26 | ||||
| 2025-11-14 | 13F | Fund 1 Investments, LLC | Call | 0 | -100,00 | 0 | -100,00 | |||
| 2026-02-13 | 13F | Jacobs Levy Equity Management, Inc | 415.741 | -25,95 | 3.089 | 55,41 | ||||
| 2026-02-17 | 13F | MIRAE ASSET GLOBAL ETFS HOLDINGS Ltd. | 15.637 | -4,25 | 116 | 103,51 | ||||
| 2026-02-13 | 13F | Squarepoint Ops LLC | 33.084 | 72,36 | 246 | 265,67 | ||||
| 2026-02-10 | 13F | Quantbot Technologies LP | 58.176 | 388,92 | 432 | 928,57 | ||||
| 2026-02-17 | 13F | Balyasny Asset Management Llc | 17.078 | 127 | ||||||
| 2025-11-14 | 13F | Cubist Systematic Strategies, LLC | 104.970 | 372 | ||||||
| 2025-11-14 | 13F | Oxford Asset Management Llp | 25.396 | 21,53 | 90 | 17,11 | ||||
| 2026-02-11 | 13F | O'shaughnessy Asset Management, Llc | 42.167 | 313 | ||||||
| 2026-02-17 | 13F | Quantinno Capital Management LP | 12.659 | 94 | ||||||
| 2026-02-03 | 13F | SBI Securities Co., Ltd. | 185 | -3,14 | 1 | |||||
| 2026-03-11 | 13F | Leonteq Securities AG | 0 | -100,00 | 0 | |||||
| 2026-03-06 | 13F | Hsbc Holdings Plc | 14.810 | 115 | ||||||
| 2026-02-04 | 13F | Investors Asset Management Of Georgia Inc /ga/ /adv | 107.439 | -2,71 | 798 | 104,62 | ||||
| 2026-02-12 | 13F | Jane Street Group, Llc | Call | 145.500 | -48,86 | 1.081 | 7,35 | |||
| 2026-02-12 | 13F | Jane Street Group, Llc | 281.089 | 127,14 | 2.088 | 376,71 | ||||
| 2026-02-17 | 13F | Union Square Park Capital Management, LLC | 500.000 | -50,00 | 3.715 | 4,94 | ||||
| 2026-02-13 | 13F | Quarry LP | 4.438 | -52,95 | 33 | -3,03 | ||||
| 2025-11-12 | 13F | Teachers Retirement System Of The State Of Kentucky | 0 | -100,00 | 0 | |||||
| 2026-02-11 | 13F | Jpmorgan Chase & Co | 13.607 | 2,83 | 101 | 119,57 | ||||
| 2026-02-17 | 13F | Susquehanna Fundamental Investments, Llc | 112.674 | -39,89 | 837 | 26,24 | ||||
| 2026-02-06 | 13F | EverSource Wealth Advisors, LLC | 307 | 1,99 | 2 | 100,00 | ||||
| 2026-01-29 | 13F | IMC-Chicago, LLC | Put | 37.700 | -50,13 | 280 | 4,87 | |||
| 2026-01-29 | 13F | IMC-Chicago, LLC | Call | 53.400 | -21,82 | 397 | 64,32 | |||
| 2026-02-17 | 13F | California State Teachers Retirement System | 2.058 | -32,46 | 15 | 50,00 | ||||
| 2026-02-17 | 13F | Boothbay Fund Management, Llc | 62.517 | 390,60 | 465 | 931,11 | ||||
| 2026-04-06 | 13F | GAMMA Investing LLC | 166 | 1 | ||||||
| 2026-02-20 | 13F | Sunbelt Securities, Inc. | 9 | -99,10 | 0 | -100,00 | ||||
| 2026-02-13 | 13F | Wells Fargo & Company/mn | 49.778 | 53,21 | 370 | 220,87 | ||||
| 2026-02-17 | 13F | Royal Bank Of Canada | 946 | -99,68 | 7 | -99,34 | ||||
| 2026-04-13 | 13F | True Wealth Design, LLC | 215 | 0,00 | 1 | 0,00 | ||||
| 2026-02-12 | 13F | CIBC Private Wealth Group, LLC | 500 | 0,00 | 4 | 200,00 | ||||
| 2026-02-17 | 13F | Aqr Capital Management Llc | 269.838 | -23,64 | 2.005 | 60,32 | ||||
| 2026-01-29 | 13F | Vanguard Group Inc | 2.016.431 | -6,25 | 14.982 | 96,77 | ||||
| 2026-02-09 | 13F | Legal & General Group Plc | 2.836 | 0,00 | 21 | 110,00 | ||||
| 2026-02-10 | 13F | Rothschild Investment Llc | 2 | 0 | ||||||
| 2026-02-13 | 13F | Sei Investments Co | 16.765 | 0,00 | 125 | 110,17 | ||||
| 2026-02-10 | 13F | Acadian Asset Management Llc | 7.823 | 0 | ||||||
| 2026-02-17 | 13F | Jain Global LLC | 0 | -100,00 | 0 | |||||
| 2026-04-07 | 13F | Signaturefd, Llc | 392 | 2 | ||||||
| 2026-02-13 | 13F | Manufacturers Life Insurance Company, The | 10.463 | 78 | ||||||
| 2026-02-12 | 13F | Jane Street Group, Llc | Put | 0 | -100,00 | 0 | -100,00 | |||
| 2025-11-17 | 13F | GWM Advisors LLC | 0 | -100,00 | 0 | |||||
| 2026-02-17 | 13F | Northern Trust Corp | 282.948 | -6,83 | 2.102 | 95,53 | ||||
| 2026-02-11 | 13F | Los Angeles Capital Management Llc | 36.550 | 129 | ||||||
| 2026-02-11 | 13F | Deutsche Bank Ag\ | 69.425 | -13,04 | 516 | 82,62 | ||||
| 2026-02-13 | 13F | Walleye Capital LLC | Call | 26.100 | -75,35 | 194 | -48,40 | |||
| 2026-02-13 | 13F | Walleye Capital LLC | Put | 27.200 | -51,94 | 202 | 1,00 | |||
| 2026-02-17 | 13F | Raymond James Financial Inc | 1.622.528 | -24,92 | 12.055 | 57,60 | ||||
| 2026-01-23 | 13F | Cura Wealth Advisors, Llc | 14.252 | 0,00 | 106 | 110,00 | ||||
| 2026-02-17 | 13F | EJF Capital LLC | 97.000 | 0,00 | 721 | 109,91 | ||||
| 2026-04-23 | 13F | TFC Financial Management | 15.570 | 0,00 | 89 | -23,48 | ||||
| 2025-11-14 | 13F | J. Goldman & Co LP | 0 | -100,00 | 0 | -100,00 | ||||
| 2026-02-11 | 13F | Allianz Asset Management GmbH | 594.865 | 41,77 | 4.420 | 197,58 | ||||
| 2026-01-08 | 13F | Gryphon Financial Partners LLC | 23.620 | 0,00 | 175 | 110,84 | ||||
| 2026-02-17 | 13F | Two Sigma Investments, Lp | 960.798 | 42,50 | 7.139 | 199,16 | ||||
| 2026-02-11 | 13F | Group One Trading, L.p. | Put | 69.200 | -28,51 | 514 | 50,29 | |||
| 2026-02-13 | 13F | Rhumbline Advisers | 73.549 | -17,75 | 546 | 72,78 | ||||
| 2026-02-11 | 13F | Group One Trading, L.p. | 660.731 | 20,56 | 4.909 | 153,04 | ||||
| 2026-02-11 | 13F | Group One Trading, L.p. | Call | 354.500 | 1.118,21 | 2.634 | 2.456,31 | |||
| 2026-02-13 | 13F | Morgan Stanley | 228.036 | 25,51 | 1.694 | 163,45 | ||||
| 2026-02-13 | 13F/A | Texas Permanent School Fund | 0 | -100,00 | 0 | |||||
| 2026-02-13 | 13F | Walleye Capital LLC | 261.114 | 186,16 | 1.940 | 500,62 | ||||
| 2026-02-11 | 13F | Franklin Resources Inc | 11.342 | 84 | ||||||
| 2026-02-12 | 13F | MetLife Investment Management, LLC | 13.219 | 98 | ||||||
| 2026-02-17 | 13F | Jones Financial Companies Lllp | 7.865 | 293,25 | 58 | 728,57 | ||||
| 2026-04-20 | 13F | Ritholtz Wealth Management | 19.486 | -31,81 | 111 | -48,11 | ||||
| 2026-02-12 | 13F | Hrt Financial Lp | 0 | -100,00 | 0 | |||||
| 2026-01-20 | 13F | Harbor Capital Advisors, Inc. | 1.127 | 23,30 | 0 | |||||
| 2026-02-09 | 13F | Huntington National Bank | 1 | 0,00 | 0 | |||||
| 2026-02-17 | 13F | Bridgeway Capital Management Inc | 472.238 | -13,55 | 3.509 | 81,48 | ||||
| 2026-02-19 | 13F | Invesco Ltd. | 268.073 | -7,90 | 1.992 | 93,30 | ||||
| 2026-04-06 | 13F | Versant Capital Management, Inc | 153 | 1 | ||||||
| 2026-02-17 | 13F | Stone House Capital Management, LLC | 5.500.000 | 0,00 | 40.865 | 109,89 | ||||
| 2025-11-14 | 13F | Atom Investors LP | 0 | -100,00 | 0 | |||||
| 2026-04-15 | 13F | FNY Investment Advisers, LLC | Put | 0 | -100,00 | 0 | ||||
| 2026-02-10 | 13F | Axq Capital, Lp | 18.287 | 136 | ||||||
| 2025-11-14 | 13F | State Board Of Administration Of Florida Retirement System | 0 | -100,00 | 0 | |||||
| 2025-11-14 | 13F | Wolverine Trading, Llc | 72.900 | 11,83 | 261 | 62,50 | ||||
| 2026-02-13 | 13F | Walleye Trading LLC | 0 | -100,00 | 0 | -100,00 | ||||
| 2025-11-14 | 13F | Wolverine Trading, Llc | Call | 166.200 | -11,92 | 595 | 28,02 | |||
| 2025-11-14 | 13F | Wolverine Trading, Llc | Put | 28.400 | 102 | |||||
| 2026-02-05 | 13F | Amalgamated Bank | 1.050 | -38,70 | 0 | |||||
| 2026-02-17 | 13F | Stone House Capital Management, LLC | Call | 1.500.000 | 0,00 | 11.145 | 109,89 | |||
| 2025-11-10 | 13F | Dana Investment Advisors, Inc. | 0 | -100,00 | 0 | -100,00 |
Other Listings
| DE:D9W | 6,85 € |