Grundlæggende statistik
| Institutionelle ejere | 107 total, 107 long only, 0 short only, 0 long/short - change of 16,13% MRQ |
| Gennemsnitlig porteføljeallokering | 0.4752 % - change of 0,33% MRQ |
| Institutionelle aktier (lange) | 6.618.072 (ex 13D/G) - change of 1,28MM shares 23,88% MRQ |
| Institutionel værdi (lang) | $ 326.320 USD ($1000) |
Institutionelt ejerskab og aktionærer
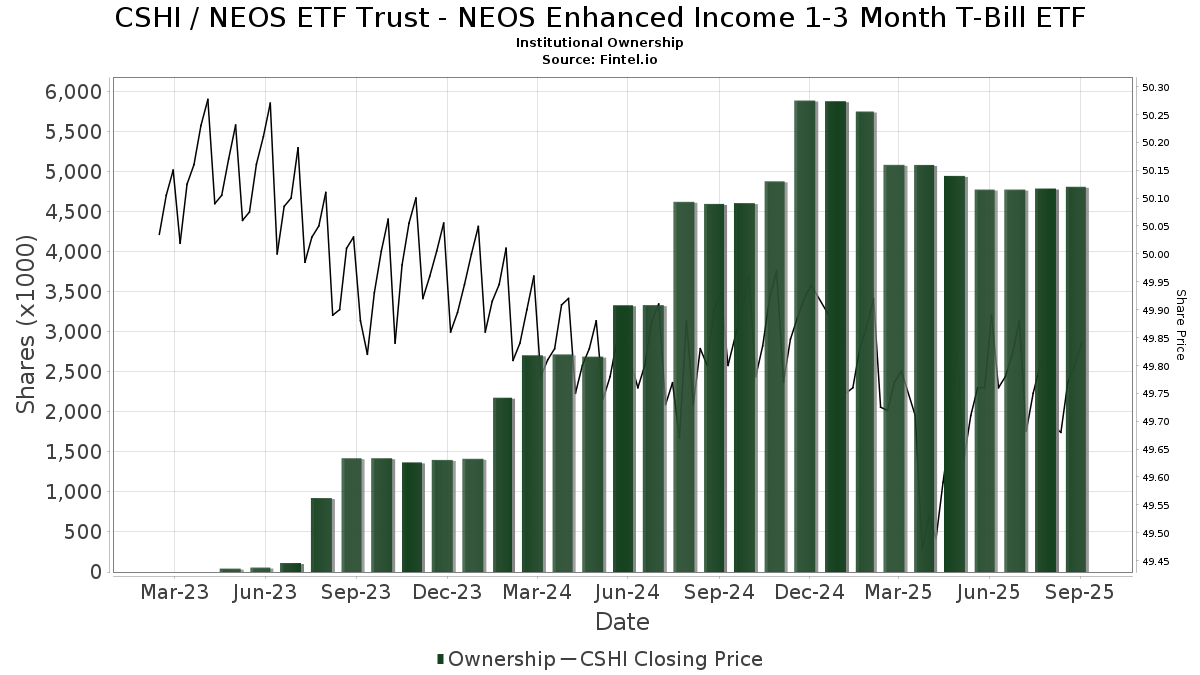
NEOS ETF Trust - NEOS Enhanced Income 1-3 Month T-Bill ETF (US:CSHI) har 107 institutionelle ejere og aktionærer, der har indsendt 13D/G- eller 13F-formularer til Securities Exchange Commission (SEC). Disse institutioner har i alt 6,618,072 aktier. Største aktionærer omfatter Richard P Slaughter Associates Inc, Gradient Investments LLC, Commonwealth Equity Services, Llc, Atticus Wealth Management, Llc, Arkadios Wealth Advisors, LPL Financial LLC, MADDEN SECURITIES Corp, Retirement Planning Group, Gainplan LLC, and Grantvest Financial Group LLC .
NEOS ETF Trust - NEOS Enhanced Income 1-3 Month T-Bill ETF (ARCA:CSHI) institutionel ejerskabsstruktur viser aktuelle positioner i virksomheden efter institutioner og fonde, samt seneste ændringer i positionsstørrelse. Større aktionærer kan omfatte individuelle investorer, investeringsforeninger, hedgefonde eller institutioner. Skema 13D angiver, at investoren besidder (eller besidder) mere end 5 % af virksomheden og har til hensigt (eller har til hensigt at) aktivt at forfølge en ændring i forretningsstrategi. Skema 13G indikerer en passiv investering på over 5%.
The share price as of February 27, 2026 is 49,69 / share. Previously, on March 3, 2025, the share price was 49,72 / share. This represents a decline of 0,06% over that period.
Fondens stemningsscore
Fund Sentiment Score (fka Ownership Accumulation Score) finder de aktier, der bliver mest købt af fonde. Det er resultatet af en sofistikeret, multi-faktor kvantitativ model, der identificerer virksomheder med de højeste niveauer af institutionel akkumulering. Scoringsmodellen bruger en kombination af den samlede stigning i oplyste ejere, ændringerne i porteføljeallokeringer i disse ejere og andre målinger. Tallet går fra 0 til 100, hvor højere tal indikerer et højere niveau af akkumulering for sine jævnaldrende, og 50 er gennemsnittet.
Opdateringsfrekvens: Dagligt
Se Ownership Explorer, som giver en liste over højest rangerende virksomheder.
AI+ Ask Fintel’s AI assistant about NEOS ETF Trust - NEOS Enhanced Income 1-3 Month T-Bill ETF.
Select a question to share a public post with an AI-crafted answer.
Thinking of good questions…
Institutionel Put/Call-forhold
Ud over at indberette standardaktie- og gældsudstedelser skal institutter med mere end 100 mill. aktiver under forvaltning også oplyse deres put- og call-optionsbeholdninger. Da salgsoptioner generelt indikerer negativ stemning, og købsoptioner indikerer positiv stemning, kan vi få en fornemmelse af den overordnede institutionelle stemning ved at plotte forholdet mellem put og kald. Diagrammet til højre viser det historiske put/call-forhold for dette instrument.
Brug af Put/Call Ratio som en indikator for investorernes stemning overvinder en af de vigtigste mangler ved at bruge totalt institutionelt ejerskab, som er, at en betydelig mængde af aktiver under forvaltning investeres passivt for at spore indekser. Passivt forvaltede fonde køber typisk ikke optioner, så indikatoren for put/call-forholdet følger mere nøje følelsen af aktivt forvaltede fonde.
13F og NPORT arkivering
Detaljer om 13F-arkivering er gratis. Detaljer om NP-ansøgninger kræver et premium-medlemskab. Grønne rækker angiver nye positioner. Røde rækker angiver lukkede positioner. Klik på linket ikon for at se den fulde transaktionshistorik.
Opgrader
for at låse premium-data op og eksportere til Excel ![]() .
.
| Fil dato | Kilde | Investor | Type | Gennemsnitlig pris (Øst) |
Aktier | Δ Aktier (%) |
Rapporteret Værdi ($1000) |
Δ Værdi (%) |
Port Alloc (%) |
|
|---|---|---|---|---|---|---|---|---|---|---|
| 2026-02-13 | 13F | Inspire Advisors, LLC | 50.012 | 23,66 | 2.487 | 23,73 | ||||
| 2025-11-14 | 13F | Flow Traders U.s. Llc | 0 | -100,00 | 0 | |||||
| 2026-01-08 | 13F | PMV Capital Advisers, LLC | 5.912 | 2,78 | 294 | 2,80 | ||||
| 2026-01-14 | 13F | Global View Capital Management LLC | 40.616 | -37,32 | 2.020 | -37,34 | ||||
| 2026-02-17 | 13F | Brown Financial Advisors | 17.498 | -2,34 | 870 | -2,25 | ||||
| 2025-11-13 | 13F | Fmr Llc | 0 | -100,00 | 0 | |||||
| 2026-02-10 | 13F | Essex Financial Services, Inc. | 7.125 | -34,84 | 354 | -34,81 | ||||
| 2026-02-12 | 13F | Triumph Capital Management | 1.000 | -16,67 | 50 | -16,95 | ||||
| 2026-02-12 | 13F | Vistica Wealth Advisors, LLC | 4.586 | 228 | ||||||
| 2026-02-12 | 13F | United Capital Management of KS, Inc. | 0 | -100,00 | 0 | |||||
| 2026-01-15 | 13F | Cannon Advisors, Inc. | 17.525 | -21,53 | 869 | -21,64 | ||||
| 2026-02-09 | 13F | Prospera Financial Services Inc | 17.058 | 848 | ||||||
| 2026-01-22 | 13F | Comprehensive Money Management Services LLC | 11.510 | 65,97 | 572 | 66,28 | ||||
| 2026-02-02 | 13F | WT Wealth Management | 41.768 | 3,13 | 2.077 | 3,18 | ||||
| 2026-02-12 | 13F | Insigneo Advisory Services, Llc | 21.575 | 1.073 | ||||||
| 2026-01-27 | 13F | Able Wealth Management LLC | 129.245 | 13,17 | 6.427 | 13,19 | ||||
| 2026-02-12 | 13F | Commonwealth Equity Services, Llc | 382.975 | 2,86 | 19.045 | 105.705,56 | ||||
| 2026-01-23 | 13F | Farther Finance Advisors, LLC | 39.997 | 367,64 | 1.989 | 368,00 | ||||
| 2026-01-09 | 13F | Dynamic Advisor Solutions LLC | 28.153 | 3,04 | 1.400 | 3,09 | ||||
| 2026-01-15 | 13F | Cherry Creek Investment Advisors, Inc. | 15.467 | 102,85 | 769 | 102,90 | ||||
| 2026-02-12 | 13F | Steward Partners Investment Advisory, Llc | 1.925 | 125,67 | 96 | 126,19 | ||||
| 2026-01-15 | 13F | Paladin Wealth, LLC | 18.044 | -0,03 | 897 | 0,00 | ||||
| 2026-01-26 | 13F | Cwm, Llc | 39.272 | 12,13 | 2 | 0,00 | ||||
| 2026-01-13 | 13F | CoreCap Advisors, LLC | 20.996 | 13,60 | 1.044 | 13,73 | ||||
| 2026-02-12 | 13F | Summit Financial, LLC | 136.156 | -2,69 | 6.771 | -2,66 | ||||
| 2026-01-20 | 13F | Savvy Advisors, Inc. | 6.889 | -50,00 | 343 | -50,07 | ||||
| 2026-02-13 | 13F | Wells Fargo & Company/mn | 1 | 0,00 | 0 | |||||
| 2026-01-29 | 13F | Nbc Securities, Inc. | 5.140 | -2,49 | 256 | -2,67 | ||||
| 2026-01-29 | 13F | Kestra Private Wealth Services, Llc | 5.291 | 263 | ||||||
| 2026-01-29 | 13F | Golden Reserve Retirement LLC | 5.735 | 285 | ||||||
| 2026-02-06 | 13F | Rps Advisory Solutions Llc | 19.697 | 51,29 | 980 | 51,31 | ||||
| 2026-02-05 | 13F | Allworth Financial LP | 10.973 | -5,11 | 546 | -5,22 | ||||
| 2026-02-17 | 13F | Old Mission Capital Llc | 8.089 | -24,14 | 402 | -24,15 | ||||
| 2026-02-12 | 13F | Empire Financial Management Company, LLC | 12.923 | -1,19 | 643 | -1,23 | ||||
| 2026-02-06 | 13F | New Millennium Group LLC | 0 | 0 | ||||||
| 2026-02-17 | 13F | Camarda Financial Advisors, LLC | 0 | -100,00 | 0 | |||||
| 2026-02-02 | 13F | Grantvest Financial Group LLC | 175.792 | 3,70 | 8.742 | 3,71 | ||||
| 2026-01-27 | 13F | Berger Financial Group, Inc | 9.715 | 16,74 | 483 | 16,95 | ||||
| 2026-02-13 | 13F | SRS Capital Advisors, Inc. | 102.140 | 6,06 | 5.054 | 5,60 | ||||
| 2026-02-02 | 13F | Mutual Advisors, LLC | 42.799 | 6,00 | 2.128 | 6,13 | ||||
| 2026-02-10 | 13F | Envestnet Asset Management Inc | 14.375 | 25,45 | 715 | 25,48 | ||||
| 2026-01-23 | 13F | DHJJ Financial Advisors, Ltd. | 410 | 0,00 | 20 | 0,00 | ||||
| 2026-01-26 | 13F | AE Wealth Management LLC | 73 | -8,75 | 4 | 0,00 | ||||
| 2026-02-17 | 13F | Mercer Global Advisors Inc /adv | 37.417 | -33,92 | 1.861 | -33,93 | ||||
| 2026-02-17 | 13F | Gladstone Institutional Advisory LLC | 86.000 | 79,07 | 4.277 | 79,06 | ||||
| 2026-01-27 | 13F | Belpointe Asset Management LLC | 21.744 | 25,61 | 1.081 | 25,70 | ||||
| 2026-01-30 | 13F | Jackson Hole Capital Partners, LLC | 638 | 32 | ||||||
| 2026-01-27 | 13F | Latitude Advisors, LLC | 21.173 | -8,44 | 1.053 | -8,44 | ||||
| 2026-02-13 | 13F | Morgan Stanley | 1.032 | 752,89 | 51 | 750,00 | ||||
| 2026-01-27 | 13F | Krilogy Financial LLC | 5.467 | -18,51 | 271 | -18,62 | ||||
| 2026-02-17 | 13F | IHT Wealth Management, LLC | 4.500 | -10,00 | 224 | -10,08 | ||||
| 2026-02-13 | 13F/A | New England Private Wealth Advisors LLC | 55.931 | 2.781 | ||||||
| 2026-02-02 | 13F | FSA Advisors, Inc. | 110.263 | 24,29 | 5.483 | 24,30 | ||||
| 2026-02-13 | 13F | A4 Wealth Advisors LLC | 4.037 | -39,36 | 201 | -39,58 | ||||
| 2026-02-13 | 13F | Arkadios Wealth Advisors | 343.450 | 17.080 | ||||||
| 2026-02-11 | 13F | Capital Analysts, Inc. | 558 | -1,59 | 0 | |||||
| 2026-01-08 | 13F | Gradient Investments LLC | 481.518 | 4,11 | 23.946 | 4,13 | ||||
| 2026-02-10 | 13F | Impact Partnership Wealth, LLC | 29.754 | 7,71 | 1.480 | 7,72 | ||||
| 2026-02-06 | 13F | Larson Financial Group LLC | 336 | 1,20 | 17 | 0,00 | ||||
| 2026-01-21 | 13F | Flagship Harbor Advisors, Llc | 7.626 | 379 | ||||||
| 2026-01-22 | 13F | Apollon Wealth Management, LLC | 32.495 | 1.616 | ||||||
| 2026-02-11 | 13F | Mattson Financial Services, LLC | 8.851 | 13,01 | 440 | 13,11 | ||||
| 2026-02-03 | 13F | Legacy Wealth Managment, LLC/ID | 20 | -65,52 | 1 | -100,00 | ||||
| 2026-02-17 | 13F | Claro Advisors LLC | 87.000 | 175,55 | 4.326 | 175,72 | ||||
| 2026-02-13 | 13F | Stifel Financial Corp | 62.062 | -13,67 | 3.086 | -13,65 | ||||
| 2026-01-26 | 13F | Nations Financial Group Inc, /ia/ /adv | 5.682 | 0,00 | 283 | 0,00 | ||||
| 2026-02-06 | 13F | Creative Financial Designs Inc /adv | 600 | 0,00 | 30 | 0,00 | ||||
| 2025-11-12 | 13F | First Trust Advisors Lp | 0 | -100,00 | 0 | |||||
| 2026-02-11 | 13F | LPL Financial LLC | 324.970 | 1,25 | 16.161 | 1,26 | ||||
| 2026-02-17 | 13F | Advisor Group Holdings, Inc. | 19.248 | -30,53 | 957 | -30,50 | ||||
| 2025-11-13 | 13F | Summit X, LLC | 0 | -100,00 | 0 | |||||
| 2025-11-12 | 13F | MGB Wealth Management, LLC | 0 | -100,00 | 0 | |||||
| 2026-02-11 | 13F | Parallel Advisors, LLC | 122 | 4,27 | 6 | 20,00 | ||||
| 2026-02-13 | 13F | Mariner, LLC | 10.132 | 504 | ||||||
| 2026-02-03 | 13F | We Are One Seven, LLC | 4.747 | 236 | ||||||
| 2026-02-17 | 13F | Citadel Advisors Llc | 7.065 | -44,58 | 351 | -44,55 | ||||
| 2025-11-21 | 13F/A | Royal Bank Of Canada | 0 | -100,00 | 0 | -100,00 | ||||
| 2026-01-26 | 13F | Private Trust Co Na | 2.000 | 0,00 | 99 | 0,00 | ||||
| 2026-02-05 | 13F | Owen LaRue, LLC | 66.309 | 72,11 | 3.298 | 72,17 | ||||
| 2026-01-29 | 13F | UBS Group AG | 6 | 0 | ||||||
| 2025-11-06 | 13F | Abich Financial Wealth Management LLC | 290 | 14 | ||||||
| 2026-02-05 | 13F | Bright Futures Wealth Management, LLC. | 72.078 | 6,23 | 3.584 | 6,26 | ||||
| 2026-02-18 | 13F | GWM Advisors LLC | 131.896 | 83,02 | 6.559 | 83,06 | ||||
| 2026-02-04 | 13F | MADDEN SECURITIES Corp | 256.030 | 127,86 | 12.732 | 127,89 | ||||
| 2026-01-20 | 13F | Secure Asset Management, LLC | 0 | -100,00 | 0 | |||||
| 2026-01-20 | 13F | Stratos Wealth Partners, LTD. | 162.900 | 1,97 | 8.101 | 1,99 | ||||
| 2026-01-23 | 13F | Gainplan LLC | 183.817 | 2,20 | 9.141 | 2,23 | ||||
| 2026-02-06 | 13F | Global Retirement Partners, LLC | 11.724 | 126,73 | 583 | 126,85 | ||||
| 2026-02-13 | 13F | Mml Investors Services, Llc | 145.554 | 24,23 | 7.238 | 24,26 | ||||
| 2026-01-15 | 13F | RiverTree Advisors, LLC | 34.901 | 1.736 | ||||||
| 2025-10-17 | 13F | Worth Asset Management, LLC | 0 | -100,00 | 0 | |||||
| 2025-11-14 | 13F | Raymond James Financial Inc | 0 | -100,00 | 0 | |||||
| 2026-02-05 | 13F | Cambridge Investment Research Advisors, Inc. | 14.899 | 1 | ||||||
| 2026-01-21 | 13F | Capital Investment Advisory Services, LLC | 135.215 | 6.724 | ||||||
| 2026-01-14 | 13F | Wealthcare Advisory Partners LLC | 54.993 | -20,70 | 2.735 | -20,71 | ||||
| 2026-02-13 | 13F | Carter Financial Group, INC. | 9.432 | 0,33 | 469 | 0,43 | ||||
| 2026-02-09 | 13F | Atticus Wealth Management, Llc | 380.707 | 0,68 | 18.933 | 0,69 | ||||
| 2025-10-30 | 13F | Ridgewood Investments LLC | 0 | -100,00 | 0 | |||||
| 2025-11-05 | 13F | Moloney Securities Asset Management, LLC | 6.375 | 317 | ||||||
| 2025-11-14 | 13F | Ausdal Financial Partners, Inc. | 0 | -100,00 | 0 | |||||
| 2026-01-15 | 13F | SILVER OAK SECURITIES, Inc | 0 | -100,00 | 0 | |||||
| 2026-02-17 | 13F | Equitable Holdings, Inc. | 0 | -100,00 | 0 | |||||
| 2025-11-12 | 13F | Napa Wealth Management | 14.002 | -48,12 | 696 | -48,14 | ||||
| 2026-01-23 | 13F | High Net Worth Advisory Group LLC | 12.500 | 622 | ||||||
| 2026-02-05 | 13F | Mason & Associates Inc | 35.430 | 1.762 | ||||||
| 2026-01-14 | 13F | Redhawk Wealth Advisors, Inc. | 9.248 | 460 | ||||||
| 2026-02-12 | 13F | Brinker Capital Investments, LLC | 33.994 | 1.691 | ||||||
| 2026-02-13 | 13F | Integrated Wealth Concepts LLC | 142.243 | -0,98 | 7.074 | -0,98 | ||||
| 2026-02-12 | 13F | CIBC Private Wealth Group, LLC | 720 | 0,00 | 36 | 0,00 | ||||
| 2026-01-09 | 13F | Tactive Advisors, LLC | 19.267 | 0,19 | 958 | 0,21 | ||||
| 2026-02-17 | 13F | Private Advisor Group, LLC | 45.340 | 129,02 | 2.255 | 129,07 | ||||
| 2026-02-19 | 13F | Atomi Financial Group, Inc. | 157.316 | -1,32 | 7.823 | -1,30 | ||||
| 2026-02-04 | 13F | Pure Financial Advisors, Inc. | 7.690 | 382 | ||||||
| 2026-02-10 | 13F | Verus Capital Partners, Llc | 63.863 | 3.176 | ||||||
| 2026-01-15 | 13F | One + One Wealth Management, Llc | 0 | -100,00 | 0 | |||||
| 2026-02-06 | 13F | HighTower Advisors, LLC | 38.357 | -9,90 | 1.907 | -9,88 | ||||
| 2026-01-30 | 13F | Precision Wealth Strategies, LLC | 125.846 | 18,42 | 6.258 | 18,46 | ||||
| 2026-01-12 | 13F | Richard P Slaughter Associates Inc | 686.860 | 0,81 | 34.158 | 0,83 | ||||
| 2026-02-17 | 13F | Warren Averett Asset Management, LLC | 5.038 | -19,25 | 251 | -19,35 | ||||
| 2026-01-16 | 13F | Heck Capital Advisors, LLC | 24.100 | 56,63 | 1.199 | 56,60 | ||||
| 2026-01-29 | 13F | Ashton Thomas Private Wealth, LLC | 22.425 | 13,22 | 1.115 | 13,31 | ||||
| 2026-02-10 | 13F | Madison Wealth Partners, Inc | 11.931 | -11,47 | 593 | -11,49 | ||||
| 2026-02-03 | 13F | Retirement Planning Group | 244.960 | 2,95 | 12.182 | 2,96 | ||||
| 2026-02-09 | 13F | Hartland & Co., LLC | 4.921 | -4,52 | 245 | -4,69 |