Grundlæggende statistik
| Institutionelle ejere | 67 total, 67 long only, 0 short only, 0 long/short - change of 1,52% MRQ |
| Gennemsnitlig porteføljeallokering | 0.0757 % - change of -16,18% MRQ |
| Institutionelle aktier (lange) | 3.902.128 (ex 13D/G) - change of 0,22MM shares 5,99% MRQ |
| Institutionel værdi (lang) | $ 65.114 USD ($1000) |
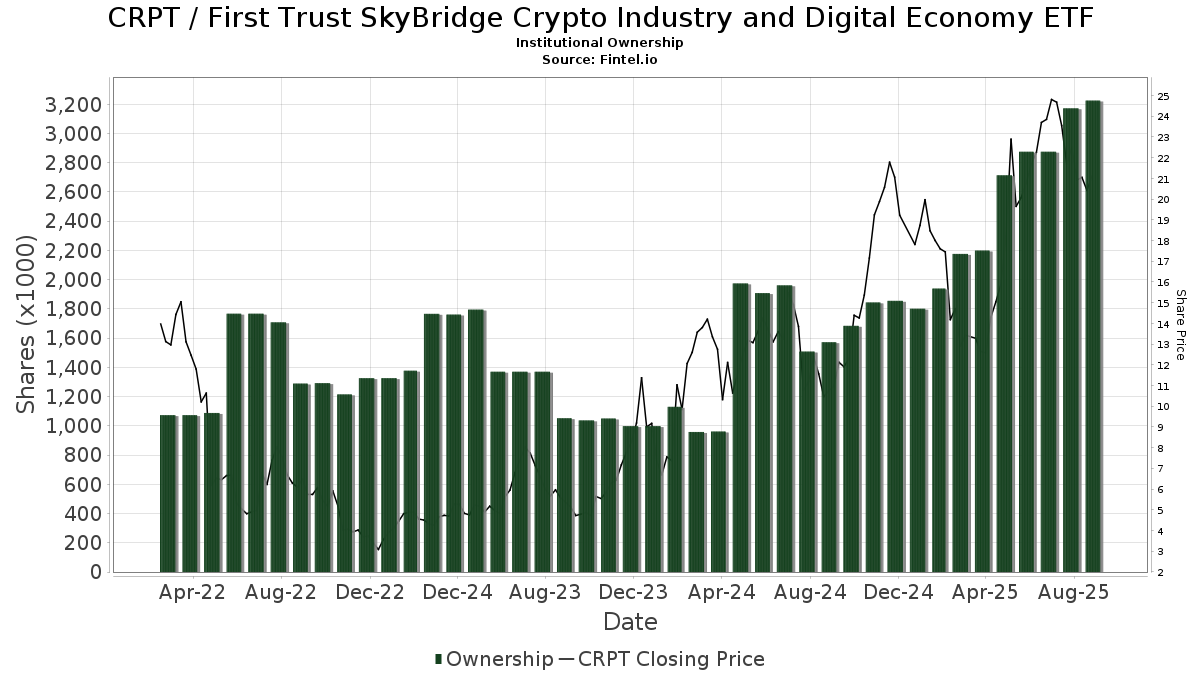
Institutionelt ejerskab og aktionærer
First Trust SkyBridge Crypto Industry and Digital Economy ETF (US:CRPT) har 67 institutionelle ejere og aktionærer, der har indsendt 13D/G- eller 13F-formularer til Securities Exchange Commission (SEC). Disse institutioner har i alt 3,902,128 aktier. Største aktionærer omfatter Gradient Investments LLC, Mattson Financial Services, LLC, Csenge Advisory Group, Cetera Investment Advisers, Cambridge Investment Research Advisors, Inc., Compass Capital Corp /ma/ /adv, Manchester Financial Inc, Commonwealth Equity Services, Llc, LPL Financial LLC, and Money Concepts Capital Corp .
First Trust SkyBridge Crypto Industry and Digital Economy ETF (ARCA:CRPT) institutionel ejerskabsstruktur viser aktuelle positioner i virksomheden efter institutioner og fonde, samt seneste ændringer i positionsstørrelse. Større aktionærer kan omfatte individuelle investorer, investeringsforeninger, hedgefonde eller institutioner. Skema 13D angiver, at investoren besidder (eller besidder) mere end 5 % af virksomheden og har til hensigt (eller har til hensigt at) aktivt at forfølge en ændring i forretningsstrategi. Skema 13G indikerer en passiv investering på over 5%.
The share price as of January 30, 2026 is 15,26 / share. Previously, on February 3, 2025, the share price was 18,40 / share. This represents a decline of 17,07% over that period.
Fondens stemningsscore
Fund Sentiment Score (fka Ownership Accumulation Score) finder de aktier, der bliver mest købt af fonde. Det er resultatet af en sofistikeret, multi-faktor kvantitativ model, der identificerer virksomheder med de højeste niveauer af institutionel akkumulering. Scoringsmodellen bruger en kombination af den samlede stigning i oplyste ejere, ændringerne i porteføljeallokeringer i disse ejere og andre målinger. Tallet går fra 0 til 100, hvor højere tal indikerer et højere niveau af akkumulering for sine jævnaldrende, og 50 er gennemsnittet.
Opdateringsfrekvens: Dagligt
Se Ownership Explorer, som giver en liste over højest rangerende virksomheder.
AI+ Ask Fintel’s AI assistant about First Trust SkyBridge Crypto Industry and Digital Economy ETF.
Select a question to share a public post with an AI-crafted answer.
Thinking of good questions…
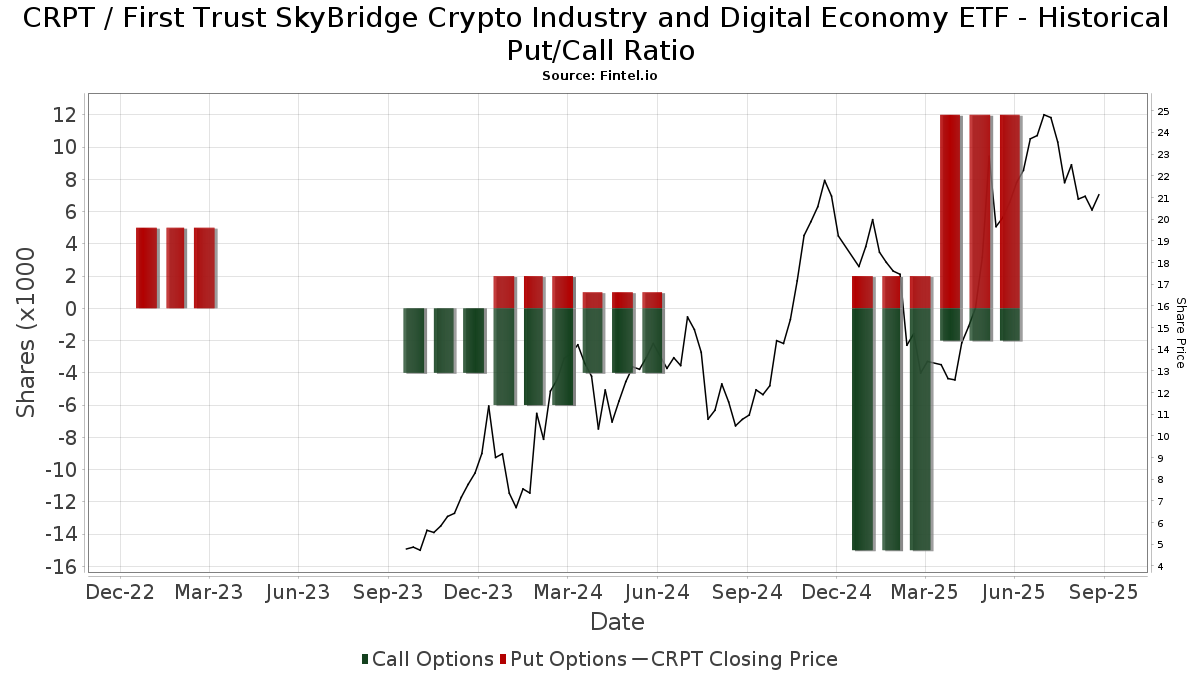
Institutionel Put/Call-forhold
Ud over at indberette standardaktie- og gældsudstedelser skal institutter med mere end 100 mill. aktiver under forvaltning også oplyse deres put- og call-optionsbeholdninger. Da salgsoptioner generelt indikerer negativ stemning, og købsoptioner indikerer positiv stemning, kan vi få en fornemmelse af den overordnede institutionelle stemning ved at plotte forholdet mellem put og kald. Diagrammet til højre viser det historiske put/call-forhold for dette instrument.
Brug af Put/Call Ratio som en indikator for investorernes stemning overvinder en af de vigtigste mangler ved at bruge totalt institutionelt ejerskab, som er, at en betydelig mængde af aktiver under forvaltning investeres passivt for at spore indekser. Passivt forvaltede fonde køber typisk ikke optioner, så indikatoren for put/call-forholdet følger mere nøje følelsen af aktivt forvaltede fonde.
13F og NPORT arkivering
Detaljer om 13F-arkivering er gratis. Detaljer om NP-ansøgninger kræver et premium-medlemskab. Grønne rækker angiver nye positioner. Røde rækker angiver lukkede positioner. Klik på linket ikon for at se den fulde transaktionshistorik.
Opgrader
for at låse premium-data op og eksportere til Excel ![]() .
.
| Fil dato | Kilde | Investor | Type | Gennemsnitlig pris (Øst) |
Aktier | Δ Aktier (%) |
Rapporteret Værdi ($1000) |
Δ Værdi (%) |
Port Alloc (%) |
|
|---|---|---|---|---|---|---|---|---|---|---|
| 2025-10-27 | 13F | Financial Network Wealth Advisors LLC | 92 | 0,00 | 2 | 0,00 | ||||
| 2025-11-07 | 13F | Mjp Associates Inc /adv | 17.906 | 0,00 | 399 | -4,10 | ||||
| 2026-01-26 | 13F | Cwm, Llc | 4.650 | 68,17 | 0 | |||||
| 2025-11-14 | 13F | Raymond James Financial Inc | 0 | -100,00 | 0 | |||||
| 2025-11-14 | 13F | Mount Yale Investment Advisors, LLC | 9.037 | 36,92 | 201 | 31,37 | ||||
| 2025-11-14 | 13F | Mml Investors Services, Llc | 44.031 | 28,53 | 981 | |||||
| 2025-11-14 | 13F | Cetera Investment Advisers | 200.953 | 3,45 | 4.477 | -0,69 | ||||
| 2025-11-12 | 13F | Stifel Financial Corp | 28.892 | 644 | ||||||
| 2026-01-30 | 13F | Sigma Planning Corp | 12.809 | 192 | ||||||
| 2025-11-13 | 13F | Bokf, Na | 1.000 | 0,00 | 22 | -4,35 | ||||
| 2025-11-19 | 13F | Sunbelt Securities, Inc. | 1.100 | 0,00 | 25 | 33,33 | ||||
| 2026-01-23 | 13F | HBW Advisory Services LLC | 18.814 | -41,75 | 282 | -60,78 | ||||
| 2025-11-05 | 13F | Envestnet Asset Management Inc | 13.818 | 308 | ||||||
| 2025-11-12 | 13F | Caitlin John, LLC | 767 | 17 | ||||||
| 2026-01-29 | 13F | Kestra Private Wealth Services, Llc | 28.344 | -16,63 | 425 | -43,86 | ||||
| 2025-11-07 | 13F | Wealthcare Advisory Partners LLC | 0 | -100,00 | 0 | |||||
| 2025-11-12 | 13F | Compass Capital Corp /ma/ /adv | 112.549 | 3,63 | 2.158 | -14,61 | ||||
| 2025-10-27 | 13F | Janney Montgomery Scott LLC | 16.226 | 0 | ||||||
| 2025-11-06 | 13F | Wedbush Securities Inc | 25.127 | -0,37 | 1 | |||||
| 2025-11-14 | 13F | Rockefeller Capital Management L.P. | 26.406 | 11,06 | 588 | 6,72 | ||||
| 2025-10-15 | 13F | Manchester Financial Inc | 86.523 | 22,72 | 1.928 | 17,79 | ||||
| 2025-11-12 | 13F | Harbour Investments, Inc. | 10.687 | -2,92 | 238 | -6,67 | ||||
| 2025-10-22 | 13F | Commonwealth Equity Services, Llc | 78.549 | -6,95 | 2 | 0,00 | ||||
| 2026-01-30 | 13F | Archer Investment Corp | 160 | 0,00 | 2 | -33,33 | ||||
| 2025-11-14 | 13F | Truvestments Capital Llc | 445 | 10 | ||||||
| 2026-01-15 | 13F | Nilsine Partners, LLC | 10.333 | 0,02 | 155 | -32,61 | ||||
| 2026-01-29 | 13F | Ashton Thomas Private Wealth, LLC | 17.492 | -0,32 | 263 | -32,82 | ||||
| 2025-11-03 | 13F | AE Wealth Management LLC | 0 | -100,00 | 0 | |||||
| 2025-11-07 | 13F | Entruity Wealth, LLC | 12.610 | -3,53 | 281 | -7,59 | ||||
| 2025-11-12 | 13F | Group One Trading, L.p. | 1.781 | 185,42 | 40 | 178,57 | ||||
| 2025-08-12 | 13F | Proequities, Inc. | 0 | 0 | ||||||
| 2025-08-14 | 13F | Citadel Advisors Llc | Put | 0 | -100,00 | 0 | -100,00 | |||
| 2025-11-06 | 13F | Oppenheimer & Co Inc | 19.750 | 440 | ||||||
| 2025-11-13 | 13F | O'shaughnessy Asset Management, Llc | 76 | 2 | ||||||
| 2025-11-14 | 13F | Morgan Stanley | 1.008 | 14.300,00 | 22 | |||||
| 2025-10-28 | 13F | Csenge Advisory Group | 203.994 | 41,02 | 4.545 | 67,12 | ||||
| 2026-01-30 | 13F | Wagner Wealth Management, Llc | 103 | 0,98 | 2 | -50,00 | ||||
| 2025-11-13 | 13F | Wells Fargo & Company/mn | 20 | 0 | ||||||
| 2025-11-14 | 13F | Susquehanna International Group, Llp | 0 | -100,00 | 0 | |||||
| 2025-11-14 | 13F | Citadel Advisors Llc | 0 | -100,00 | 0 | -100,00 | ||||
| 2026-01-15 | 13F | SILVER OAK SECURITIES, Inc | 50.739 | 7,23 | 777 | -26,28 | ||||
| 2025-11-10 | 13F | Lion Street Advisors, LLC | 0 | -100,00 | 0 | |||||
| 2026-01-14 | 13F | Wolff Wiese Magana Llc | 248 | 0,00 | 4 | -40,00 | ||||
| 2026-01-23 | 13F | Clear Creek Financial Management, LLC | 23.394 | 38,61 | 351 | -6,65 | ||||
| 2026-01-13 | 13F | CoreCap Advisors, LLC | 197 | 0,00 | 3 | -50,00 | ||||
| 2026-01-21 | 13F | Sound Income Strategies, LLC | 1.747 | 32 | ||||||
| 2026-01-28 | 13F | Barrett & Company, Inc. | 40 | 0,00 | 1 | |||||
| 2026-01-23 | 13F | U.S. Capital Wealth Advisors, LLC | 0 | -100,00 | 0 | |||||
| 2025-10-27 | 13F | Belvedere Trading LLC | Put | 0 | -100,00 | 0 | ||||
| 2025-10-27 | 13F | Belvedere Trading LLC | Call | 0 | -100,00 | 0 | ||||
| 2025-11-12 | 13F | Cambridge Investment Research Advisors, Inc. | 141.589 | 40,46 | 3 | 50,00 | ||||
| 2025-10-27 | 13F | Belvedere Trading LLC | 0 | -100,00 | 0 | |||||
| 2025-11-14 | 13F | Advisor Group Holdings, Inc. | 57.635 | -3,59 | 1.208 | -12,91 | ||||
| 2025-11-04 | 13F | Money Concepts Capital Corp | 67.545 | 8,81 | 1.505 | 4,44 | ||||
| 2025-11-14 | 13F | Citadel Advisors Llc | Call | 11.800 | 263 | |||||
| 2025-08-08 | 13F | Gts Securities Llc | 0 | -100,00 | 0 | |||||
| 2025-10-21 | 13F | Global Retirement Partners, LLC | 2.678 | 1,32 | 60 | -3,28 | ||||
| 2025-11-12 | 13F | LPL Financial LLC | 71.180 | 2,47 | 1.586 | -1,67 | ||||
| 2025-11-12 | 13F | Park Square Financial Group, LLC | 0 | -100,00 | 0 | |||||
| 2025-11-12 | 13F | Brinker Capital Investments, LLC | 46.177 | 45,39 | 1.029 | 39,48 | ||||
| 2025-11-04 | 13F | Centric Wealth Management | 27.878 | -1,27 | 601 | -4,45 | ||||
| 2026-01-29 | 13F | UBS Group AG | 1.331 | 20 | ||||||
| 2025-11-07 | 13F | HighTower Advisors, LLC | 40.315 | 2,97 | 898 | -1,10 | ||||
| 2025-11-18 | 13F | Advisory Services Network, LLC | 6.827 | 152 | ||||||
| 2025-11-12 | 13F | Aptus Capital Advisors, LLC | 60 | 1 | ||||||
| 2025-11-14 | 13F | Jane Street Group, Llc | 0 | -100,00 | 0 | |||||
| 2025-11-03 | 13F | GPS Wealth Strategies Group, LLC | 12.922 | 16,37 | 288 | 11,67 | ||||
| 2025-10-23 | 13F | Benjamin Edwards Inc | 19.340 | 431 | ||||||
| 2025-10-17 | 13F | Mattson Financial Services, LLC | 254.307 | 13,91 | 5.666 | 9,34 | ||||
| 2025-11-14 | 13F | Brown Financial Advisors | 18.587 | 32,71 | 414 | 27,38 | ||||
| 2026-01-15 | 13F | Paladin Wealth, LLC | 25.798 | 116,06 | 387 | 45,49 | ||||
| 2025-11-12 | 13F | Simplex Trading, Llc | 1.126 | 474,49 | 0 | |||||
| 2025-10-30 | 13F | Twin Peaks Wealth Advisors, LLC | 0 | -100,00 | 0 | -100,00 | ||||
| 2025-11-14 | 13F | SRS Capital Advisors, Inc. | 0 | -100,00 | 0 | -100,00 | ||||
| 2026-01-23 | 13F | DHJJ Financial Advisors, Ltd. | 50 | 1 | ||||||
| 2025-11-14 | 13F | Kestra Advisory Services, LLC | 13.758 | 26,67 | 307 | 21,43 | ||||
| 2025-10-07 | 13F | Thurston, Springer, Miller, Herd & Titak, Inc. | 0 | -100,00 | 0 | |||||
| 2025-11-12 | 13F | Creative Financial Designs Inc /adv | 1.250 | 0,00 | 28 | -6,90 | ||||
| 2026-01-08 | 13F | GSG Advisors LLC | 0 | -100,00 | 0 | |||||
| 2026-01-08 | 13F | Gradient Investments LLC | 1.928.427 | 22,86 | 28.946 | -17,23 | ||||
| 2026-01-21 | 13F | Capital Investment Advisory Services, LLC | 210 | -25,00 | 3 | -50,00 | ||||
| 2025-11-14 | 13F | Larson Financial Group LLC | 0 | -100,00 | 0 | |||||
| 2025-11-12 | 13F | Advisor OS, LLC | 17.906 | 0,00 | 399 | -4,10 | ||||
| 2025-11-12 | 13F | Tounjian Advisory Partners, Llc | 0 | -100,00 | 0 | |||||
| 2026-01-28 | 13F | N.E.W. Advisory Services LLC | 338 | 5 | ||||||
| 2026-01-14 | 13F | Nova Wealth Management, Inc. | 403 | 0,00 | 6 | -25,00 | ||||
| 2025-11-05 | 13F | Sherman Asset Management, Inc. | 13.198 | 0,00 | 294 | -3,92 | ||||
| 2025-10-31 | 13F | Global Assets Advisory, LLC | 48.876 | 1.089 |