Grundlæggende statistik
| Institutionelle aktier (lange) | 6.748.555 - 46,70% (ex 13D/G) - change of -1,41MM shares -17,28% MRQ |
| Institutionel værdi (lang) | $ 146.218 USD ($1000) |
Institutionelt ejerskab og aktionærer
Computer Programs and Systems, Inc. (US:CPSI) har 85 institutionelle ejere og aktionærer, der har indsendt 13D/G- eller 13F-formularer til Securities Exchange Commission (SEC). Disse institutioner har i alt 6,748,555 aktier. Største aktionærer omfatter Nellore Capital Management LLC, BlackRock, Inc., Vanguard Group Inc, Dimensional Fund Advisors Lp, Martin & Co Inc /tn/, Paradigm Capital Management Inc/ny, Federated Hermes, Inc., Ameriprise Financial Inc, Kennedy Capital Management, Inc., and Geode Capital Management, Llc .
Computer Programs and Systems, Inc. (NasdaqGS:CPSI) institutionel ejerskabsstruktur viser aktuelle positioner i virksomheden efter institutioner og fonde, samt seneste ændringer i positionsstørrelse. Større aktionærer kan omfatte individuelle investorer, investeringsforeninger, hedgefonde eller institutioner. Skema 13D angiver, at investoren besidder (eller besidder) mere end 5 % af virksomheden og har til hensigt (eller har til hensigt at) aktivt at forfølge en ændring i forretningsstrategi. Skema 13G indikerer en passiv investering på over 5%.

Fondens stemningsscore
Fund Sentiment Score (fka Ownership Accumulation Score) finder de aktier, der bliver mest købt af fonde. Det er resultatet af en sofistikeret, multi-faktor kvantitativ model, der identificerer virksomheder med de højeste niveauer af institutionel akkumulering. Scoringsmodellen bruger en kombination af den samlede stigning i oplyste ejere, ændringerne i porteføljeallokeringer i disse ejere og andre målinger. Tallet går fra 0 til 100, hvor højere tal indikerer et højere niveau af akkumulering for sine jævnaldrende, og 50 er gennemsnittet.
Opdateringsfrekvens: Dagligt
Se Ownership Explorer, som giver en liste over højest rangerende virksomheder.
AI+ Ask Fintel’s AI assistant about Computer Programs and Systems, Inc..
Select a question to share a public post with an AI-crafted answer.
Thinking of good questions…
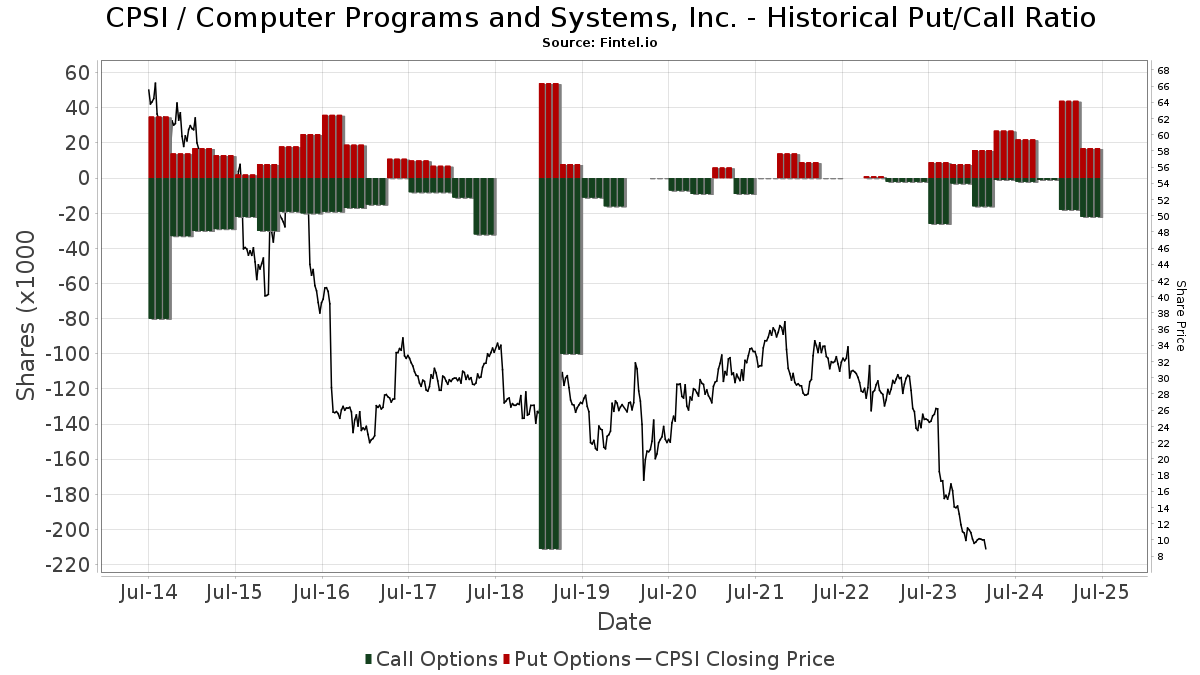
Institutionel Put/Call-forhold
Ud over at indberette standardaktie- og gældsudstedelser skal institutter med mere end 100 mill. aktiver under forvaltning også oplyse deres put- og call-optionsbeholdninger. Da salgsoptioner generelt indikerer negativ stemning, og købsoptioner indikerer positiv stemning, kan vi få en fornemmelse af den overordnede institutionelle stemning ved at plotte forholdet mellem put og kald. Diagrammet til højre viser det historiske put/call-forhold for dette instrument.
Brug af Put/Call Ratio som en indikator for investorernes stemning overvinder en af de vigtigste mangler ved at bruge totalt institutionelt ejerskab, som er, at en betydelig mængde af aktiver under forvaltning investeres passivt for at spore indekser. Passivt forvaltede fonde køber typisk ikke optioner, så indikatoren for put/call-forholdet følger mere nøje følelsen af aktivt forvaltede fonde.
13F og NPORT arkivering
Detaljer om 13F-arkivering er gratis. Detaljer om NP-ansøgninger kræver et premium-medlemskab. Grønne rækker angiver nye positioner. Røde rækker angiver lukkede positioner. Klik på linket ikon for at se den fulde transaktionshistorik.
Opgrader
for at låse premium-data op og eksportere til Excel ![]() .
.
| Fil dato | Kilde | Investor | Type | Gennemsnitlig pris (Øst) |
Aktier | Δ Aktier (%) |
Rapporteret Værdi ($1000) |
Δ Værdi (%) |
Port Alloc (%) |
|
|---|---|---|---|---|---|---|---|---|---|---|
| 2026-02-17 | 13F | Northern Trust Corp | 91.397 | -4,56 | 2.017 | 4,45 | ||||
| 2026-02-13 | 13F | American Century Companies Inc | 30.966 | 4,02 | 683 | 13,83 | ||||
| 2026-02-13 | 13F | Marshall Wace, Llp | 42.088 | 929 | ||||||
| 2026-02-17 | 13F | Engineers Gate Manager LP | 0 | -100,00 | 0 | |||||
| 2026-02-12 | 13F | Quadrant Capital Group Llc | 17 | 0,00 | 0 | |||||
| 2026-02-13 | 13F | Parkside Financial Bank & Trust | 1 | 0,00 | 0 | |||||
| 2026-02-17 | 13F | Tower Research Capital LLC (TRC) | 863 | 33,80 | 19 | 46,15 | ||||
| 2025-11-07 | 13F | Pnc Financial Services Group, Inc. | 0 | -100,00 | 0 | |||||
| 2026-02-17 | 13F | Russell Investments Group, Ltd. | 1.029 | 8,77 | 23 | 15,79 | ||||
| 2026-02-17 | 13F | D. E. Shaw & Co., Inc. | 93.660 | -16,10 | 2.067 | -8,17 | ||||
| 2026-02-09 | 13F | Legal & General Group Plc | 1.064 | -4,06 | 23 | 4,55 | ||||
| 2026-02-10 | 13F | Hillsdale Investment Management Inc. | 0 | -100,00 | 0 | |||||
| 2026-02-13 | 13F | Dynamic Technology Lab Private Ltd | 0 | -100,00 | 0 | |||||
| 2026-02-13 | 13F | Martin & Co Inc /tn/ | 437.031 | 2,83 | 9.645 | 12,52 | ||||
| 2026-02-17 | 13F | Citadel Advisors Llc | 0 | -100,00 | 0 | |||||
| 2025-11-14 | 13F | Quarry LP | 0 | -100,00 | 0 | -100,00 | ||||
| 2026-02-17 | 13F | Aquatic Capital Management LLC | 3.261 | -2,22 | 72 | 5,97 | ||||
| 2026-02-13 | 13F | Martingale Asset Management L P | 11.733 | 8,31 | 259 | 18,35 | ||||
| 2026-02-11 | 13F | Simplex Trading, Llc | 67 | 24,07 | 1 | |||||
| 2026-02-12 | 13F | Nuveen, LLC | 12.974 | 0,00 | 286 | 9,58 | ||||
| 2026-02-13 | 13F | Segall Bryant & Hamill, Llc | 94.524 | -0,23 | 2.086 | 9,21 | ||||
| 2026-02-13 | 13F | Squarepoint Ops LLC | 0 | -100,00 | 0 | |||||
| 2026-02-06 | 13F | Global Retirement Partners, LLC | 118 | 26,88 | 3 | 100,00 | ||||
| 2026-02-09 | 13F | Quest Partners LLC | 12.904 | 11,59 | 285 | 21,89 | ||||
| 2026-02-10 | 13F | Bank of New York Mellon Corp | 35.058 | 42,20 | 774 | 55,53 | ||||
| 2026-02-11 | 13F | Jpmorgan Chase & Co | 5.079 | -89,25 | 112 | -88,24 | ||||
| 2026-02-12 | 13F | JPL Wealth Management, LLC | 0 | -100,00 | 0 | |||||
| 2026-02-10 | 13F | Rothschild Investment Llc | 5 | 0 | ||||||
| 2026-02-17 | 13F | Two Sigma Investments, Lp | 55.243 | -55,75 | 1.219 | -51,59 | ||||
| 2026-02-17 | 13F | Mangrove Partners | 14.172 | 313 | ||||||
| 2026-02-13 | 13F | Public Employees Retirement Association Of Colorado | 3.592 | 0,00 | 0 | |||||
| 2026-01-27 | 13F | First Horizon Corp | 1.879 | -10,18 | 41 | -2,38 | ||||
| 2026-02-11 | 13F | Simplex Trading, Llc | Put | 0 | -100,00 | 0 | ||||
| 2025-11-07 | 13F | Gsa Capital Partners Llp | 0 | -100,00 | 0 | |||||
| 2026-02-12 | 13F | Federated Hermes, Inc. | 326.876 | 15,41 | 7.214 | 26,30 | ||||
| 2026-02-13 | 13F | Sterling Capital Management LLC | 12.435 | 0,33 | 274 | 10,04 | ||||
| 2026-02-03 | 13F | SBI Securities Co., Ltd. | 22 | 0,00 | 0 | |||||
| 2026-02-13 | 13F | Kestra Advisory Services, LLC | 0 | -100,00 | 0 | |||||
| 2026-02-13 | 13F | Ubs Asset Management Americas Inc | 41 | 1 | ||||||
| 2026-02-11 | 13F | Mitchell Mcleod Pugh & Williams Inc | 25.647 | 0,79 | 519 | 4,64 | ||||
| 2026-02-05 | 13F | Amalgamated Bank | 314 | -7,92 | 0 | |||||
| 2026-02-17 | 13F | Susquehanna International Group, Llp | Call | 0 | -100,00 | 0 | ||||
| 2026-02-17 | 13F | Royal Bank Of Canada | 285 | -64,99 | 6 | -64,71 | ||||
| 2025-11-14 | 13F | Hyperion Capital Advisors LP | 0 | -100,00 | 0 | -100,00 | ||||
| 2026-02-17 | 13F | MIRAE ASSET GLOBAL ETFS HOLDINGS Ltd. | 4.739 | 0,66 | 105 | 10,64 | ||||
| 2026-02-13 | 13F | SRS Capital Advisors, Inc. | 0 | -100,00 | 0 | |||||
| 2026-02-13 | 13F | Kennedy Capital Management, Inc. | 277.319 | 0,14 | 6.120 | 9,58 | ||||
| 2026-02-06 | 13F | Covestor Ltd | 16 | -96,14 | 0 | |||||
| 2026-02-11 | 13F | Deutsche Bank Ag\ | 28.567 | -24,12 | 630 | -17,00 | ||||
| 2026-01-29 | 13F | UBS Group AG | 33.072 | 0,89 | 730 | 10,29 | ||||
| 2026-02-12 | 13F | New York State Common Retirement Fund | 4.300 | 0,00 | 95 | 9,30 | ||||
| 2026-02-13 | 13F | State Street Corp | 165.501 | 1,86 | 3.653 | 11,44 | ||||
| 2026-02-17 | 13F | Trustmark National Bank Trust Department | 46.800 | 0,00 | 1.033 | 9,44 | ||||
| 2026-02-19 | 13F | Invesco Ltd. | 28.210 | -24,16 | 623 | -17,07 | ||||
| 2026-02-13 | 13F | Verition Fund Management LLC | 11.700 | 258 | ||||||
| 2025-11-14 | 13F | Raymond James Financial Inc | 0 | -100,00 | 0 | -100,00 | ||||
| 2026-02-12 | 13F | Dimensional Fund Advisors Lp | 508.432 | 8,04 | 11.221 | 18,20 | ||||
| 2026-02-02 | 13F | Strs Ohio | 0 | -100,00 | 0 | |||||
| 2026-02-10 | 13F | State of Wyoming | 5.413 | -49,46 | 119 | -44,91 | ||||
| 2026-02-17 | 13F | Millennium Management Llc | 9.841 | -21,83 | 217 | -14,23 | ||||
| 2026-01-29 | 13F | Vanguard Group Inc | 744.705 | -1,41 | 16.436 | 7,88 | ||||
| 2026-01-28 | 13F | Davidson Kahn Capital Management, LLC | 32.335 | -1,82 | 714 | 7,38 | ||||
| 2026-02-17 | 13F | Nellore Capital Management LLC | 915.034 | 22,49 | 20.195 | 34,03 | ||||
| 2026-02-13 | 13F | Citigroup Inc | 1.733 | -67,42 | 38 | -64,49 | ||||
| 2026-01-26 | 13F | Cwm, Llc | 150 | -67,25 | 0 | |||||
| 2026-02-12 | 13F | Paradigm Capital Management Inc/ny | 339.000 | 175,93 | 7.482 | 201,90 | ||||
| 2026-02-13 | 13F | Barclays Plc | 15.570 | 7,97 | 344 | 18,28 | ||||
| 2026-02-17 | 13F | Bank Of America Corp /de/ | 20.194 | -1,02 | 446 | 8,27 | ||||
| 2026-02-02 | 13F | Principal Financial Group Inc | 32.541 | 48,33 | 718 | 62,44 | ||||
| 2026-02-12 | 13F | Steward Partners Investment Advisory, Llc | 150 | 3 | ||||||
| 2026-04-13 | 13F | True Wealth Design, LLC | 4 | 0 | ||||||
| 2026-01-15 | 13F | Nisa Investment Advisors, Llc | 35 | 0,00 | 1 | |||||
| 2025-11-14 | 13F | Susquehanna International Group, Llp | 0 | -100,00 | 0 | -100,00 | ||||
| 2026-04-06 | 13F | GAMMA Investing LLC | 2.477 | 27,42 | 36 | -14,29 | ||||
| 2026-02-12 | 13F | BlackRock, Inc. | 758.125 | -2,52 | 16.732 | 6,66 | ||||
| 2026-02-13 | 13F | Morgan Stanley | 119.834 | -33,36 | 2.645 | -27,10 | ||||
| 2025-12-02 | 13F | IFP Advisors, Inc | 0 | 1 | ||||||
| 2026-02-13 | 13F | Sei Investments Co | 21.731 | 480 | ||||||
| 2026-02-17 | 13F/A | RBF Capital, LLC | 25.000 | -9,09 | 552 | -0,54 | ||||
| 2026-02-10 | 13F | Bnp Paribas Arbitrage, Sa | 9.323 | -10,71 | 206 | -2,38 | ||||
| 2026-02-11 | 13F | Los Angeles Capital Management Llc | 49.824 | -13,40 | 960 | -17,24 | ||||
| 2026-02-13 | 13F | Y-Intercept (Hong Kong) Ltd | 0 | -100,00 | 0 | |||||
| 2026-02-17 | 13F | Ameriprise Financial Inc | 291.635 | 0,90 | 6.436 | 10,41 | ||||
| 2026-02-17 | 13F | Susquehanna International Group, Llp | Put | 0 | -100,00 | 0 | ||||
| 2025-11-14 | 13F | Qube Research & Technologies Ltd | 0 | -100,00 | 0 | |||||
| 2026-02-17 | 13F | Fmr Llc | 7.191 | 0,00 | 159 | 8,97 | ||||
| 2026-02-12 | 13F | MetLife Investment Management, LLC | 6.111 | 0,00 | 135 | 8,94 | ||||
| 2025-11-14 | 13F | Northwestern Mutual Wealth Management Co | 0 | -100,00 | 0 | -100,00 | ||||
| 2025-11-19 | 13F | Caitong International Asset Management Co., Ltd | 0 | -100,00 | 0 | |||||
| 2026-02-13 | 13F | Wells Fargo & Company/mn | 10.927 | 78,02 | 241 | 95,93 | ||||
| 2026-02-12 | 13F | Renaissance Technologies Llc | 29.176 | -80,50 | 644 | -78,69 | ||||
| 2025-11-06 | 13F | Truffle Hound Capital, LLC | 0 | -100,00 | 0 | -100,00 | ||||
| 2026-02-10 | 13F | Goldman Sachs Group Inc | 142.640 | 34,15 | 3.148 | 46,83 | ||||
| 2025-11-12 | 13F | Integrated Quantitative Investments LLC | 0 | -100,00 | 0 | |||||
| 2026-02-13 | 13F | Charles Schwab Investment Management Inc | 107.125 | -0,05 | 2.364 | 9,39 | ||||
| 2026-02-17 | 13F | Lazard Asset Management Llc | 0 | -100,00 | 0 | |||||
| 2026-02-13 | 13F | Police & Firemen's Retirement System of New Jersey | 2.499 | 0,00 | 55 | 10,00 | ||||
| 2026-02-11 | 13F | Ameritas Investment Partners, Inc. | 1.020 | 23 | ||||||
| 2026-02-17 | 13F | Two Sigma Advisers, Lp | 12.600 | -86,86 | 278 | -85,63 | ||||
| 2026-02-17 | 13F | Advisor Group Holdings, Inc. | 1.007 | -49,80 | 22 | -45,00 | ||||
| 2025-11-13 | 13F | Quadrature Capital Ltd | 0 | -100,00 | 0 | -100,00 | ||||
| 2026-02-12 | 13F | Bank Of Montreal /can/ | 16.413 | 0,00 | 362 | 27,92 | ||||
| 2026-02-17 | 13F | SageView Advisory Group, LLC | 46.172 | -1,02 | 1.019 | 8,40 | ||||
| 2026-02-17 | 13F | Bridgeway Capital Management Inc | 11.200 | 247 | ||||||
| 2026-02-10 | 13F | Acadian Asset Management Llc | 108.265 | -48,95 | 2 | -50,00 | ||||
| 2026-02-17 | 13F | Aqr Capital Management Llc | 68.767 | 10,97 | 1.518 | 21,46 | ||||
| 2025-11-13 | 13F | Winton Capital Group Ltd | 0 | -100,00 | 0 | |||||
| 2026-02-17 | 13F | Forest Hill Capital, LLC | 101.308 | 0,00 | 2.236 | 9,40 | ||||
| 2026-02-17 | 13F | California State Teachers Retirement System | 615 | -1,44 | 14 | 8,33 | ||||
| 2026-02-18 | 13F | Vermillion & White Wealth Management Group, LLC | 81 | 0,00 | 2 | 0,00 | ||||
| 2025-11-12 | 13F | Quantbot Technologies LP | 0 | -100,00 | 0 | -100,00 | ||||
| 2025-11-13 | 13F | Jump Financial, LLC | 0 | -100,00 | 0 | |||||
| 2026-04-07 | 13F | Farther Finance Advisors, LLC | 513 | -8,06 | 8 | -33,33 | ||||
| 2025-11-04 | 13F | Jones Financial Companies Lllp | 0 | -100,00 | 0 | |||||
| 2026-02-09 | 13F | Geode Capital Management, Llc | 245.586 | -3,98 | 5.421 | 5,06 | ||||
| 2026-02-13 | 13F | Rhumbline Advisers | 11.684 | -17,97 | 258 | -10,45 |