Grundlæggende statistik
| Institutionelle ejere | 124 total, 124 long only, 0 short only, 0 long/short - change of -11,35% MRQ |
| Gennemsnitlig porteføljeallokering | 0.0990 % - change of 8,03% MRQ |
| Institutionelle aktier (lange) | 13.028.344 (ex 13D/G) - change of -0,41MM shares -3,04% MRQ |
| Institutionel værdi (lang) | $ 129.107 USD ($1000) |
Institutionelt ejerskab og aktionærer
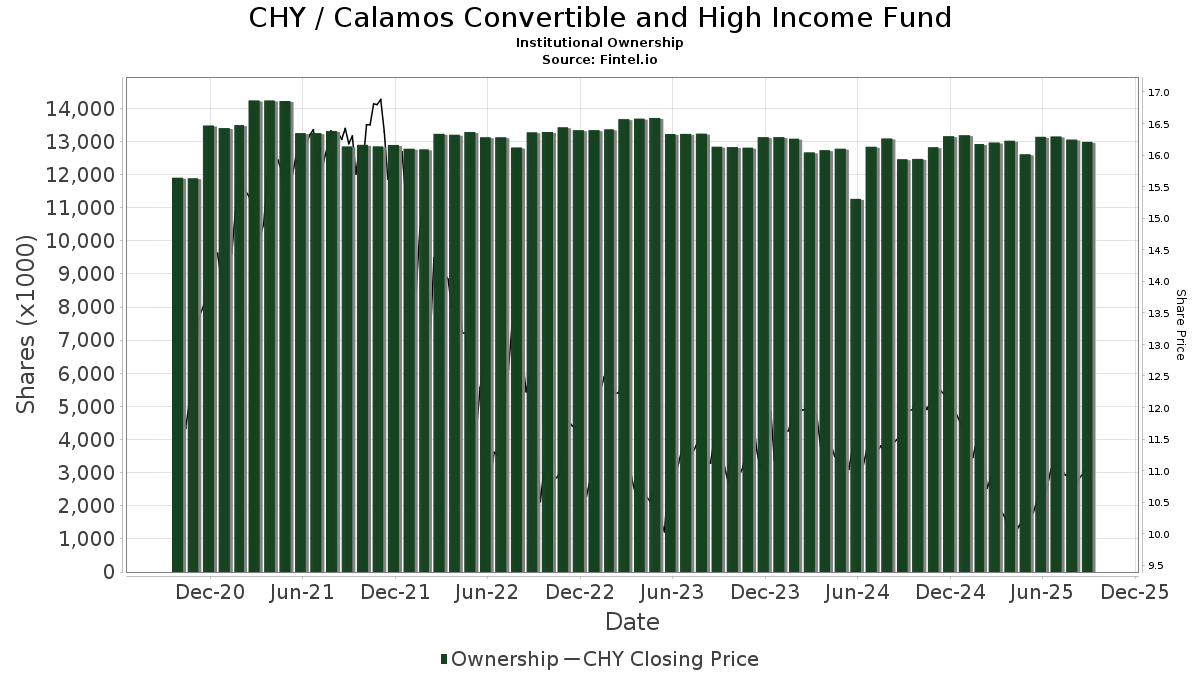
Calamos Convertible and High Income Fund (US:CHY) har 124 institutionelle ejere og aktionærer, der har indsendt 13D/G- eller 13F-formularer til Securities Exchange Commission (SEC). Disse institutioner har i alt 13,028,344 aktier. Største aktionærer omfatter LPL Financial LLC, Wells Fargo & Company/mn, Bank Of America Corp /de/, Morgan Stanley, Guggenheim Capital Llc, Penserra Capital Management LLC, Pacific Wealth Strategies Group, Inc., Cohen & Steers, Inc., Cornerstone Advisory, LLC, and Raymond James Financial Inc .
Calamos Convertible and High Income Fund (NasdaqGS:CHY) institutionel ejerskabsstruktur viser aktuelle positioner i virksomheden efter institutioner og fonde, samt seneste ændringer i positionsstørrelse. Større aktionærer kan omfatte individuelle investorer, investeringsforeninger, hedgefonde eller institutioner. Skema 13D angiver, at investoren besidder (eller besidder) mere end 5 % af virksomheden og har til hensigt (eller har til hensigt at) aktivt at forfølge en ændring i forretningsstrategi. Skema 13G indikerer en passiv investering på over 5%.
The share price as of April 13, 2026 is 11,96 / share. Previously, on April 14, 2025, the share price was 9,76 / share. This represents an increase of 22,52% over that period.
Fondens stemningsscore
Fund Sentiment Score (fka Ownership Accumulation Score) finder de aktier, der bliver mest købt af fonde. Det er resultatet af en sofistikeret, multi-faktor kvantitativ model, der identificerer virksomheder med de højeste niveauer af institutionel akkumulering. Scoringsmodellen bruger en kombination af den samlede stigning i oplyste ejere, ændringerne i porteføljeallokeringer i disse ejere og andre målinger. Tallet går fra 0 til 100, hvor højere tal indikerer et højere niveau af akkumulering for sine jævnaldrende, og 50 er gennemsnittet.
Opdateringsfrekvens: Dagligt
Se Ownership Explorer, som giver en liste over højest rangerende virksomheder.
AI+ Ask Fintel’s AI assistant about Calamos Convertible and High Income Fund.
Select a question to share a public post with an AI-crafted answer.
Thinking of good questions…
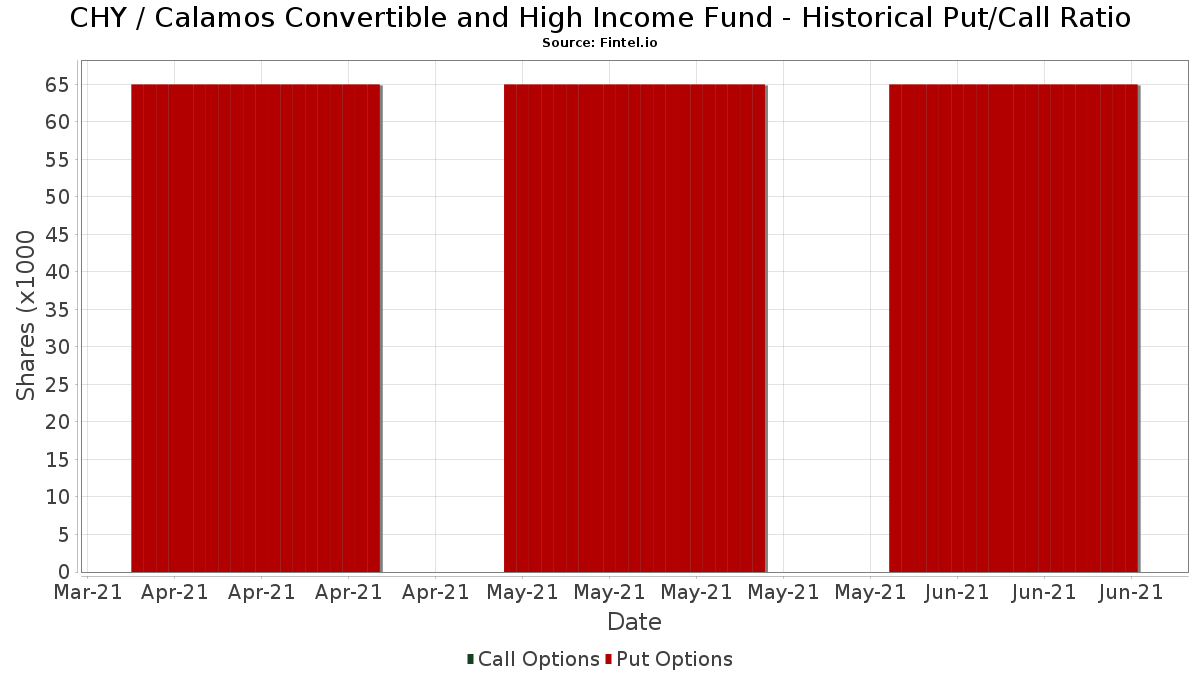
Institutionel Put/Call-forhold
Ud over at indberette standardaktie- og gældsudstedelser skal institutter med mere end 100 mill. aktiver under forvaltning også oplyse deres put- og call-optionsbeholdninger. Da salgsoptioner generelt indikerer negativ stemning, og købsoptioner indikerer positiv stemning, kan vi få en fornemmelse af den overordnede institutionelle stemning ved at plotte forholdet mellem put og kald. Diagrammet til højre viser det historiske put/call-forhold for dette instrument.
Brug af Put/Call Ratio som en indikator for investorernes stemning overvinder en af de vigtigste mangler ved at bruge totalt institutionelt ejerskab, som er, at en betydelig mængde af aktiver under forvaltning investeres passivt for at spore indekser. Passivt forvaltede fonde køber typisk ikke optioner, så indikatoren for put/call-forholdet følger mere nøje følelsen af aktivt forvaltede fonde.
13F og NPORT arkivering
Detaljer om 13F-arkivering er gratis. Detaljer om NP-ansøgninger kræver et premium-medlemskab. Grønne rækker angiver nye positioner. Røde rækker angiver lukkede positioner. Klik på linket ikon for at se den fulde transaktionshistorik.
Opgrader
for at låse premium-data op og eksportere til Excel ![]() .
.
| Fil dato | Kilde | Investor | Type | Gennemsnitlig pris (Øst) |
Aktier | Δ Aktier (%) |
Rapporteret Værdi ($1000) |
Δ Værdi (%) |
Port Alloc (%) |
|
|---|---|---|---|---|---|---|---|---|---|---|
| 2026-02-13 | 13F | Mml Investors Services, Llc | 20.318 | 1,85 | 230 | 2,69 | ||||
| 2026-01-26 | 13F | Whittier Trust Co Of Nevada Inc | 1.358 | 16 | ||||||
| 2026-02-11 | 13F | Cerity Partners LLC | 17.785 | 3,56 | 208 | 6,67 | ||||
| 2026-02-13 | 13F | Mariner, LLC | 130.373 | -20,63 | 1.475 | -19,98 | ||||
| 2026-02-12 | 13F | Jane Street Group, Llc | 23.718 | -38,73 | 268 | -38,25 | ||||
| 2026-01-26 | 13F | PFG Investments, LLC | 36.959 | 34,60 | 418 | 35,71 | ||||
| 2026-02-19 | 13F | Atomi Financial Group, Inc. | 66.687 | 128,89 | 754 | 131,29 | ||||
| 2026-01-27 | 13F | Summit Financial Strategies, Inc. | 16.489 | 0,00 | 186 | 0,54 | ||||
| 2025-11-14 | 13F | Larson Financial Group LLC | 0 | -100,00 | 0 | |||||
| 2026-02-05 | 13F | Allworth Financial LP | 11.480 | -0,02 | 130 | 0,78 | ||||
| 2026-02-13 | 13F | Navis Wealth Advisors, LLC | 69.327 | 784 | ||||||
| 2026-02-18 | 13F | EP Wealth Advisors, Inc. | 16.487 | 0,00 | 186 | 2,76 | ||||
| 2026-01-14 | 13F | ORG Partners LLC | 1.500 | 0,00 | 17 | 0,00 | ||||
| 2026-02-17 | 13F | Jones Financial Companies Lllp | 324 | 4 | ||||||
| 2026-01-28 | 13F | Chicago Partners Investment Group LLC | 23.366 | 1,92 | 275 | 3,00 | ||||
| 2026-01-27 | 13F | Greatmark Investment Partners, Inc. | 282.897 | 7,72 | 3.200 | 8,59 | ||||
| 2026-01-29 | 13F | D.a. Davidson & Co. | 31.695 | 50,53 | 358 | 51,69 | ||||
| 2026-04-02 | 13F | Marex Group plc | 0 | -100,00 | 0 | |||||
| 2026-01-27 | 13F | TD Waterhouse Canada Inc. | 2.580 | 2,67 | 29 | 3,57 | ||||
| 2026-01-27 | 13F | Autumn Glory Partners, LLC | 30.000 | 339 | ||||||
| 2026-01-29 | 13F | Sanctuary Advisors, LLC | 0 | -100,00 | 0 | -100,00 | ||||
| 2026-02-02 | 13F | Wolverine Asset Management Llc | 0 | -100,00 | 0 | |||||
| 2026-01-28 | 13F | Salomon & Ludwin, LLC | 637 | 0,00 | 7 | 0,00 | ||||
| 2026-02-09 | 13F | Prospera Financial Services Inc | 27.796 | -1,39 | 314 | -0,63 | ||||
| 2026-02-13 | 13F | Glen Eagle Advisors, LLC | 1.300 | 0,00 | 15 | 0,00 | ||||
| 2025-10-31 | 13F | Winebrenner Capital Management Llc | 0 | -100,00 | 0 | -100,00 | ||||
| 2026-02-12 | 13F | Principal Securities, Inc. | 0 | -100,00 | 0 | -100,00 | ||||
| 2026-02-11 | 13F | Janney Montgomery Scott LLC | 120.152 | -8,64 | 1 | 0,00 | ||||
| 2026-02-13 | 13F | Golden State Wealth Management, LLC | 108 | 2,86 | 1 | 0,00 | ||||
| 2026-01-12 | 13F | Burns J W & Co Inc/ny | 82.300 | -55,47 | 931 | -55,14 | ||||
| 2026-02-17 | 13F | Cetera Investment Advisers | 131.344 | 5,30 | 1.486 | 6,15 | ||||
| 2026-02-13 | 13F | Morgan Stanley | 943.356 | 1,71 | 10.669 | 2,53 | ||||
| 2026-02-09 | 13F | Pacific Wealth Strategies Group, Inc. | 580.102 | -8,87 | 6.561 | -8,15 | ||||
| 2026-02-17 | 13F | Advisory Services Network, LLC | 0 | -100,00 | 0 | |||||
| 2026-01-28 | 13F | Geneos Wealth Management Inc. | 1.540 | -49,34 | 17 | -50,00 | ||||
| 2026-01-28 | 13F | PMG Family Office LLC | 86.923 | -18,27 | 983 | -17,60 | ||||
| 2026-02-14 | 13F | Rockefeller Capital Management L.P. | 75.555 | -25,48 | 855 | -24,89 | ||||
| 2026-01-06 | 13F | Arlington Capital Management, Inc. | 48.774 | 552 | ||||||
| 2026-02-03 | 13F | Patten & Patten Inc/tn | 19.196 | 2,69 | 217 | 3,83 | ||||
| 2026-02-19 | 13F | CI Private Wealth, LLC | 131.228 | 0,00 | 1.496 | 1,63 | ||||
| 2026-02-18 | 13F | GWM Advisors LLC | 0 | -100,00 | 0 | |||||
| 2026-01-30 | 13F | Us Bancorp \de\ | 3.500 | 0,00 | 40 | 0,00 | ||||
| 2026-02-17 | 13F | Raymond James Financial Inc | 306.708 | 2,24 | 3.469 | 3,06 | ||||
| 2026-02-17 | 13F | Royal Bank Of Canada | 250.958 | 1,98 | 2.838 | 2,79 | ||||
| 2026-01-22 | 13F | Apollon Wealth Management, LLC | 84.617 | -11,01 | 957 | -10,23 | ||||
| 2026-02-12 | 13F | CIBC Private Wealth Group, LLC | 5.829 | 205,50 | 66 | 209,52 | ||||
| 2026-01-23 | 13F | Gilliland Jeter Wealth Management LLC | 0 | -100,00 | 0 | |||||
| 2026-02-02 | 13F | Oppenheimer & Co Inc | 15.237 | -3,04 | 172 | -2,27 | ||||
| 2026-02-10 | 13F | COFG Advisors, LLC | 31.407 | 355 | ||||||
| 2026-01-13 | 13F | Stephens Consulting, LLC | 600 | 0,00 | 7 | 0,00 | ||||
| 2026-02-17 | 13F | Advisor Group Holdings, Inc. | 282.618 | 4,78 | 3.196 | 7,32 | ||||
| 2026-01-22 | 13F | Greenberg Financial Group | 201.222 | 2.276 | ||||||
| 2026-02-11 | 13F | Stonebrook Private Inc. | 10.597 | 120 | ||||||
| 2026-02-17 | 13F | Boreal Capital Management LLC | 0 | 901 | ||||||
| 2026-04-07 | 13F | CoreCap Advisors, LLC | 0 | -100,00 | 0 | |||||
| 2026-03-24 | 13F | Armis Advisers, LLC | 21.500 | 245 | ||||||
| 2026-01-29 | 13F | Dumont & Blake Investment Advisors Llc | 228.661 | -2,71 | 3 | -99,92 | ||||
| 2026-02-12 | 13F | Insigneo Advisory Services, Llc | 16.033 | 0,00 | 181 | 1,12 | ||||
| 2026-01-15 | 13F | Sage Capital Management, LLC | 13.000 | 0,00 | 147 | 1,38 | ||||
| 2026-01-22 | 13F | Bartlett & Co. Wealth Management Llc | 555 | 0,00 | 6 | 0,00 | ||||
| 2026-02-02 | 13F | Benjamin Edwards Inc | 10.500 | 0,00 | 119 | 0,85 | ||||
| 2025-11-06 | 13F | Financial Advocates Investment Management | 0 | -100,00 | 0 | -100,00 | ||||
| 2025-11-10 | 13F | Hartland & Co., LLC | 0 | -100,00 | 0 | -100,00 | ||||
| 2026-04-13 | 13F | St Germain D J Co Inc | 395 | 0,00 | 4 | 0,00 | ||||
| 2026-02-12 | 13F | Steward Partners Investment Advisory, Llc | 17.697 | -2,30 | 200 | -1,48 | ||||
| 2026-02-10 | 13F | Ritter Daniher Financial Advisory LLC / DE | 950 | 11 | ||||||
| 2026-02-13 | 13F | Cohen & Steers, Inc. | 379.984 | 11,11 | 4 | 33,33 | ||||
| 2026-01-30 | 13F | Samalin Investment Counsel, LLC | 55.425 | 6,85 | 627 | 7,75 | ||||
| 2026-02-17 | 13F | Rivernorth Capital Management, Llc | 0 | -100,00 | 0 | |||||
| 2026-02-11 | 13F | LPL Financial LLC | 1.478.856 | 7,46 | 16.726 | 8,32 | ||||
| 2026-01-14 | 13F | Spire Wealth Management | 13.311 | 2,53 | 151 | 3,45 | ||||
| 2026-01-26 | 13F | Cwm, Llc | 10.462 | -1,09 | 0 | |||||
| 2026-02-13 | 13F | MAI Capital Management | 4.164 | 2,69 | 47 | 4,44 | ||||
| 2026-02-17 | 13F | RMB Capital Management, LLC | 51.645 | -4,04 | 589 | -2,49 | ||||
| 2026-02-17 | 13F | Wiley Bros.-aintree Capital, Llc | 32.358 | 64,83 | 366 | 65,91 | ||||
| 2026-01-27 | 13F | First Horizon Corp | 0 | -100,00 | 0 | |||||
| 2026-02-12 | 13F | Hollencrest Capital Management | 2.940 | 0,00 | 33 | 3,13 | ||||
| 2026-02-17 | 13F | Guggenheim Capital Llc | 719.274 | 12,13 | 8.135 | 13,02 | ||||
| 2026-01-29 | 13F | UBS Group AG | 141.601 | -12,31 | 1.602 | -11,60 | ||||
| 2026-02-03 | 13F | Morse Asset Management, Inc | 209.507 | 1,13 | 2.370 | 1,94 | ||||
| 2025-11-14 | 13F | Citadel Advisors Llc | 0 | -100,00 | 0 | |||||
| 2025-11-14 | 13F | StoneX Group Inc. | 0 | -100,00 | 0 | -100,00 | ||||
| 2026-02-12 | 13F | BlackRock, Inc. | 3.298 | -0,48 | 37 | 0,00 | ||||
| 2026-02-13 | 13F | Baird Financial Group, Inc. | 92.350 | 1,76 | 1.044 | 2,55 | ||||
| 2026-01-12 | 13F | DAVENPORT & Co LLC | 27.213 | -9,85 | 308 | -9,17 | ||||
| 2026-01-26 | 13F | LifeWealth Investments, LLC | 31.743 | 0,00 | 359 | 0,84 | ||||
| 2026-02-10 | 13F | Zhang Financial LLC | 0 | -100,00 | 0 | |||||
| 2026-01-20 | 13F | Sheets Smith Wealth Management | 26.681 | 2,30 | 302 | 3,08 | ||||
| 2026-02-04 | 13F | Meridian Wealth Management, LLC | 20.174 | 4,31 | 228 | 5,07 | ||||
| 2026-02-06 | 13F | Tortoise Investment Management, LLC | 0 | -100,00 | 0 | |||||
| 2026-02-12 | 13F | BRYN MAWR TRUST Co | 1.000 | 0,00 | 11 | 0,00 | ||||
| 2026-01-28 | 13F | Cornerstone Advisory, LLC | 364.453 | -8,50 | 4.122 | -7,77 | ||||
| 2026-02-09 | 13F | Harbour Investments, Inc. | 2.000 | 0,00 | 23 | 0,00 | ||||
| 2026-01-12 | 13F | Seacrest Wealth Management, Llc | 0 | -100,00 | 0 | |||||
| 2026-02-17 | 13F | Bank Of America Corp /de/ | 1.235.080 | 0,52 | 13.969 | 1,33 | ||||
| 2026-01-16 | 13F | Ronald Blue Trust, Inc. | 0 | -100,00 | 0 | |||||
| 2025-10-29 | 13F | QTR Family Wealth, LLC | 0 | -100,00 | 0 | -100,00 | ||||
| 2026-04-10 | 13F | Legacy Wealth Management, LLC / MS | 51.093 | 0,35 | 556 | -3,30 | ||||
| 2026-02-13 | 13F | SRS Capital Advisors, Inc. | 2.850 | 0,00 | 32 | 3,23 | ||||
| 2026-02-02 | 13F | Millstone Evans Group, LLC | 600 | 0,00 | 7 | 0,00 | ||||
| 2026-01-26 | 13F | Private Trust Co Na | 3.900 | 0,00 | 44 | 2,33 | ||||
| 2026-01-28 | 13F | N.E.W. Advisory Services LLC | 2.000 | 100,00 | 23 | 100,00 | ||||
| 2026-04-06 | 13F | CX Institutional | 469 | 2,40 | 0 | |||||
| 2026-01-20 | 13F | Steel Peak Wealth Management LLC | 0 | -100,00 | 0 | |||||
| 2026-02-13 | 13F | Stifel Financial Corp | 63.416 | -0,39 | 717 | 0,42 | ||||
| 2026-02-05 | 13F | Chancellor Financial Group WB LP | 35.605 | 2,54 | 403 | 3,34 | ||||
| 2026-04-08 | 13F | Cadent Capital Advisors, LLC | 62.000 | 12,73 | 675 | 8,52 | ||||
| 2026-01-23 | 13F | TFC Financial Management | 0 | -100,00 | 0 | |||||
| 2026-02-11 | 13F | J.w. Cole Advisors, Inc. | 35.632 | -2,51 | 403 | -1,95 | ||||
| 2026-02-17 | 13F | Readystate Asset Management Lp | 0 | -100,00 | 0 | |||||
| 2026-02-13 | 13F | Colony Group, LLC | 28.460 | 11,78 | 322 | 12,63 | ||||
| 2025-10-16 | 13F | Quad-Cities Investment Group, LLC | 0 | -100,00 | 0 | -100,00 | ||||
| 2026-02-09 | 13F | Key FInancial Inc | 50 | 0,00 | 1 | |||||
| 2026-04-10 | 13F | MKT Advisors LLC | 31.042 | -14,87 | 354 | -15,35 | ||||
| 2026-02-10 | 13F | Envestnet Asset Management Inc | 18.557 | 26,61 | 210 | 27,44 | ||||
| 2026-04-08 | 13F | Wealth Enhancement Advisory Services, Llc | 13.157 | -31,41 | 148 | -33,63 | ||||
| 2026-01-29 | 13F | Comerica Bank | 3.012 | -16,70 | 34 | -15,00 | ||||
| 2025-11-14 | 13F | Hrt Financial Lp | 0 | -100,00 | 0 | |||||
| 2026-01-29 | 13F | Kestra Private Wealth Services, Llc | 115.487 | 3,02 | 1.306 | 3,90 | ||||
| 2026-02-13 | 13F | National Bank Of Canada /fi/ | 39.150 | -1,01 | 442 | -0,23 | ||||
| 2026-01-20 | 13F | AdvisorNet Financial, Inc | 1.017 | -67,01 | 12 | -67,65 | ||||
| 2026-02-17 | 13F | Ameriprise Financial Inc | 128.506 | -23,18 | 1.453 | -22,55 | ||||
| 2026-02-10 | 13F | Koss-Olinger Consulting, LLC | 10.000 | 0,00 | 113 | 2,73 | ||||
| 2026-02-17 | 13F | Susquehanna International Group, Llp | 56.015 | 212,93 | 634 | 216,50 | ||||
| 2026-02-03 | 13F | International Assets Investment Management, Llc | 14.197 | -69,31 | 161 | -68,50 | ||||
| 2026-01-29 | 13F | Concurrent Investment Advisors, LLC | 22.168 | -0,51 | 251 | 0,40 | ||||
| 2026-02-03 | 13F | Merrithew & Thorsten Inc | 22.231 | 0 | ||||||
| 2026-02-10 | 13F | Verus Capital Partners, Llc | 18.087 | -6,96 | 205 | -6,42 | ||||
| 2026-02-06 | 13F | Pnc Financial Services Group, Inc. | 8.898 | 0,00 | 101 | 1,01 | ||||
| 2025-11-04 | 13F | L.m. Kohn & Company | 0 | -100,00 | 0 | |||||
| 2026-04-08 | 13F | Mirador Capital Partners LP | 18.718 | 1,89 | 204 | -1,93 | ||||
| 2026-02-13 | 13F | Wells Fargo & Company/mn | 1.281.487 | 3,59 | 14.494 | 4,42 | ||||
| 2026-02-02 | 13F | PKS Advisory Services, LLC | 14.724 | -11,58 | 167 | -10,75 | ||||
| 2026-02-05 | 13F | Cambridge Investment Research Advisors, Inc. | 136.958 | 6,29 | 2 | 0,00 | ||||
| 2026-02-12 | 13F | Federation des caisses Desjardins du Quebec | 1.250 | 0,00 | 14 | 7,69 | ||||
| 2026-02-18 | 13F | Beacon Pointe Advisors, LLC | 41.004 | 11,68 | 464 | 12,65 | ||||
| 2026-02-04 | 13F | Ameritas Advisory Services, LLC | 0 | -100,00 | 0 | |||||
| 2026-01-20 | 13F | Stratos Wealth Partners, LTD. | 60.846 | -4,28 | 688 | -3,51 | ||||
| 2026-02-12 | 13F | Commonwealth Equity Services, Llc | 161.501 | 22,55 | 1.827 | 182.500,00 | ||||
| 2026-02-12 | 13F | Penserra Capital Management LLC | 705.206 | 10,20 | 8 | 0,00 | ||||
| 2026-02-13 | 13F | Kestra Advisory Services, LLC | 0 | -100,00 | 0 | |||||
| 2026-02-06 | 13F | Fortis Group Advisors, LLC | 500 | 0,00 | 6 | 0,00 | ||||
| 2026-02-10 | 13F | Hazlett, Burt & Watson, Inc. | 2.100 | 0,00 | 0 | |||||
| 2026-01-21 | 13F | Newbridge Financial Services Group, Inc. | 0 | -100,00 | 0 | |||||
| 2026-02-13 | 13F | Landscape Capital Management, L.l.c. | 0 | -100,00 | 0 | |||||
| 2025-11-10 | 13F | Koshinski Asset Management, Inc. | 0 | -100,00 | 0 | -100,00 | ||||
| 2026-02-04 | 13F | Oxbow Advisors, LLC | 17.500 | 0,00 | 198 | 0,51 | ||||
| 2026-01-27 | 13F | GHP Investment Advisors, Inc. | 5.407 | 0,00 | 61 | 1,67 | ||||
| 2026-04-06 | 13F | Highline Wealth Partners Llc | 250 | -36,71 | 3 | -50,00 | ||||
| 2026-04-08 | 13F | Graves-Light Private Wealth Management, Inc. | 23.828 | 0,00 | 259 | -3,72 | ||||
| 2026-02-02 | 13F | Truist Financial Corp | 36.484 | -30,18 | 413 | -29,69 | ||||
| 2026-02-12 | 13F | Advisors Asset Management, Inc. | 239.119 | -3,72 | 2.704 | -2,94 | ||||
| 2026-04-07 | 13F | Farther Finance Advisors, LLC | 1.507 | 0,00 | 17 | -5,88 | ||||
| 2026-02-10 | 13F/A | Northwestern Mutual Wealth Management Co | 6.313 | 8,60 | 71 | 9,23 | ||||
| 2026-02-11 | 13F | United Financial Planning Group LLC | 10.000 | 0,00 | 113 | 0,89 | ||||
| 2026-04-10 | 13F | Melfa Wealth Management, Llc | 17.103 | 0,00 | 186 | -3,63 | ||||
| 2026-02-03 | 13F | Costello Asset Management, INC | 0 | -100,00 | 0 | |||||
| 2026-01-21 | 13F | Prime Capital Investment Advisors, LLC | 19.183 | -3,45 | 217 | -2,70 |