Grundlæggende statistik
| Institutionelle ejere | 73 total, 73 long only, 0 short only, 0 long/short - change of 2,78% MRQ |
| Gennemsnitlig porteføljeallokering | 0.3391 % - change of -42,33% MRQ |
| Institutionelle aktier (lange) | 9.154.120 (ex 13D/G) - change of -1,07MM shares -10,51% MRQ |
| Institutionel værdi (lang) | $ 249.839 USD ($1000) |
Institutionelt ejerskab og aktionærer
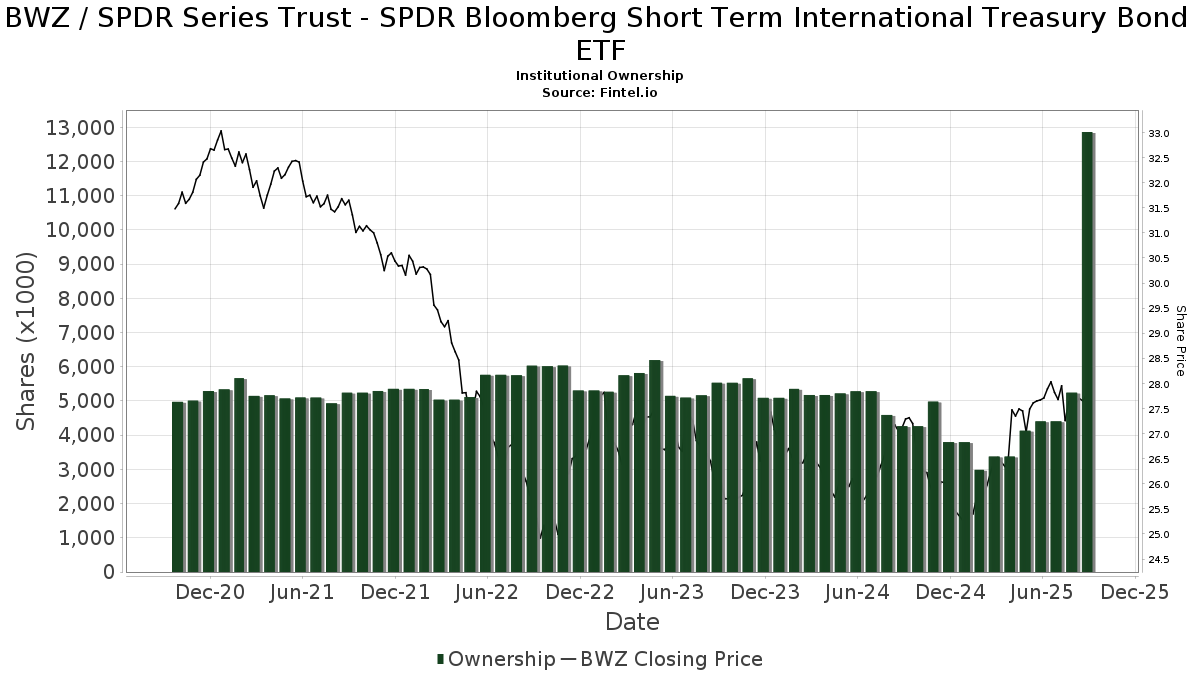
SPDR Series Trust - SPDR Bloomberg Short Term International Treasury Bond ETF (US:BWZ) har 73 institutionelle ejere og aktionærer, der har indsendt 13D/G- eller 13F-formularer til Securities Exchange Commission (SEC). Disse institutioner har i alt 9,154,120 aktier. Største aktionærer omfatter Advisor Group Holdings, Inc., Quent Capital, LLC, Quent Long Short Global Small Cap Fund, LP, Financial Management Professionals, Inc., Checchi Capital Advisers, LLC, Almanack Investment Partners, LLC., Clarity Asset Management, Inc., Walkner Condon Financial Advisors LLC, Jane Street Group, Llc, and Ieq Capital, Llc .
SPDR Series Trust - SPDR Bloomberg Short Term International Treasury Bond ETF (ARCA:BWZ) institutionel ejerskabsstruktur viser aktuelle positioner i virksomheden efter institutioner og fonde, samt seneste ændringer i positionsstørrelse. Større aktionærer kan omfatte individuelle investorer, investeringsforeninger, hedgefonde eller institutioner. Skema 13D angiver, at investoren besidder (eller besidder) mere end 5 % af virksomheden og har til hensigt (eller har til hensigt at) aktivt at forfølge en ændring i forretningsstrategi. Skema 13G indikerer en passiv investering på over 5%.
The share price as of April 2, 2026 is 26,93 / share. Previously, on April 3, 2025, the share price was 26,76 / share. This represents an increase of 0,64% over that period.
Fondens stemningsscore
Fund Sentiment Score (fka Ownership Accumulation Score) finder de aktier, der bliver mest købt af fonde. Det er resultatet af en sofistikeret, multi-faktor kvantitativ model, der identificerer virksomheder med de højeste niveauer af institutionel akkumulering. Scoringsmodellen bruger en kombination af den samlede stigning i oplyste ejere, ændringerne i porteføljeallokeringer i disse ejere og andre målinger. Tallet går fra 0 til 100, hvor højere tal indikerer et højere niveau af akkumulering for sine jævnaldrende, og 50 er gennemsnittet.
Opdateringsfrekvens: Dagligt
Se Ownership Explorer, som giver en liste over højest rangerende virksomheder.
AI+ Ask Fintel’s AI assistant about SPDR Series Trust - SPDR Bloomberg Short Term International Treasury Bond ETF.
Select a question to share a public post with an AI-crafted answer.
Thinking of good questions…
Institutionel Put/Call-forhold
Ud over at indberette standardaktie- og gældsudstedelser skal institutter med mere end 100 mill. aktiver under forvaltning også oplyse deres put- og call-optionsbeholdninger. Da salgsoptioner generelt indikerer negativ stemning, og købsoptioner indikerer positiv stemning, kan vi få en fornemmelse af den overordnede institutionelle stemning ved at plotte forholdet mellem put og kald. Diagrammet til højre viser det historiske put/call-forhold for dette instrument.
Brug af Put/Call Ratio som en indikator for investorernes stemning overvinder en af de vigtigste mangler ved at bruge totalt institutionelt ejerskab, som er, at en betydelig mængde af aktiver under forvaltning investeres passivt for at spore indekser. Passivt forvaltede fonde køber typisk ikke optioner, så indikatoren for put/call-forholdet følger mere nøje følelsen af aktivt forvaltede fonde.
13F og NPORT arkivering
Detaljer om 13F-arkivering er gratis. Detaljer om NP-ansøgninger kræver et premium-medlemskab. Grønne rækker angiver nye positioner. Røde rækker angiver lukkede positioner. Klik på linket ikon for at se den fulde transaktionshistorik.
Opgrader
for at låse premium-data op og eksportere til Excel ![]() .
.
| Fil dato | Kilde | Investor | Type | Gennemsnitlig pris (Øst) |
Aktier | Δ Aktier (%) |
Rapporteret Værdi ($1000) |
Δ Værdi (%) |
Port Alloc (%) |
|
|---|---|---|---|---|---|---|---|---|---|---|
| 2026-01-12 | 13F | Heartwood Wealth Advisors LLC | 0 | -100,00 | 0 | -100,00 | ||||
| 2026-02-12 | 13F | Commonwealth Equity Services, Llc | 95.904 | -2,44 | 2.629 | 131.300,00 | ||||
| 2026-01-26 | 13F | Patriot Financial Group Insurance Agency, LLC | 92.991 | 9,10 | 2.549 | 7,47 | ||||
| 2026-02-17 | 13F | Royal Bank Of Canada | 178.735 | 18,61 | 4.899 | 16,87 | ||||
| 2025-10-20 | 13F | Ascent Group, LLC | 0 | -100,00 | 0 | |||||
| 2026-01-29 | 13F | LFA - Lugano Financial Advisors SA | 6.457 | -23,08 | 177 | -24,46 | ||||
| 2025-11-13 | 13F | Private Advisor Group, LLC | 0 | -100,00 | 0 | |||||
| 2026-01-21 | 13F | Master's Wealth Management Inc. | 69.756 | -76,72 | 1.912 | -77,06 | ||||
| 2026-02-13 | 13F | Ieq Capital, Llc | 224.699 | 54,92 | 6.159 | 52,64 | ||||
| 2026-02-17 | 13F | Cardiff Park Advisors, Llc | 325 | 0,00 | 9 | -11,11 | ||||
| 2026-03-20 | 13F | Purpose Unlimited Inc. | 20.594 | 562 | ||||||
| 2026-02-10 | 13F | David R. Rahn & Associates Inc. | 51.535 | -93,89 | 1.413 | -93,98 | ||||
| 2026-02-10 | 13F/A | Northwestern Mutual Wealth Management Co | 365 | 0,55 | 10 | 0,00 | ||||
| 2025-11-03 | 13F | AE Wealth Management LLC | 0 | -100,00 | 0 | |||||
| 2026-01-23 | 13F | Assetmark, Inc | 1.287 | -41,21 | 35 | -41,67 | ||||
| 2026-02-12 | 13F | Principal Securities, Inc. | 0 | -100,00 | 0 | -100,00 | ||||
| 2025-10-07 | 13F | Nova Wealth Management, Inc. | 0 | -100,00 | 0 | |||||
| 2026-02-13 | 13F | Satovsky Asset Management Llc | 20.162 | 0,67 | 553 | -0,90 | ||||
| 2026-01-27 | 13F | Checchi Capital Advisers, LLC | 594.355 | -2,02 | 16.291 | -3,46 | ||||
| 2026-02-17 | 13F | Fmr Llc | 0 | -100,00 | 0 | |||||
| 2025-11-13 | 13F | Johnson Financial Group, Inc. | 0 | -100,00 | 0 | |||||
| 2026-02-13 | 13F | Clarity Asset Management, Inc. | 262.143 | 2,76 | 7.185 | 1,25 | ||||
| 2026-02-06 | 13F | Global Retirement Partners, LLC | 99 | 0,00 | 3 | 0,00 | ||||
| 2025-10-08 | 13F | Ignite Planners, LLC | 0 | -100,00 | 0 | |||||
| 2026-02-17 | 13F | Cresset Asset Management, LLC | 181.659 | -10,36 | 4.979 | -11,67 | ||||
| 2026-01-23 | 13F | Lam Group, Inc. | 48.025 | 1.316 | ||||||
| 2026-02-17 | 13F | Mercer Global Advisors Inc /adv | 32.703 | -22,02 | 896 | -23,16 | ||||
| 2026-01-23 | 13F | Inlight Wealth Management, LLC | 3.189 | 0,00 | 87 | -1,14 | ||||
| 2026-01-27 | 13F | Elevated Capital Advisors, LLC | 244 | 7 | ||||||
| 2026-01-06 | 13F | Martin Capital Partners, LLC | 10.395 | -8,17 | 0 | |||||
| 2025-11-14 | 13F | Raymond James Financial Inc | 0 | -100,00 | 0 | -100,00 | ||||
| 2026-02-13 | 13F | Transamerica Financial Advisors, Inc. | 33.766 | 926 | ||||||
| 2026-01-23 | 13F | Farther Finance Advisors, LLC | 79 | 259,09 | 2 | |||||
| 2026-01-21 | 13F | Capital Investment Advisory Services, LLC | 0 | -100,00 | 0 | |||||
| 2026-02-02 | 13F | Montag A & Associates Inc | 1.696 | 0,00 | 46 | -2,13 | ||||
| 2026-02-17 | 13F | Pinnacle Financial Partners, Inc. | 12.689 | 348 | ||||||
| 2025-10-15 | 13F | Cwm, Llc | 0 | -100,00 | 0 | |||||
| 2026-02-13 | 13F | Smartleaf Asset Management LLC | 168 | 0,00 | 5 | 0,00 | ||||
| 2026-02-13 | 13F | National Bank Of Canada /fi/ | 1.706 | 46 | ||||||
| 2025-11-07 | 13F | Jpmorgan Chase & Co | 0 | -100,00 | 0 | |||||
| 2025-10-08 | 13F | VisionPoint Advisory Group, LLC | 0 | -100,00 | 0 | |||||
| 2025-11-10 | 13F | Beaumont Capital Management, LLC | 0 | -100,00 | 0 | |||||
| 2026-02-10 | 13F | Envestnet Asset Management Inc | 116.221 | -15,00 | 3.186 | -16,25 | ||||
| 2025-11-07 | 13F | Synovus Financial Corp | 12.273 | 341 | ||||||
| 2026-01-12 | 13F | Fiduciary Financial Group, Llc | 14.018 | 54,69 | 384 | 52,38 | ||||
| 2026-01-21 | 13F | Walkner Condon Financial Advisors LLC | 233.213 | 6,47 | 6.389 | 4,91 | ||||
| 2026-01-29 | 13F | UBS Group AG | 186.732 | -9,18 | 5.118 | -10,52 | ||||
| 2026-02-13 | 13F | Mml Investors Services, Llc | 34.368 | -33,25 | 942 | -34,22 | ||||
| 2026-01-29 | 13F | Quent Capital, LLC | 1.004.228 | 6,74 | 27.526 | 5,16 | ||||
| 2026-02-10 | 13F | Goldman Sachs Group Inc | 212.022 | 5.812 | ||||||
| 2026-01-30 | 13F | Palisades Hudson Asset Management, L.P. | 20.069 | 2,98 | 1 | |||||
| 2026-01-20 | 13F | Ethos Financial Group, LLC | 14.008 | 384 | ||||||
| 2026-02-17 | 13F | Df Dent & Co Inc | 0 | -100,00 | 0 | |||||
| 2026-02-13 | 13F | Gts Securities Llc | 97.567 | 2.674 | ||||||
| 2026-02-05 | 13F | Allworth Financial LP | 1.818 | 0,00 | 50 | -2,00 | ||||
| 2026-02-17 | 13F | Creative Planning | 124.634 | 1,42 | 3.416 | -0,06 | ||||
| 2026-01-28 | 13F | Quent Long Short Global Small Cap Fund, LP | 1.004.228 | 27.526 | ||||||
| 2026-02-17 | 13F | Cetera Investment Advisers | 69.614 | -0,82 | 1.908 | -2,25 | ||||
| 2026-01-27 | 13F | Belpointe Asset Management LLC | 26.722 | -31,90 | 732 | -32,91 | ||||
| 2026-02-12 | 13F | Jane Street Group, Llc | 232.529 | 2.343,82 | 6.374 | 2.314,02 | ||||
| 2026-02-17 | 13F | Bank Of America Corp /de/ | 43.910 | -22,91 | 1.204 | -24,05 | ||||
| 2026-02-17 | 13F | Ameriprise Financial Inc | 0 | -100,00 | 0 | |||||
| 2026-02-06 | 13F | Creative Financial Designs Inc /adv | 1.027 | 0,59 | 28 | 0,00 | ||||
| 2026-02-13 | 13F | Wells Fargo & Company/mn | 34.206 | -20,67 | 938 | -21,85 | ||||
| 2026-02-09 | 13F | Leavell Investment Management, Inc. | 10.558 | 0,00 | 289 | -1,37 | ||||
| 2026-02-11 | 13F | LPL Financial LLC | 14.421 | -6,15 | 395 | -7,49 | ||||
| 2026-01-23 | 13F | Lunt Capital Management, Inc. | 22.757 | -1,40 | 624 | -2,96 | ||||
| 2026-01-29 | 13F | Comerica Bank | 5.626 | 0,00 | 154 | -1,28 | ||||
| 2026-02-17 | 13F | Advisor Group Holdings, Inc. | 1.241.128 | 2,16 | 34.019 | 0,66 | ||||
| 2026-01-27 | 13F | Financial Management Professionals, Inc. | 864.501 | 6,79 | 23.696 | 5,21 | ||||
| 2026-02-11 | 13F | Cerity Partners LLC | 7.945 | 0,05 | 218 | -1,36 | ||||
| 2026-01-21 | 13F | DMG Group, LLC | 165.469 | 47,19 | 4.536 | 45,03 | ||||
| 2026-01-29 | 13F | Almanack Investment Partners, LLC. | 527.796 | 4,30 | 14.467 | 2,76 | ||||
| 2026-02-03 | 13F | Legacy Wealth Managment, LLC/ID | 27 | 0,00 | 1 | |||||
| 2026-01-12 | 13F | Legacy Wealth Asset Management, LLC | 28.614 | 4,59 | 784 | 3,02 | ||||
| 2026-02-11 | 13F | Empowered Funds, LLC | 149.268 | -54,75 | 4.091 | -55,34 | ||||
| 2026-02-13 | 13F | Morgan Stanley | 21.642 | -24,22 | 593 | -25,31 | ||||
| 2026-02-09 | 13F | Huntington National Bank | 0 | |||||||
| 2026-02-06 | 13F | Empirical Asset Management, LLC | 13.529 | 371 | ||||||
| 2026-02-17 | 13F | Susquehanna International Group, Llp | 50.184 | 185,06 | 1.376 | 181,19 | ||||
| 2026-02-14 | 13F | Rockefeller Capital Management L.P. | 134.759 | 0,26 | 3.694 | -1,23 | ||||
| 2025-11-06 | 13F | Atria Investments Llc | 0 | -100,00 | 0 | |||||
| 2026-01-15 | 13F | One + One Wealth Management, Llc | 9.718 | 266 | ||||||
| 2025-11-12 | 13F | Cambridge Investment Research Advisors, Inc. | 0 | -100,00 | 0 | |||||
| 2026-02-11 | 13F | Janney Montgomery Scott LLC | 7.519 | 0,00 | 0 | |||||
| 2026-01-14 | 13F | Eastern Bank | 1 | 0,00 | 0 | |||||
| 2025-11-07 | 13F | HighTower Advisors, LLC | 0 | -100,00 | 0 | |||||
| 2026-01-23 | 13F | Laurel Wealth Planning LLC | 0 | -100,00 | 0 | |||||
| 2026-02-09 | 13F | Studio Investment Management Llc | 70.522 | 7,16 | 1.933 | 5,63 | ||||
| 2026-01-30 | 13F | Caldwell Trust Co | 125 | 0,00 | 3 | 0,00 | ||||
| 2026-02-17 | 13F | Quantinno Capital Management LP | 99.925 | 0,00 | 2.739 | -1,48 | ||||
| 2025-11-13 | 13F | Hanlon Investment Management, Inc. | 0 | -100,00 | 0 | |||||
| 2026-01-16 | 13F | Park Edge Advisors, LLC | 216.156 | 5.925 | ||||||
| 2026-01-28 | 13F | Trademark Financial Management, LLC | 23.252 | -42,44 | 637 | -43,28 | ||||
| 2026-02-11 | 13F | ARGI Investment Services, LLC | 30.245 | 829 | ||||||
| 2026-02-13 | 13F | Haverford Trust Co | 9.300 | 0,00 | 255 | -1,55 |