Grundlæggende statistik
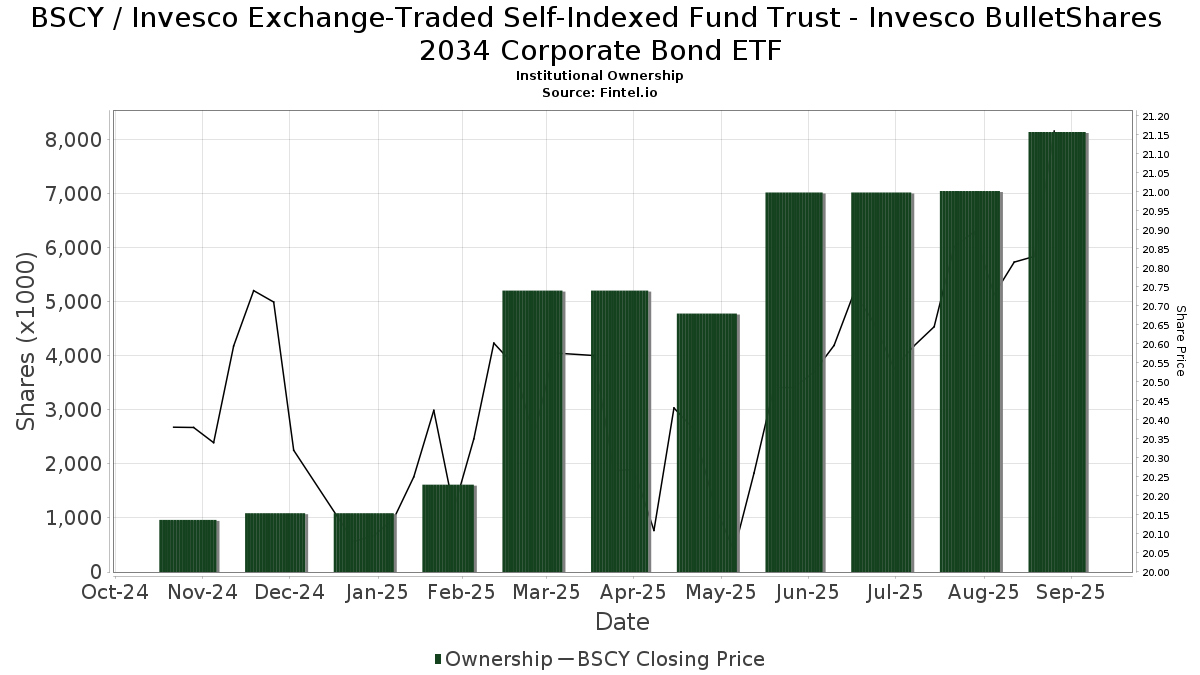
| Institutionelle ejere | 86 total, 86 long only, 0 short only, 0 long/short - change of 11,54% MRQ |
| Gennemsnitlig porteføljeallokering | 0.1919 % - change of 20,98% MRQ |
| Institutionelle aktier (lange) | 13.820.845 (ex 13D/G) - change of 4,16MM shares 43,10% MRQ |
| Institutionel værdi (lang) | $ 289.365 USD ($1000) |
Institutionelt ejerskab og aktionærer
Invesco Exchange-Traded Self-Indexed Fund Trust - Invesco BulletShares 2034 Corporate Bond ETF (US:BSCY) har 86 institutionelle ejere og aktionærer, der har indsendt 13D/G- eller 13F-formularer til Securities Exchange Commission (SEC). Disse institutioner har i alt 13,820,845 aktier. Største aktionærer omfatter Raymond James Financial Inc, Aptus Capital Advisors, LLC, LPL Financial LLC, Wells Fargo & Company/mn, Invesco Ltd., BCS Wealth Management, Morgan Stanley, Cookson Peirce & Co Inc, Jones Financial Companies Lllp, and Equitable Holdings, Inc. .
Invesco Exchange-Traded Self-Indexed Fund Trust - Invesco BulletShares 2034 Corporate Bond ETF (NasdaqGM:BSCY) institutionel ejerskabsstruktur viser aktuelle positioner i virksomheden efter institutioner og fonde, samt seneste ændringer i positionsstørrelse. Større aktionærer kan omfatte individuelle investorer, investeringsforeninger, hedgefonde eller institutioner. Skema 13D angiver, at investoren besidder (eller besidder) mere end 5 % af virksomheden og har til hensigt (eller har til hensigt at) aktivt at forfølge en ændring i forretningsstrategi. Skema 13G indikerer en passiv investering på over 5%.
The share price as of March 20, 2026 is 20,60 / share. Previously, on March 21, 2025, the share price was 20,56 / share. This represents an increase of 0,17% over that period.
Fondens stemningsscore
Fund Sentiment Score (fka Ownership Accumulation Score) finder de aktier, der bliver mest købt af fonde. Det er resultatet af en sofistikeret, multi-faktor kvantitativ model, der identificerer virksomheder med de højeste niveauer af institutionel akkumulering. Scoringsmodellen bruger en kombination af den samlede stigning i oplyste ejere, ændringerne i porteføljeallokeringer i disse ejere og andre målinger. Tallet går fra 0 til 100, hvor højere tal indikerer et højere niveau af akkumulering for sine jævnaldrende, og 50 er gennemsnittet.
Opdateringsfrekvens: Dagligt
Se Ownership Explorer, som giver en liste over højest rangerende virksomheder.
AI+ Ask Fintel’s AI assistant about Invesco Exchange-Traded Self-Indexed Fund Trust - Invesco BulletShares 2034 Corporate Bond ETF.
Select a question to share a public post with an AI-crafted answer.
Thinking of good questions…
Institutionel Put/Call-forhold
Ud over at indberette standardaktie- og gældsudstedelser skal institutter med mere end 100 mill. aktiver under forvaltning også oplyse deres put- og call-optionsbeholdninger. Da salgsoptioner generelt indikerer negativ stemning, og købsoptioner indikerer positiv stemning, kan vi få en fornemmelse af den overordnede institutionelle stemning ved at plotte forholdet mellem put og kald. Diagrammet til højre viser det historiske put/call-forhold for dette instrument.
Brug af Put/Call Ratio som en indikator for investorernes stemning overvinder en af de vigtigste mangler ved at bruge totalt institutionelt ejerskab, som er, at en betydelig mængde af aktiver under forvaltning investeres passivt for at spore indekser. Passivt forvaltede fonde køber typisk ikke optioner, så indikatoren for put/call-forholdet følger mere nøje følelsen af aktivt forvaltede fonde.
13F og NPORT arkivering
Detaljer om 13F-arkivering er gratis. Detaljer om NP-ansøgninger kræver et premium-medlemskab. Grønne rækker angiver nye positioner. Røde rækker angiver lukkede positioner. Klik på linket ikon for at se den fulde transaktionshistorik.
Opgrader
for at låse premium-data op og eksportere til Excel ![]() .
.
| Fil dato | Kilde | Investor | Type | Gennemsnitlig pris (Øst) |
Aktier | Δ Aktier (%) |
Rapporteret Værdi ($1000) |
Δ Værdi (%) |
Port Alloc (%) |
|
|---|---|---|---|---|---|---|---|---|---|---|
| 2026-02-17 | 13F | Jones Financial Companies Lllp | 279.436 | 95,56 | 5.874 | 96,16 | ||||
| 2026-02-13 | 13F | MAI Capital Management | 139.645 | 11,23 | 2.935 | 11,22 | ||||
| 2026-01-26 | 13F | Asset Dedication, LLC | 108.896 | 149,21 | 2.289 | 149,24 | ||||
| 2026-01-29 | 13F | Sanctuary Advisors, LLC | 152.057 | 9,95 | 3.196 | 9,94 | ||||
| 2026-02-09 | 13F | Smithfield Trust Co | 1.031 | 0,00 | 0 | |||||
| 2026-02-10 | 13F/A | Northwestern Mutual Wealth Management Co | 208.957 | 2,31 | 4.392 | 2,31 | ||||
| 2026-02-06 | 13F | Addison Advisors LLC | 245.014 | 22,65 | 5.150 | 22,68 | ||||
| 2026-02-11 | 13F | LPL Financial LLC | 1.073.606 | 25,99 | 22.567 | 25,99 | ||||
| 2026-02-17 | 13F | Ameriprise Financial Inc | 37.852 | 796 | ||||||
| 2025-11-13 | 13F | Fmr Llc | 0 | -100,00 | 0 | |||||
| 2026-02-10 | 13F | Ellevest, Inc. | 92.478 | 13,93 | 1.944 | 13,89 | ||||
| 2026-02-17 | 13F | Royal Bank Of Canada | 137.250 | 27,04 | 2.885 | 27,04 | ||||
| 2026-02-17 | 13F | Raymond James Financial Inc | 2.518.152 | 16,27 | 52.932 | 16,27 | ||||
| 2026-01-29 | 13F | Concurrent Investment Advisors, LLC | 10.048 | 211 | ||||||
| 2026-02-03 | 13F | International Assets Investment Management, Llc | 657 | 14 | ||||||
| 2026-02-13 | 13F | Aptus Capital Advisors, LLC | 1.738.078 | 36.534 | ||||||
| 2026-02-13 | 13F | Flow Traders U.s. Llc | 39.285 | -51,86 | 1 | -100,00 | ||||
| 2026-02-05 | 13F | Cambridge Investment Research Advisors, Inc. | 12.661 | 20,82 | 0 | |||||
| 2026-02-13 | 13F | Stifel Financial Corp | 22.884 | 16,64 | 481 | 16,75 | ||||
| 2026-02-13 | 13F | Wells Fargo & Company/mn | 851.096 | 55,35 | 17.890 | 55,36 | ||||
| 2026-02-05 | 13F | Stephens Inc /ar/ | 177.312 | 17,50 | 3.727 | 17,53 | ||||
| 2026-02-09 | 13F | Huntington National Bank | 139 | 25,45 | ||||||
| 2026-01-16 | 13F | Ledgewood Wealth Advisors, LLC | 202.180 | 0,33 | 4.250 | 0,31 | ||||
| 2026-02-13 | 13F | Mml Investors Services, Llc | 52.195 | 12,29 | 1.097 | 12,28 | ||||
| 2026-02-05 | 13F | Novare Capital Management Llc | 70.439 | 14,87 | 1.481 | 14,91 | ||||
| 2026-02-11 | 13F | Cookson Peirce & Co Inc | 504.697 | 3,82 | 10.609 | 3,82 | ||||
| 2026-01-29 | 13F | UBS Group AG | 49.170 | 46,17 | 1.034 | 46,11 | ||||
| 2026-01-26 | 13F | Farnam Financial LLC | 56.104 | 6,17 | 1.179 | 6,22 | ||||
| 2026-01-08 | 13F | Wealth Enhancement Advisory Services, Llc | 21.003 | 42,56 | 442 | 42,58 | ||||
| 2026-02-02 | 13F | Montag A & Associates Inc | 2.588 | 0,00 | 54 | 0,00 | ||||
| 2026-02-09 | 13F | Redmond Asset Management, LLC | 9.612 | 202 | ||||||
| 2026-02-11 | 13F | LeClair Wealth Partners LLC | 113.099 | 2.377 | ||||||
| 2026-01-12 | 13F | Tlwm | 0 | -100,00 | 0 | |||||
| 2026-02-09 | 13F | Sawgrass Asset Management Llc | 46.878 | 194,31 | 985 | 194,91 | ||||
| 2025-11-14 | 13F | Prosperity Wealth Management, Inc. | 13.375 | 281 | ||||||
| 2026-02-09 | 13F | Keating Financial Advisory Services, Inc. | 1.335 | 28 | ||||||
| 2026-01-20 | 13F | Independence Bank of Kentucky | 11.869 | 34,22 | 249 | 34,59 | ||||
| 2026-01-13 | 13F | Butensky & Cohen Financial Security, Inc | 62.089 | 10,57 | 1.305 | 10,59 | ||||
| 2026-02-17 | 13F | Advisor Group Holdings, Inc. | 105.099 | 39,96 | 2.209 | 41,42 | ||||
| 2026-02-17 | 13F | Advisory Services Network, LLC | 0 | -100,00 | 0 | |||||
| 2026-02-17 | 13F | Legacy Wealth Partners, LLC | 16.712 | 351 | ||||||
| 2026-02-10 | 13F | Gill Capital Partners, Llc | 226.880 | 11,17 | 4.769 | 11,17 | ||||
| 2026-02-17 | 13F | Bank Of America Corp /de/ | 150.573 | 24,69 | 3.165 | 24,70 | ||||
| 2026-02-10 | 13F | Envestnet Asset Management Inc | 81.647 | 26,81 | 1.716 | 26,83 | ||||
| 2026-02-02 | 13F | Truist Financial Corp | 87.951 | 402,09 | 1.849 | 402,17 | ||||
| 2026-02-13 | 13F | Kestra Advisory Services, LLC | 0 | -100,00 | 0 | |||||
| 2026-01-23 | 13F | G2 Capital Management, Llc / Oh | 48.723 | 1,16 | 1.024 | 1,19 | ||||
| 2026-02-17 | 13F | Wiley Bros.-aintree Capital, Llc | 9.977 | 210 | ||||||
| 2026-01-22 | 13F | Paradigm, Strategies in Wealth Management, LLC | 16.312 | 0,00 | 343 | 0,00 | ||||
| 2026-02-12 | 13F | Davis R M Inc | 13.785 | 290 | ||||||
| 2025-11-17 | 13F | Sterling Financial Group, Inc. | 23.730 | 499 | ||||||
| 2026-01-22 | 13F | Yarger Wealth Strategies, Llc | 0 | -100,00 | 0 | |||||
| 2026-01-30 | 13F | Kohmann Bosshard Financial Services, LLC | 2.989 | 63 | ||||||
| 2026-02-17 | 13F | Susquehanna International Group, Llp | 0 | -100,00 | 0 | |||||
| 2026-01-02 | 13F | Global Wealth Strategies & Associates | 15.725 | -19,59 | 331 | -19,71 | ||||
| 2026-02-04 | 13F | MONECO Advisors, LLC | 86.137 | -11,99 | 1.811 | -12,01 | ||||
| 2026-01-26 | 13F | Private Trust Co Na | 1.178 | 0,00 | 25 | 0,00 | ||||
| 2026-01-28 | 13F | Davis Capital Management | 5.951 | -4,95 | 125 | -4,58 | ||||
| 2026-02-13 | 13F | Morgan Stanley | 518.972 | 14,21 | 10.909 | 14,21 | ||||
| 2026-02-09 | 13F | Diversified Portfolios, Inc. | 14.036 | 295 | ||||||
| 2026-02-05 | 13F | Atria Investments Llc | 139.439 | 9,83 | 2.931 | 9,86 | ||||
| 2026-02-09 | 13F | Knights of Columbus Asset Advisors LLC | 4.774 | 0,00 | 100 | 0,00 | ||||
| 2026-02-02 | 13F | Oppenheimer & Co Inc | 0 | -100,00 | 0 | |||||
| 2026-02-10 | 13F | Goldman Sachs Group Inc | 71.612 | 0,00 | 1.505 | 0,00 | ||||
| 2026-02-09 | 13F | Allen Capital Group, LLC | 15.102 | 19,07 | 317 | 19,17 | ||||
| 2026-02-17 | 13F | TCG Advisory Services, LLC | 67.800 | -8,16 | 1.425 | -8,12 | ||||
| 2026-02-11 | 13F | First Command Advisory Services, Inc. | 10.085 | 6,80 | 212 | 6,57 | ||||
| 2026-02-12 | 13F | Jane Street Group, Llc | 0 | -100,00 | 0 | |||||
| 2026-02-17 | 13F | Equitable Holdings, Inc. | 277.455 | 7,46 | 5.832 | 7,46 | ||||
| 2026-01-15 | 13F | Infinity Wealth Counsel, LLC | 89.710 | 225,99 | 1.886 | 226,12 | ||||
| 2026-02-13 | 13F | River Wealth Advisors LLC | 35.428 | 36,20 | 745 | 36,26 | ||||
| 2026-01-21 | 13F | Wilkins Miller Wealth Management, LLC | 23.128 | 63,66 | 486 | 63,64 | ||||
| 2026-02-13 | 13F | Jacobi Capital Management LLC | 13.832 | 10,48 | 291 | 10,27 | ||||
| 2026-01-20 | 13F | YANKCOM Partnership | 14.569 | 64,32 | 306 | 64,52 | ||||
| 2026-01-16 | 13F | Marquette Asset Management, LLC | 4.668 | 7,88 | 98 | 8,89 | ||||
| 2026-02-03 | 13F | Sequoia Financial Advisors, LLC | 23.730 | 499 | ||||||
| 2026-02-10 | 13F | Opulen Financial Group LLC | 16.674 | 1,16 | 350 | 1,16 | ||||
| 2026-02-19 | 13F | Invesco Ltd. | 831.500 | 5,99 | 17.478 | 5,99 | ||||
| 2026-02-12 | 13F | Steward Partners Investment Advisory, Llc | 3.384 | -6,21 | 71 | -5,33 | ||||
| 2026-02-17 | 13F | Modern Wealth Management, LLC | 118.448 | 541,47 | 2.490 | 541,49 | ||||
| 2026-01-28 | 13F | Hobbs Group Advisors, LLC | 19.670 | 1,13 | 413 | 1,23 | ||||
| 2026-02-17 | 13F | Captrust Financial Advisors | 20.867 | 66,13 | 439 | 65,91 | ||||
| 2026-02-18 | 13F | Beacon Pointe Advisors, LLC | 12.472 | 1,19 | 262 | 1,16 | ||||
| 2026-01-27 | 13F | Clark Asset Management, LLC | 260.494 | 27,78 | 5.476 | 27,77 | ||||
| 2026-02-12 | 13F | Commonwealth Equity Services, Llc | 36.612 | 5,17 | 770 | |||||
| 2026-02-17 | 13F | Cetera Investment Advisers | 113.361 | -53,64 | 2.383 | -53,66 | ||||
| 2026-01-29 | 13F | Golden Reserve Retirement LLC | 21.590 | 454 | ||||||
| 2026-01-22 | 13F | ETF Store, Inc. | 10.655 | 3,58 | 224 | 3,24 | ||||
| 2026-02-09 | 13F | Carroll Advisory Group, LLC | 81.258 | 1.708 | ||||||
| 2026-02-11 | 13F | J.w. Cole Advisors, Inc. | 47.628 | 3,00 | 1.001 | 3,09 | ||||
| 2026-01-26 | 13F | BCS Wealth Management | 666.220 | 124,10 | 14.004 | 124,12 | ||||
| 2026-02-17 | 13F | Citadel Advisors Llc | 33.448 | -40,26 | 703 | -40,22 | ||||
| 2026-02-17 | 13F | Private Advisor Group, LLC | 66.486 | 4,35 | 1.398 | 4,33 | ||||
| 2026-01-29 | 13F | Kestra Private Wealth Services, Llc | 11.177 | 235 | ||||||
| 2026-02-11 | 13F | Jpmorgan Chase & Co | 168.164 | 82,88 | 3.535 | 82,92 |