Grundlæggende statistik
| Institutionelle ejere | 113 total, 113 long only, 0 short only, 0 long/short - change of -2,59% MRQ |
| Gennemsnitlig porteføljeallokering | 0.0496 % - change of -27,59% MRQ |
| Institutionelle aktier (lange) | 20.441.435 (ex 13D/G) - change of -2,09MM shares -9,28% MRQ |
| Institutionel værdi (lang) | $ 233.908 USD ($1000) |
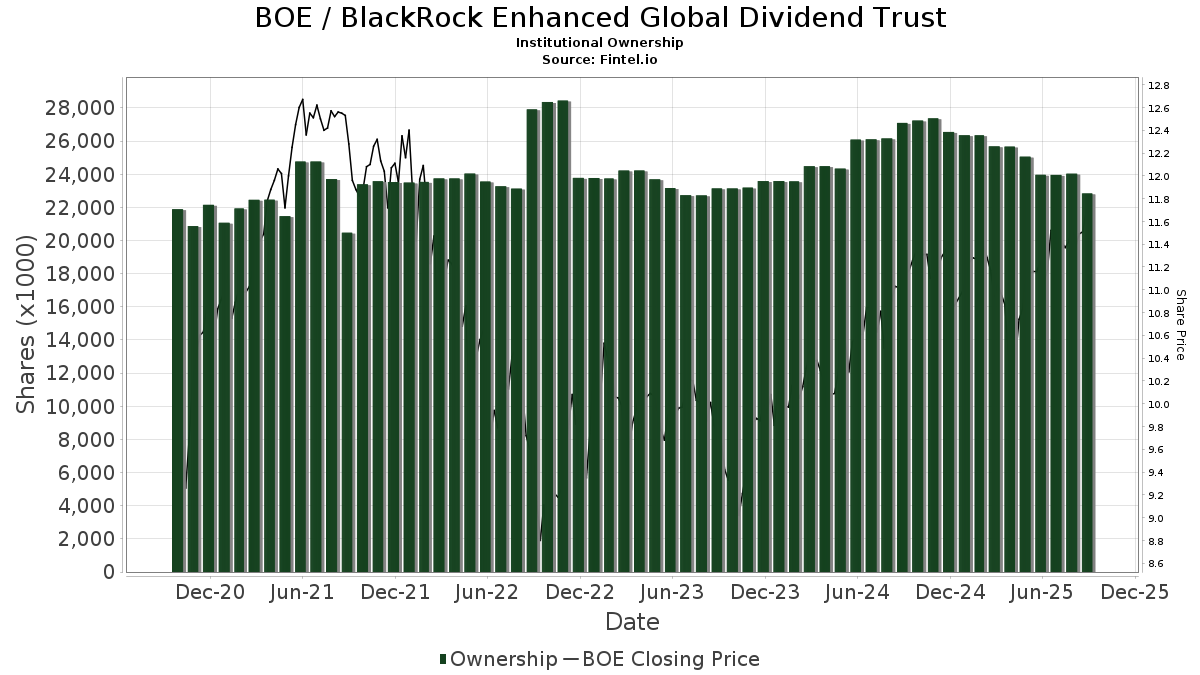
Institutionelt ejerskab og aktionærer
BlackRock Enhanced Global Dividend Trust (US:BOE) har 113 institutionelle ejere og aktionærer, der har indsendt 13D/G- eller 13F-formularer til Securities Exchange Commission (SEC). Disse institutioner har i alt 20,441,435 aktier. Største aktionærer omfatter Morgan Stanley, Saba Capital Management, L.P., Guggenheim Capital Llc, Advisors Asset Management, Inc., Lazard Asset Management Llc, Invesco Ltd., Wells Fargo & Company/mn, Raymond James Financial Inc, LPL Financial LLC, and Allspring Global Investments Holdings, LLC .
BlackRock Enhanced Global Dividend Trust (NYSE:BOE) institutionel ejerskabsstruktur viser aktuelle positioner i virksomheden efter institutioner og fonde, samt seneste ændringer i positionsstørrelse. Større aktionærer kan omfatte individuelle investorer, investeringsforeninger, hedgefonde eller institutioner. Skema 13D angiver, at investoren besidder (eller besidder) mere end 5 % af virksomheden og har til hensigt (eller har til hensigt at) aktivt at forfølge en ændring i forretningsstrategi. Skema 13G indikerer en passiv investering på over 5%.
The share price as of March 27, 2026 is 10,64 / share. Previously, on March 31, 2025, the share price was 10,85 / share. This represents a decline of 1,94% over that period.
Fondens stemningsscore
Fund Sentiment Score (fka Ownership Accumulation Score) finder de aktier, der bliver mest købt af fonde. Det er resultatet af en sofistikeret, multi-faktor kvantitativ model, der identificerer virksomheder med de højeste niveauer af institutionel akkumulering. Scoringsmodellen bruger en kombination af den samlede stigning i oplyste ejere, ændringerne i porteføljeallokeringer i disse ejere og andre målinger. Tallet går fra 0 til 100, hvor højere tal indikerer et højere niveau af akkumulering for sine jævnaldrende, og 50 er gennemsnittet.
Opdateringsfrekvens: Dagligt
Se Ownership Explorer, som giver en liste over højest rangerende virksomheder.
AI+ Ask Fintel’s AI assistant about BlackRock Enhanced Global Dividend Trust.
Select a question to share a public post with an AI-crafted answer.
Thinking of good questions…
Institutionel Put/Call-forhold
Ud over at indberette standardaktie- og gældsudstedelser skal institutter med mere end 100 mill. aktiver under forvaltning også oplyse deres put- og call-optionsbeholdninger. Da salgsoptioner generelt indikerer negativ stemning, og købsoptioner indikerer positiv stemning, kan vi få en fornemmelse af den overordnede institutionelle stemning ved at plotte forholdet mellem put og kald. Diagrammet til højre viser det historiske put/call-forhold for dette instrument.
Brug af Put/Call Ratio som en indikator for investorernes stemning overvinder en af de vigtigste mangler ved at bruge totalt institutionelt ejerskab, som er, at en betydelig mængde af aktiver under forvaltning investeres passivt for at spore indekser. Passivt forvaltede fonde køber typisk ikke optioner, så indikatoren for put/call-forholdet følger mere nøje følelsen af aktivt forvaltede fonde.
13D/G-arkivering
Vi præsenterer 13D/G ansøgninger separat fra 13F ansøgninger på grund af den forskellige behandling af SEC. 13D/G-ansøgninger kan indgives af grupper af investorer (med én ledende), hvorimod 13F-ansøgninger ikke kan. Dette resulterer i situationer, hvor en investor kan indsende en 13D/G, der rapporterer én værdi for de samlede aktier (der repræsenterer alle de aktier, der ejes af investorgruppen), men derefter indsender en 13F, der rapporterer en anden værdi for de samlede aktier (der udelukkende repræsenterer deres egne) ejendomsret). Det betyder, at aktieejerskab af 13D/G-arkiver og 13F-arkiveringer ofte ikke er direkte sammenlignelige, så vi præsenterer dem separat.
Bemærk: Fra den 16. maj 2021 viser vi ikke længere ejere, der ikke har indsendt en 13D/G inden for det seneste år. Tidligere viste vi den fulde historie af 13D/G-arkiver. Generelt skal enheder, der er forpligtet til at indgive 13D/G-ansøgninger, indgive mindst årligt, før de indsender en afsluttende ansøgning. Dog forlader fonde nogle gange positioner uden at indsende en afsluttende ansøgning (dvs. de afvikler), så visning af den fulde historie resulterede nogle gange i forvirring om det nuværende ejerskab. For at undgå forvirring viser vi nu kun 'aktuelle' ejere - det vil sige - ejere, der har anmeldt inden for det seneste år.
Upgrade to unlock premium data.
| Fil dato | Form | Investor | Forrige Aktier |
Seneste Aktier |
Δ Aktier (Procent) |
Ejendomsret (Procent) |
Δ Ejerskab (Procent) |
|
|---|---|---|---|---|---|---|---|---|
| 2026-01-27 | FIRST TRUST PORTFOLIOS LP | 2,767,811 | 2,827,629 | 2.16 | 5.09 | 7.61 | ||
| 2025-05-05 | MORGAN STANLEY | 4,935,817 | 2,891,173 | -41.42 | 5.10 | -37.80 |
13F og NPORT arkivering
Detaljer om 13F-arkivering er gratis. Detaljer om NP-ansøgninger kræver et premium-medlemskab. Grønne rækker angiver nye positioner. Røde rækker angiver lukkede positioner. Klik på linket ikon for at se den fulde transaktionshistorik.
Opgrader
for at låse premium-data op og eksportere til Excel ![]() .
.
| Fil dato | Kilde | Investor | Type | Gennemsnitlig pris (Øst) |
Aktier | Δ Aktier (%) |
Rapporteret Værdi ($1000) |
Δ Værdi (%) |
Port Alloc (%) |
|
|---|---|---|---|---|---|---|---|---|---|---|
| 2026-01-13 | 13F | CoreCap Advisors, LLC | 3.075 | 0,00 | 36 | 2,86 | ||||
| 2026-02-10 | 13F | Moors & Cabot, Inc. | 12.410 | 5,78 | 145 | 7,41 | ||||
| 2026-02-09 | 13F | Harbour Investments, Inc. | 5.028 | 12.792,31 | 59 | |||||
| 2026-02-13 | 13F | Kestra Advisory Services, LLC | 0 | -100,00 | 0 | |||||
| 2026-02-17 | 13F | IHT Wealth Management, LLC | 67.557 | -9,51 | 791 | -8,34 | ||||
| 2026-02-17 | 13F | Snowden Capital Advisors LLC | 17.347 | 203 | ||||||
| 2025-11-14 | 13F | Ancora Advisors, LLC | 0 | -100,00 | 0 | |||||
| 2026-02-17 | 13F | Abel Hall, LLC | 33.000 | 0,00 | 386 | 1,31 | ||||
| 2026-01-29 | 13F | D.a. Davidson & Co. | 140.898 | 4,22 | 1.650 | 5,43 | ||||
| 2026-02-09 | 13F | Blue Bell Private Wealth Management, Llc | 56.280 | 40,78 | 659 | 42,64 | ||||
| 2026-02-06 | 13F | Axxcess Wealth Management, Llc | 11.956 | 0,48 | 140 | 2,19 | ||||
| 2026-02-06 | 13F | Global Retirement Partners, LLC | 19.462 | 228 | ||||||
| 2026-01-13 | 13F | Dakota Wealth Management | 45.117 | -0,35 | 528 | 0,96 | ||||
| 2025-11-14 | 13F | Colony Group, LLC | 0 | -100,00 | 0 | -100,00 | ||||
| 2026-01-26 | 13F | Merit Financial Group, LLC | 24.379 | 7,83 | 285 | 9,20 | ||||
| 2026-02-13 | 13F | Stifel Financial Corp | 38.191 | -6,84 | 447 | -5,70 | ||||
| 2026-02-17 | 13F | Decision Investments, Inc | 13.750 | 161 | ||||||
| 2026-02-12 | 13F | Brown Brothers Harriman & Co | 37.955 | 0,00 | 444 | 1,14 | ||||
| 2026-01-23 | 13F | Rsm Us Wealth Management Llc | 27.858 | 10,03 | 331 | 13,01 | ||||
| 2026-01-05 | 13F | Chesapeake Asset Management Llc | 0 | -100,00 | 0 | -100,00 | ||||
| 2026-02-11 | 13F | LPL Financial LLC | 456.636 | -4,68 | 5.347 | -3,52 | ||||
| 2026-02-10 | 13F | Envestnet Asset Management Inc | 163.216 | 9,85 | 1.911 | 11,17 | ||||
| 2026-01-16 | 13F | Ronald Blue Trust, Inc. | 32.190 | 377 | ||||||
| 2026-02-17 | 13F | Saba Capital Management, L.P. | 2.555.063 | 6,70 | 29.920 | 8,00 | ||||
| 2026-02-13 | 13F | Kilter Group LLC | 1.376 | -7,03 | 16 | -5,88 | ||||
| 2026-03-03 | 13F | NWF Advisory Services Inc. | 31.995 | -5,69 | 375 | -4,59 | ||||
| 2026-02-09 | 13F | Accredited Investor Services, Llc | 15.229 | 27,60 | 178 | 28,99 | ||||
| 2026-01-29 | 13F | Comerica Bank | 61.975 | -1,01 | 726 | 0,14 | ||||
| 2025-11-07 | 13F | Atticus Wealth Management, Llc | 0 | -100,00 | 0 | |||||
| 2026-01-30 | 13F | North Star Investment Management Corp. | 275 | 0,00 | 3 | 0,00 | ||||
| 2026-02-17 | 13F | Private Advisor Group, LLC | 119.751 | -1,47 | 1.402 | -0,28 | ||||
| 2026-02-17 | 13F | Readystate Asset Management Lp | 57.882 | 9,95 | 678 | 11,17 | ||||
| 2026-01-26 | 13F | Cwm, Llc | 1.047 | 0,00 | 0 | |||||
| 2026-01-26 | 13F | Shaker Financial Services, LLC | 174.071 | -2,46 | 2.038 | -1,26 | ||||
| 2026-02-05 | 13F | Cambridge Investment Research Advisors, Inc. | 70.034 | -3,94 | 1 | |||||
| 2026-02-10 | 13F/A | Northwestern Mutual Wealth Management Co | 500 | 6 | ||||||
| 2026-02-13 | 13F | Vivaldi Capital Management, LLC | 12.950 | 0,00 | 152 | 1,34 | ||||
| 2026-01-14 | 13F | Jfs Wealth Advisors, Llc | 168 | 2 | ||||||
| 2026-02-09 | 13F | Illumine Investment Management, LLC | 12.974 | 0,00 | 152 | 0,67 | ||||
| 2026-01-08 | 13F | Integrated Capital Management, Inc. | 24.829 | 27,36 | 291 | 28,89 | ||||
| 2026-02-12 | 13F | Sit Investment Associates Inc | 0 | -100,00 | 0 | |||||
| 2025-11-14 | 13F | Cnh Partners Llc | 0 | -100,00 | 0 | -100,00 | ||||
| 2026-02-12 | 13F | Commonwealth Equity Services, Llc | 37.713 | -6,46 | 442 | |||||
| 2026-01-26 | 13F | Nations Financial Group Inc, /ia/ /adv | 40.130 | 0,00 | 470 | 1,08 | ||||
| 2026-02-17 | 13F | Ameriprise Financial Inc | 70.068 | -0,12 | 820 | 1,11 | ||||
| 2026-02-17 | 13F | Royal Bank Of Canada | 259.054 | -4,68 | 3.034 | -3,50 | ||||
| 2026-02-09 | 13F | Pacific Wealth Strategies Group, Inc. | 10.000 | 0,00 | 117 | 1,74 | ||||
| 2026-01-23 | 13F | Farther Finance Advisors, LLC | 930 | 0,00 | 11 | 0,00 | ||||
| 2026-01-08 | 13F | Wealth Enhancement Advisory Services, Llc | 13.395 | 2,00 | 159 | 2,60 | ||||
| 2026-02-24 | 13F | Avory & Company, LLC | 46.196 | 0,00 | 541 | 1,12 | ||||
| 2026-01-27 | 13F | Jackson, Grant Investment Advisers, Inc. | 7.365 | 0,70 | 86 | 2,38 | ||||
| 2026-02-05 | 13F | Thrivent Financial For Lutherans | 165.535 | 7,82 | 2 | 0,00 | ||||
| 2026-02-17 | 13F | Lazard Asset Management Llc | 888.386 | 247,27 | 10.403 | 251,57 | ||||
| 2026-02-17 | 13F | Bank Of America Corp /de/ | 191.950 | -9,83 | 2.248 | -8,77 | ||||
| 2025-11-14 | 13F | Wetherby Asset Management Inc | 0 | -100,00 | 0 | |||||
| 2026-02-13 | 13F | Mml Investors Services, Llc | 12.399 | 145 | ||||||
| 2026-02-06 | 13F | VSM Wealth Advisory, LLC | 8.219 | 1,58 | 96 | 3,23 | ||||
| 2026-02-12 | 13F | Jane Street Group, Llc | 17.025 | 7,54 | 199 | 8,74 | ||||
| 2026-02-02 | 13F | Ashton Thomas Securities, Llc | 17.750 | 0,00 | 208 | 0,98 | ||||
| 2026-02-18 | 13F | GWM Advisors LLC | 21.386 | -7,66 | 250 | -6,37 | ||||
| 2026-01-28 | 13F | WPG Advisers, LLC | 3.156 | 4,37 | 37 | 5,88 | ||||
| 2026-02-09 | 13F | Kingsview Wealth Management, LLC | 10.065 | 0,00 | 118 | 0,86 | ||||
| 2026-02-06 | 13F | Larson Financial Group LLC | 673 | 2,12 | 8 | 0,00 | ||||
| 2026-02-14 | 13F | Rockefeller Capital Management L.P. | 55.971 | 1,19 | 655 | 2,50 | ||||
| 2026-02-12 | 13F | Hollencrest Capital Management | 13.569 | 0,00 | 159 | 1,28 | ||||
| 2026-02-13 | 13F | Integrated Wealth Concepts LLC | 15.120 | -0,06 | 177 | 1,14 | ||||
| 2026-02-12 | 13F | Marex Group plc | 19.781 | 1,42 | 232 | 2,67 | ||||
| 2026-02-04 | 13F | Ameritas Advisory Services, LLC | 32.310 | 3,38 | 378 | 4,71 | ||||
| 2026-02-17 | 13F | 1607 Capital Partners, LLC | 0 | -100,00 | 0 | |||||
| 2026-02-13 | 13F | Mariner, LLC | 19.879 | -6,61 | 233 | -5,69 | ||||
| 2026-02-17 | 13F | Advisor Group Holdings, Inc. | 127.221 | 8,95 | 1.490 | 10,54 | ||||
| 2026-02-02 | 13F | Oppenheimer & Co Inc | 0 | -100,00 | 0 | |||||
| 2025-11-14 | 13F | Balyasny Asset Management Llc | 0 | -100,00 | 0 | |||||
| 2025-11-12 | 13F | Park Square Financial Group, LLC | 0 | -100,00 | 0 | |||||
| 2025-11-14 | 13F | Virtu Financial LLC | 0 | -100,00 | 0 | |||||
| 2026-02-13 | 13F | National Bank Of Canada /fi/ | 5 | 0 | ||||||
| 2026-02-13 | 13F | Pinnacle Wealth Planning Services, Inc. | 8.362 | 98 | ||||||
| 2026-01-12 | 13F | Stolper Co | 63.805 | 1,20 | 1 | |||||
| 2026-02-17 | 13F | Wiley Bros.-aintree Capital, Llc | 90.774 | 6,83 | 1.063 | 8,04 | ||||
| 2026-02-11 | 13F | Closed-End Fund Advisors, Inc. | 50.822 | 595 | ||||||
| 2026-01-23 | 13F | Assetmark, Inc | 288 | 0,00 | 3 | 0,00 | ||||
| 2026-02-12 | 13F | Advisors Asset Management, Inc. | 1.010.603 | 17,73 | 11.834 | 19,16 | ||||
| 2026-02-17 | 13F | Advisory Services Network, LLC | 0 | -100,00 | 0 | |||||
| 2025-10-22 | 13F | Geneos Wealth Management Inc. | 0 | -100,00 | 0 | -100,00 | ||||
| 2026-02-11 | 13F | Janney Montgomery Scott LLC | 17.270 | 18,97 | 0 | |||||
| 2026-02-17 | 13F | Guggenheim Capital Llc | 1.148.096 | 13,59 | 13.444 | 14,96 | ||||
| 2026-02-06 | 13F | Pnc Financial Services Group, Inc. | 17.808 | -19,21 | 209 | -18,43 | ||||
| 2026-02-04 | 13F | Ballast Rock Private Wealth LLC | 12.346 | 145 | ||||||
| 2026-01-23 | 13F | Private Wealth Management Group, LLC | 110 | 1 | ||||||
| 2026-01-29 | 13F | UBS Group AG | 150.583 | -11,87 | 1.763 | -10,78 | ||||
| 2026-02-02 | 13F | Wolverine Asset Management Llc | 214.519 | 39,08 | 2.512 | 40,81 | ||||
| 2026-01-28 | 13F | PMG Family Office LLC | 13.324 | -24,93 | 156 | -23,90 | ||||
| 2026-01-14 | 13F | Centurion Wealth Management LLC | 86.530 | -1,54 | 1.013 | -0,30 | ||||
| 2026-02-06 | 13F | IFP Advisors, Inc | 4.622 | -38,55 | 54 | -37,93 | ||||
| 2026-02-13 | 13F | Commerce Bank | 11.329 | 10,60 | 133 | 11,86 | ||||
| 2026-02-17 | 13F | Equitable Holdings, Inc. | 26.731 | -10,80 | 313 | -9,54 | ||||
| 2026-02-12 | 13F | Wedbush Securities Inc | 19.079 | -8,23 | 0 | |||||
| 2026-01-30 | 13F | Us Bancorp \de\ | 4.407 | 2,37 | 52 | 4,08 | ||||
| 2026-02-17 | 13F | Evolve Private Wealth, Llc | 98.626 | 1.155 | ||||||
| 2026-02-13 | 13F | Arkadios Wealth Advisors | 74.960 | 0,11 | 878 | 1,27 | ||||
| 2026-01-12 | 13F | Uhlmann Price Securities, Llc | 26.785 | 5,81 | 314 | 7,19 | ||||
| 2026-02-13 | 13F | Karpus Management, Inc. | 0 | -100,00 | 0 | |||||
| 2026-01-29 | 13F | Nbc Securities, Inc. | 193.570 | 6,88 | 2.267 | 8,16 | ||||
| 2026-02-17 | 13F | Tower Research Capital LLC (TRC) | 0 | -100,00 | 0 | |||||
| 2026-01-21 | 13F | Crews Bank & Trust | 1.760 | 0,00 | 21 | 0,00 | ||||
| 2026-02-12 | 13F | Kovack Advisors, Inc. | 17.067 | 201 | ||||||
| 2025-11-14 | 13F | Elequin Capital Lp | 0 | -100,00 | 0 | -100,00 | ||||
| 2026-01-12 | 13F | Sax Wealth Advisors, Llc | 85.274 | 999 | ||||||
| 2026-01-15 | 13F | Allspring Global Investments Holdings, LLC | 325.848 | 24,08 | 3.816 | 25,58 | ||||
| 2026-02-13 | 13F | Wells Fargo & Company/mn | 774.100 | 1,39 | 9.065 | 2,62 | ||||
| 2026-02-17 | 13F | one8zero8, LLC | 50.000 | 0,00 | 586 | 1,21 | ||||
| 2026-02-17 | 13F | Raymond James Financial Inc | 637.337 | 7,83 | 7.463 | 9,14 | ||||
| 2026-02-13 | 13F | MAI Capital Management | 520 | 0,00 | 6 | 0,00 | ||||
| 2026-02-17 | 13F | Modern Wealth Management, LLC | 11.023 | -2,95 | 129 | -1,53 | ||||
| 2026-02-12 | 13F | Founders Financial Alliance, LLC | 13.576 | 13,75 | 159 | 14,49 | ||||
| 2026-02-17 | 13F | Cetera Investment Advisers | 83.074 | 10,30 | 973 | 11,60 | ||||
| 2026-01-23 | 13F | Webster Bank, N. A. | 6.000 | 70 | ||||||
| 2026-02-05 | 13F | Allworth Financial LP | 1.983 | 198.200,00 | 23 | |||||
| 2026-02-05 | 13F | AlphaCore Capital LLC | 69.732 | -5,36 | 817 | -4,23 | ||||
| 2026-02-13 | 13F | Morgan Stanley | 7.519.901 | 3,02 | 88.058 | 4,27 | ||||
| 2026-02-19 | 13F | Invesco Ltd. | 782.327 | -8,27 | 9.161 | -7,16 | ||||
| 2026-02-13 | 13F | Pathstone Holdings, LLC | 59.331 | -85,27 | 695 | -85,11 | ||||
| 2026-02-12 | 13F | BRYN MAWR TRUST Co | 125 | 0,00 | 1 | 0,00 | ||||
| 2026-02-13 | 13F | Level Four Advisory Services, Llc | 10.491 | 123 | ||||||
| 2026-02-12 | 13F | Steward Partners Investment Advisory, Llc | 30.973 | 0,00 | 363 | 1,12 | ||||
| 2026-02-17 | 13F | Warren Averett Asset Management, LLC | 19.617 | -0,48 | 230 | 0,44 | ||||
| 2026-01-22 | 13F | Spirepoint Private Client, Llc | 11.156 | 0,00 | 131 | 0,78 | ||||
| 2026-01-22 | 13F | Pinnacle Bancorp, Inc. | 1.500 | -76,19 | 18 | -76,39 | ||||
| 2026-01-05 | 13F | Park Avenue Securities Llc | 126.171 | 5,93 | 1 | 0,00 | ||||
| 2026-01-21 | 13F | Sound Income Strategies, LLC | 5.525 | 0,00 | 66 | 1,56 | ||||
| 2025-11-14 | 13F | Walleye Capital LLC | 0 | -100,00 | 0 |