Grundlæggende statistik
| Institutionelle ejere | 103 total, 103 long only, 0 short only, 0 long/short - change of 10,75% MRQ |
| Gennemsnitlig porteføljeallokering | 0.4806 % - change of 76,26% MRQ |
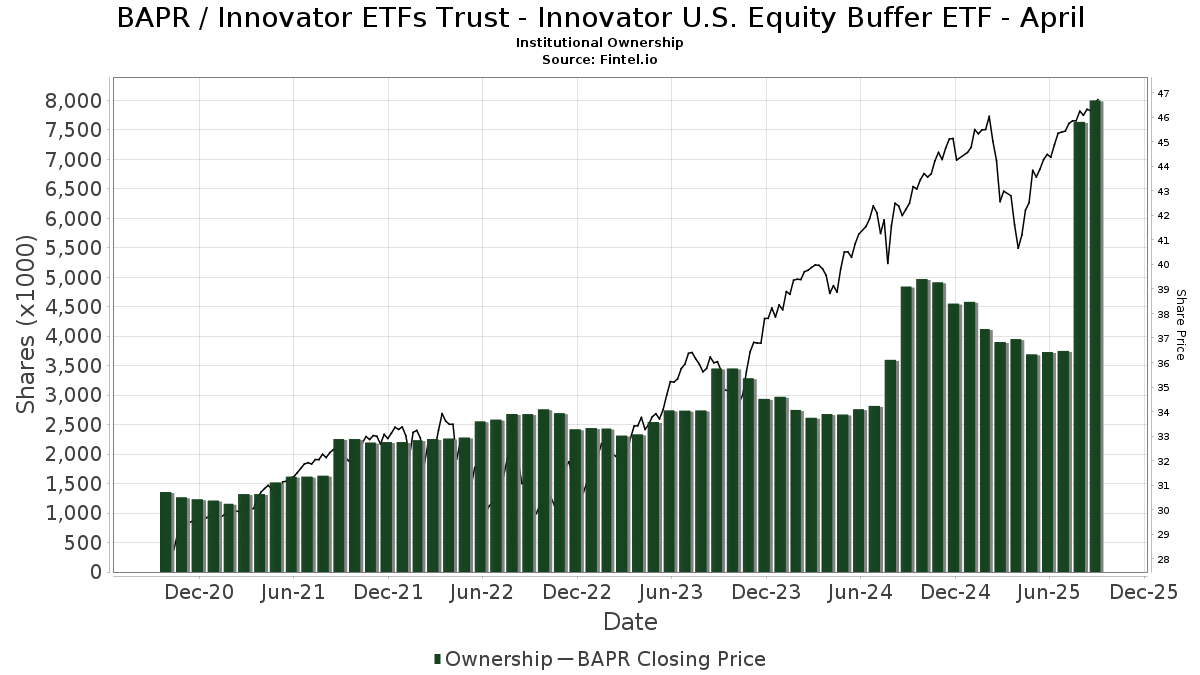
| Institutionelle aktier (lange) | 7.997.300 (ex 13D/G) - change of 4,26MM shares 114,23% MRQ |
| Institutionel værdi (lang) | $ 315.387 USD ($1000) |
Institutionelt ejerskab og aktionærer
Innovator ETFs Trust - Innovator U.S. Equity Buffer ETF - April (US:BAPR) har 103 institutionelle ejere og aktionærer, der har indsendt 13D/G- eller 13F-formularer til Securities Exchange Commission (SEC). Disse institutioner har i alt 7,997,300 aktier. Største aktionærer omfatter Stuart Chaussee & Associates, Inc., Gradient Investments LLC, Brookstone Capital Management, Commonwealth Equity Services, Llc, Innovator ETFs Trust - Innovator Laddered Allocation Buffer ETF, Penserra Capital Management LLC, Cerity Partners LLC, Integral Investment Advisors, Inc., Raymond James Financial Inc, and HighTower Advisors, LLC .
Innovator ETFs Trust - Innovator U.S. Equity Buffer ETF - April (BATS:BAPR) institutionel ejerskabsstruktur viser aktuelle positioner i virksomheden efter institutioner og fonde, samt seneste ændringer i positionsstørrelse. Større aktionærer kan omfatte individuelle investorer, investeringsforeninger, hedgefonde eller institutioner. Skema 13D angiver, at investoren besidder (eller besidder) mere end 5 % af virksomheden og har til hensigt (eller har til hensigt at) aktivt at forfølge en ændring i forretningsstrategi. Skema 13G indikerer en passiv investering på over 5%.
The share price as of September 12, 2025 is 46,71 / share. Previously, on September 16, 2024, the share price was 42,62 / share. This represents an increase of 9,59% over that period.
Fondens stemningsscore
Fund Sentiment Score (fka Ownership Accumulation Score) finder de aktier, der bliver mest købt af fonde. Det er resultatet af en sofistikeret, multi-faktor kvantitativ model, der identificerer virksomheder med de højeste niveauer af institutionel akkumulering. Scoringsmodellen bruger en kombination af den samlede stigning i oplyste ejere, ændringerne i porteføljeallokeringer i disse ejere og andre målinger. Tallet går fra 0 til 100, hvor højere tal indikerer et højere niveau af akkumulering for sine jævnaldrende, og 50 er gennemsnittet.
Opdateringsfrekvens: Dagligt
Se Ownership Explorer, som giver en liste over højest rangerende virksomheder.
Institutionel Put/Call-forhold
Ud over at indberette standardaktie- og gældsudstedelser skal institutter med mere end 100 mill. aktiver under forvaltning også oplyse deres put- og call-optionsbeholdninger. Da salgsoptioner generelt indikerer negativ stemning, og købsoptioner indikerer positiv stemning, kan vi få en fornemmelse af den overordnede institutionelle stemning ved at plotte forholdet mellem put og kald. Diagrammet til højre viser det historiske put/call-forhold for dette instrument.
Brug af Put/Call Ratio som en indikator for investorernes stemning overvinder en af de vigtigste mangler ved at bruge totalt institutionelt ejerskab, som er, at en betydelig mængde af aktiver under forvaltning investeres passivt for at spore indekser. Passivt forvaltede fonde køber typisk ikke optioner, så indikatoren for put/call-forholdet følger mere nøje følelsen af aktivt forvaltede fonde.
13F og NPORT arkivering
Detaljer om 13F-arkivering er gratis. Detaljer om NP-ansøgninger kræver et premium-medlemskab. Grønne rækker angiver nye positioner. Røde rækker angiver lukkede positioner. Klik på linket ikon for at se den fulde transaktionshistorik.
Opgrader
for at låse premium-data op og eksportere til Excel ![]() .
.
| Fil dato | Kilde | Investor | Type | Gennemsnitlig pris (Øst) |
Aktier | Δ Aktier (%) |
Rapporteret Værdi ($1000) |
Δ Værdi (%) |
Port Alloc (%) |
|
|---|---|---|---|---|---|---|---|---|---|---|
| 2025-05-15 | 13F | Hrt Financial Lp | 0 | -100,00 | 0 | |||||
| 2025-08-11 | 13F | WPWealth LLP | 12.861 | 0,00 | 581 | 6,41 | ||||
| 2025-08-15 | 13F | Morgan Stanley | 1.763 | 0,00 | 80 | 6,76 | ||||
| 2025-07-23 | 13F | Motiv8 Investments LLC | 56.247 | 4,77 | 2.542 | 11,45 | ||||
| 2025-07-22 | 13F | Belpointe Asset Management LLC | 51.231 | 4,07 | 2.315 | 10,77 | ||||
| 2025-08-14 | 13F | Sunbelt Securities, Inc. | 48.645 | 2.238,70 | 2.155 | 2.348,86 | ||||
| 2025-08-14 | 13F | CoreCap Advisors, LLC | 6.808 | -0,04 | 308 | 6,23 | ||||
| 2025-08-14 | 13F | Beck Capital Management, Llc | 6.723 | -0,16 | 304 | 6,32 | ||||
| 2025-07-22 | 13F | Berkshire Money Management, Inc. | 21.374 | 0,00 | 966 | 6,39 | ||||
| 2025-05-15 | 13F | CAPROCK Group, Inc. | 0 | -100,00 | 0 | |||||
| 2025-08-14 | 13F | Colony Group, LLC | 8.600 | 0,00 | 389 | 6,30 | ||||
| 2025-08-01 | 13F | FSA Advisors, Inc. | 17.036 | 16,67 | 770 | 8,62 | ||||
| 2025-04-29 | 13F | Pensionmark Financial Group, Llc | 0 | -100,00 | 0 | |||||
| 2025-08-04 | 13F | Arkadios Wealth Advisors | 21.595 | 976 | ||||||
| 2025-08-07 | 13F | Runnymede Capital Advisors, Inc. | 0 | -100,00 | 0 | |||||
| 2025-08-12 | 13F | LPL Financial LLC | 155.282 | 11,08 | 7.017 | 18,19 | ||||
| 2025-07-30 | 13F | Brookstone Capital Management | 553.510 | 3.197,06 | 25.012 | 3.412,78 | ||||
| 2025-08-07 | 13F | Allworth Financial LP | 1.356 | 0,00 | 61 | 8,93 | ||||
| 2025-08-01 | 13F | Integral Investment Advisors, Inc. | 270.738 | 3,20 | 12.234 | 9,81 | ||||
| 2025-08-01 | 13F | Corrado Advisors, Llc | 4.653 | 210 | ||||||
| 2025-05-19 | 13F/A | Jane Street Group, Llc | 0 | -100,00 | 0 | -100,00 | ||||
| 2025-07-15 | 13F | Armis Advisers, LLC | 28.834 | 2,77 | 1.303 | 9,32 | ||||
| 2025-07-22 | 13F | Siligmueller & Norvid Wealth Advisors LLC | 5.600 | -26,32 | 254 | -21,12 | ||||
| 2025-05-05 | 13F | PCA Investment Advisory Services Inc. | 0 | -100,00 | 0 | |||||
| 2025-07-09 | 13F | Fragasso Group Inc. | 15.416 | 55,17 | 697 | 65,32 | ||||
| 2025-07-29 | 13F | Mattson Financial Services, LLC | 10.012 | 452 | ||||||
| 2025-08-11 | 13F | Blue Bell Private Wealth Management, Llc | 52.719 | 20,25 | 2.382 | 28,00 | ||||
| 2025-08-12 | 13F | Change Path, LLC | 7.387 | -0,34 | 334 | 6,05 | ||||
| 2025-07-17 | 13F | XML Financial, LLC | 15.643 | -0,20 | 707 | 6,17 | ||||
| 2025-08-08 | 13F | Emerald Investment Partners, Llc | 150 | 0,00 | 7 | 0,00 | ||||
| 2025-08-11 | 13F | Annis Gardner Whiting Capital Advisors, LLC | 7.700 | 348 | ||||||
| 2025-04-22 | 13F | Castleview Partners, Llc | 0 | -100,00 | 0 | |||||
| 2025-07-17 | 13F | Clear Point Advisors Inc. | 24.503 | -1,83 | 1.107 | 4,43 | ||||
| 2025-08-04 | 13F | Spire Wealth Management | 29.904 | 5,30 | 1.351 | 12,02 | ||||
| 2025-08-06 | 13F | AE Wealth Management LLC | 7.145 | 4,78 | 323 | 11,42 | ||||
| 2025-07-28 | 13F | Harbour Investments, Inc. | 13.558 | 1,22 | 613 | 7,75 | ||||
| 2025-08-08 | 13F | Cetera Investment Advisers | 74.885 | 7,76 | 3.384 | 14,64 | ||||
| 2025-08-11 | 13F | Outlook Wealth Advisors, LLC | 46.882 | -60,22 | 2.118 | -57,68 | ||||
| 2025-08-15 | 13F | Kestra Advisory Services, LLC | 52.848 | -1,16 | 2.388 | 5,20 | ||||
| 2025-08-06 | 13F | Souders Financial Advisors | 5.857 | 0,00 | 265 | 6,45 | ||||
| 2025-08-11 | 13F | Bellwether Advisors, LLC | 5.352 | 0,00 | 242 | 6,17 | ||||
| 2025-07-16 | 13F | Signaturefd, Llc | 28.341 | 1.281 | ||||||
| 2025-08-06 | 13F | Valtinson Bruner Financial Planning LLC | 23.387 | -4,46 | 1.057 | 1,64 | ||||
| 2025-08-14 | 13F | Mml Investors Services, Llc | 39.546 | 67,53 | 2 | 0,00 | ||||
| 2025-08-11 | 13F | Nations Financial Group Inc, /ia/ /adv | 7.470 | 22,46 | 338 | 30,12 | ||||
| 2025-05-15 | 13F | Old Mission Capital Llc | 0 | -100,00 | 0 | |||||
| 2025-08-08 | 13F | Comprehensive Financial Planning, Inc./PA | 39 | 0,00 | 2 | 0,00 | ||||
| 2025-07-03 | 13F | City Center Advisors, LLC | 11.597 | -4,69 | 524 | 1,55 | ||||
| 2025-08-06 | 13F | Penserra Capital Management LLC | 380.937 | -5,51 | 17 | 0,00 | ||||
| 2025-08-14 | 13F | Snowden Capital Advisors LLC | 35.079 | 0,00 | 1.585 | 6,45 | ||||
| 2025-08-12 | 13F | Proequities, Inc. | 0 | 0 | ||||||
| 2025-05-16 | 13F | Ashton Thomas Private Wealth, LLC | 0 | -100,00 | 0 | -100,00 | ||||
| 2025-07-10 | 13F | Signal Advisors Wealth, LLC | 15.290 | 691 | ||||||
| 2025-07-09 | 13F | Keystone Wealth Services, LLC | 12.704 | -3,87 | 574 | 2,32 | ||||
| 2025-08-05 | 13F | Sigma Planning Corp | 23.863 | -9,72 | 1.078 | -3,92 | ||||
| 2025-08-14 | 13F | Fmr Llc | 110 | -97,85 | 5 | -98,16 | ||||
| 2025-07-14 | 13F | AdvisorNet Financial, Inc | 170 | 8 | ||||||
| 2025-04-18 | 13F | Capital Wealth Management, Llc | 0 | -100,00 | 0 | |||||
| 2025-08-15 | 13F | Brown Financial Advisors | 11.886 | 537 | ||||||
| 2025-07-22 | 13F | My Personal CFO, LLC | 91.870 | 13,60 | 4.151 | 20,88 | ||||
| 2025-08-14 | 13F | UBS Group AG | 6.424 | 290 | ||||||
| 2025-08-13 | 13F | Townsquare Capital Llc | 0 | -100,00 | 0 | |||||
| 2025-08-12 | 13F | Tradition Wealth Management, LLC | 10.504 | 7,21 | 475 | 13,94 | ||||
| 2025-07-14 | 13F | Chris Bulman Inc | 13.156 | 131,13 | 594 | 146,47 | ||||
| 2025-08-13 | 13F | Continuum Advisory, LLC | 0 | -100,00 | 0 | -100,00 | ||||
| 2025-08-14 | 13F/A | Barclays Plc | 2.102 | 210.100,00 | 0 | |||||
| 2025-07-21 | 13F | DHJJ Financial Advisors, Ltd. | 22.240 | 8,83 | 1.005 | 15,80 | ||||
| 2025-08-05 | 13F | Integrity Financial Corp /WA | 3.922 | 0,00 | 177 | 6,63 | ||||
| 2025-08-13 | 13F | Beacon Pointe Advisors, LLC | 17.888 | 18,43 | 808 | 26,05 | ||||
| 2025-08-14 | 13F | First Commonwealth Financial Corp /pa/ | 57.112 | -0,43 | 2.581 | 5,91 | ||||
| 2025-08-12 | 13F | Steward Partners Investment Advisory, Llc | 2.540 | 0,00 | 115 | 6,54 | ||||
| 2025-07-08 | 13F | Paladin Wealth, LLC | 9.775 | 442 | ||||||
| 2025-07-24 | 13F | IFP Advisors, Inc | 1.944 | 118,67 | 88 | 135,14 | ||||
| 2025-07-11 | 13F | Lantz Financial LLC | 18.539 | 94,51 | 838 | 107,18 | ||||
| 2025-07-25 | 13F | Cwm, Llc | 167 | 0,00 | 0 | |||||
| 2025-08-19 | 13F | Cape Investment Advisory, Inc. | 100 | 0,00 | 5 | 0,00 | ||||
| 2025-07-17 | 13F | Janney Montgomery Scott LLC | 23.046 | -6,21 | 1 | 0,00 | ||||
| 2025-08-06 | 13F | Commonwealth Equity Services, Llc | 482.018 | 9,74 | 22 | 16,67 | ||||
| 2025-08-13 | 13F | Cerity Partners LLC | 378.934 | 98,44 | 17.123 | 111,16 | ||||
| 2025-07-31 | 13F | Orion Capital Management LLC | 2.670 | 0,00 | 121 | 6,19 | ||||
| 2025-08-14 | 13F | Financial Network Wealth Advisors LLC | 499 | 0,00 | 23 | 4,76 | ||||
| 2025-08-29 | 13F | Centaurus Financial, Inc. | 4.439 | 14,79 | 0 | |||||
| 2025-07-14 | 13F | Kfg Wealth Management, Llc | 4.514 | -7,00 | 204 | -1,46 | ||||
| 2025-08-12 | 13F/A | Castellan Group, LLC | 7.160 | 0,00 | 324 | 6,25 | ||||
| 2025-08-12 | 13F | SRS Capital Advisors, Inc. | 11.247 | -10,17 | 508 | -4,33 | ||||
| 2025-06-24 | NP | Innovator ETFs Trust - Innovator Laddered Allocation Buffer ETF | 405.497 | 4,51 | 17.116 | -2,58 | ||||
| 2025-04-09 | 13F | RFG Advisory, LLC | 0 | -100,00 | 0 | |||||
| 2025-07-25 | 13F | Lion Street Advisors, LLC | 6.514 | 294 | ||||||
| 2025-08-12 | 13F | Wood Tarver Financial Group, LLC | 118 | 38,82 | 0 | -100,00 | ||||
| 2025-08-11 | 13F | HighTower Advisors, LLC | 179.339 | 2,05 | 8.104 | 8,58 | ||||
| 2025-05-14 | 13F | Susquehanna International Group, Llp | 0 | -100,00 | 0 | |||||
| 2025-07-11 | 13F | Farther Finance Advisors, LLC | 6.170 | -3,29 | 279 | 2,58 | ||||
| 2025-08-13 | 13F | BCJ Capital Management, LLC | 6.803 | 6,35 | 307 | 13,28 | ||||
| 2025-07-30 | 13F | Strategic Blueprint, LLC | 30.027 | -3,00 | 1.357 | 3,20 | ||||
| 2025-08-11 | 13F | Principal Securities, Inc. | 8.724 | 3,27 | 394 | 5,35 | ||||
| 2025-07-22 | 13F | Diligent Investors, LLC | 5.733 | 0,00 | 259 | 6,58 | ||||
| 2025-07-28 | 13F | WealthPLAN Partners, LLC | 9.458 | 0,00 | 427 | 6,48 | ||||
| 2025-07-10 | 13F | Secure Asset Management, LLC | 9.022 | -0,91 | 408 | 5,44 | ||||
| 2025-07-22 | 13F | Beacon Financial Advisory LLC | 4.905 | -35,08 | 222 | -30,94 | ||||
| 2025-07-30 | 13F | IMG Wealth Management, Inc. | 3.604 | 17,28 | 163 | 24,62 | ||||
| 2025-08-01 | 13F | Envestnet Asset Management Inc | 100.317 | 59,22 | 4.533 | 69,46 | ||||
| 2025-08-08 | 13F | Capital Investment Advisory Services, LLC | 2.762 | 0,00 | 125 | 5,98 | ||||
| 2025-07-14 | 13F | Southland Equity Partners LLC | 34.707 | -0,32 | 1.568 | 6,09 | ||||
| 2025-04-16 | 13F | CRA Financial Services, LLC | 0 | -100,00 | 0 | |||||
| 2025-07-31 | 13F | Cambridge Investment Research Advisors, Inc. | 42.048 | 6,44 | 2 | 0,00 | ||||
| 2025-08-06 | 13F | Maltin Wealth Management, Inc. | 41.978 | 0,00 | 1.897 | 6,40 | ||||
| 2025-08-13 | 13F | M Holdings Securities, Inc. | 15.740 | -16,37 | 1 | |||||
| 2025-05-15 | 13F | Citadel Advisors Llc | 0 | -100,00 | 0 | |||||
| 2025-04-18 | 13F | Global Trust Asset Management, LLC | 0 | -100,00 | 0 | |||||
| 2025-08-15 | 13F | Chapman Financial Group, Llc | 19.700 | -2,42 | 890 | -0,45 | ||||
| 2025-07-29 | 13F | Stratos Wealth Advisors, LLC | 8.744 | 0,00 | 395 | 6,47 | ||||
| 2025-08-14 | 13F | Royal Bank Of Canada | 0 | -100,00 | 0 | |||||
| 2025-08-19 | 13F | Advisory Services Network, LLC | 9.708 | 0,00 | 444 | 7,77 | ||||
| 2025-09-04 | 13F/A | Advisor Group Holdings, Inc. | 158.034 | 19,61 | 7.140 | 27,25 | ||||
| 2025-08-01 | 13F | Stuart Chaussee & Associates, Inc. | 2.218.802 | 100.263 | ||||||
| 2025-08-12 | 13F | Jpmorgan Chase & Co | 4.454 | 345,40 | 201 | 378,57 | ||||
| 2025-07-08 | 13F | Gradient Investments LLC | 1.035.285 | 46.782 | ||||||
| 2025-04-14 | 13F | BCS Wealth Management | 0 | -100,00 | 0 | |||||
| 2025-08-14 | 13F | Benjamin Edwards Inc | 9.941 | 0,00 | 449 | 6,40 | ||||
| 2025-08-14 | 13F | Raymond James Financial Inc | 180.133 | 31,31 | 8.140 | 39,70 | ||||
| 2025-08-04 | 13F | Creative Financial Designs Inc /adv | 1.250 | 0,00 | 56 | 5,66 | ||||
| 2025-08-15 | 13F | Captrust Financial Advisors | 8.888 | 402 | ||||||
| 2025-08-01 | 13F | Gwn Securities Inc. | 22.849 | -67,98 | 1.035 | -66,74 |