Grundlæggende statistik
| Institutionelle aktier (lange) | 29.733.496 - 87,20% (ex 13D/G) - change of -11,34MM shares -27,61% MRQ |
| Institutionel værdi (lang) | $ 1.847.679 USD ($1000) |
Institutionelt ejerskab og aktionærer
Banner Corporation (US:BANR) har 249 institutionelle ejere og aktionærer, der har indsendt 13D/G- eller 13F-formularer til Securities Exchange Commission (SEC). Disse institutioner har i alt 29,733,496 aktier. Største aktionærer omfatter BlackRock, Inc., Vanguard Group Inc, Dimensional Fund Advisors Lp, State Street Corp, Charles Schwab Investment Management Inc, Victory Capital Management Inc, Westwood Holdings Group Inc, Geode Capital Management, Llc, Nuveen, LLC, and American Century Companies Inc .
Banner Corporation (NasdaqGS:BANR) institutionel ejerskabsstruktur viser aktuelle positioner i virksomheden efter institutioner og fonde, samt seneste ændringer i positionsstørrelse. Større aktionærer kan omfatte individuelle investorer, investeringsforeninger, hedgefonde eller institutioner. Skema 13D angiver, at investoren besidder (eller besidder) mere end 5 % af virksomheden og har til hensigt (eller har til hensigt at) aktivt at forfølge en ændring i forretningsstrategi. Skema 13G indikerer en passiv investering på over 5%.
The share price as of March 31, 2026 is 60,69 / share. Previously, on April 1, 2025, the share price was 63,50 / share. This represents a decline of 4,43% over that period.

Fondens stemningsscore
Fund Sentiment Score (fka Ownership Accumulation Score) finder de aktier, der bliver mest købt af fonde. Det er resultatet af en sofistikeret, multi-faktor kvantitativ model, der identificerer virksomheder med de højeste niveauer af institutionel akkumulering. Scoringsmodellen bruger en kombination af den samlede stigning i oplyste ejere, ændringerne i porteføljeallokeringer i disse ejere og andre målinger. Tallet går fra 0 til 100, hvor højere tal indikerer et højere niveau af akkumulering for sine jævnaldrende, og 50 er gennemsnittet.
Opdateringsfrekvens: Dagligt
Se Ownership Explorer, som giver en liste over højest rangerende virksomheder.
AI+ Ask Fintel’s AI assistant about Banner Corporation.
Select a question to share a public post with an AI-crafted answer.
Thinking of good questions…
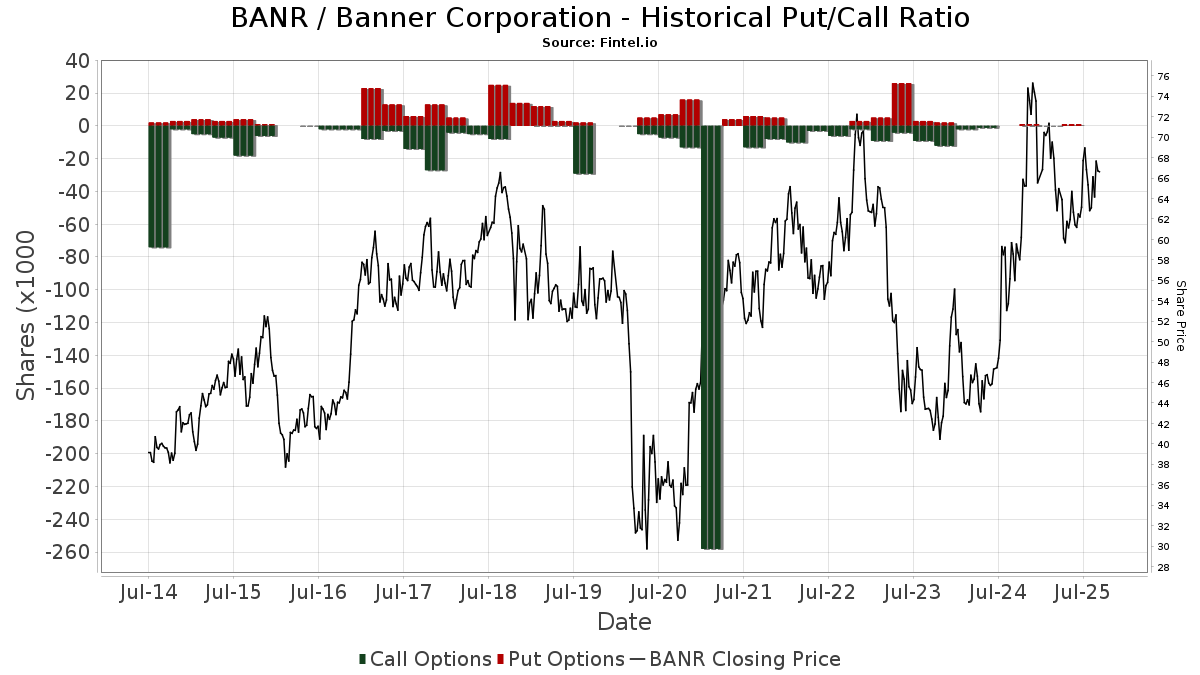
Institutionel Put/Call-forhold
Ud over at indberette standardaktie- og gældsudstedelser skal institutter med mere end 100 mill. aktiver under forvaltning også oplyse deres put- og call-optionsbeholdninger. Da salgsoptioner generelt indikerer negativ stemning, og købsoptioner indikerer positiv stemning, kan vi få en fornemmelse af den overordnede institutionelle stemning ved at plotte forholdet mellem put og kald. Diagrammet til højre viser det historiske put/call-forhold for dette instrument.
Brug af Put/Call Ratio som en indikator for investorernes stemning overvinder en af de vigtigste mangler ved at bruge totalt institutionelt ejerskab, som er, at en betydelig mængde af aktiver under forvaltning investeres passivt for at spore indekser. Passivt forvaltede fonde køber typisk ikke optioner, så indikatoren for put/call-forholdet følger mere nøje følelsen af aktivt forvaltede fonde.
13D/G-arkivering
Vi præsenterer 13D/G ansøgninger separat fra 13F ansøgninger på grund af den forskellige behandling af SEC. 13D/G-ansøgninger kan indgives af grupper af investorer (med én ledende), hvorimod 13F-ansøgninger ikke kan. Dette resulterer i situationer, hvor en investor kan indsende en 13D/G, der rapporterer én værdi for de samlede aktier (der repræsenterer alle de aktier, der ejes af investorgruppen), men derefter indsender en 13F, der rapporterer en anden værdi for de samlede aktier (der udelukkende repræsenterer deres egne) ejendomsret). Det betyder, at aktieejerskab af 13D/G-arkiver og 13F-arkiveringer ofte ikke er direkte sammenlignelige, så vi præsenterer dem separat.
Bemærk: Fra den 16. maj 2021 viser vi ikke længere ejere, der ikke har indsendt en 13D/G inden for det seneste år. Tidligere viste vi den fulde historie af 13D/G-arkiver. Generelt skal enheder, der er forpligtet til at indgive 13D/G-ansøgninger, indgive mindst årligt, før de indsender en afsluttende ansøgning. Dog forlader fonde nogle gange positioner uden at indsende en afsluttende ansøgning (dvs. de afvikler), så visning af den fulde historie resulterede nogle gange i forvirring om det nuværende ejerskab. For at undgå forvirring viser vi nu kun 'aktuelle' ejere - det vil sige - ejere, der har anmeldt inden for det seneste år.
Upgrade to unlock premium data.
| Fil dato | Form | Investor | Forrige Aktier |
Seneste Aktier |
Δ Aktier (Procent) |
Ejendomsret (Procent) |
Δ Ejerskab (Procent) |
|
|---|---|---|---|---|---|---|---|---|
| 2026-03-26 | VANGUARD GROUP INC | 3,816,250 | 0 | -100.00 | 0.00 | -100.00 | ||
| 2025-08-12 | WELLINGTON MANAGEMENT GROUP LLP | 1,785,319 | 1,693,775 | -5.13 | 4.90 | -5.41 | ||
| 2025-08-08 | VICTORY CAPITAL MANAGEMENT INC | 1,945,060 | 5.62 |
13F og NPORT arkivering
Detaljer om 13F-arkivering er gratis. Detaljer om NP-ansøgninger kræver et premium-medlemskab. Grønne rækker angiver nye positioner. Røde rækker angiver lukkede positioner. Klik på linket ikon for at se den fulde transaktionshistorik.
Opgrader
for at låse premium-data op og eksportere til Excel ![]() .
.
| Fil dato | Kilde | Investor | Type | Gennemsnitlig pris (Øst) |
Aktier | Δ Aktier (%) |
Rapporteret Værdi ($1000) |
Δ Værdi (%) |
Port Alloc (%) |
|
|---|---|---|---|---|---|---|---|---|---|---|
| 2026-01-20 | 13F | Sovran Advisors, LLC | 17.382 | 1.147 | ||||||
| 2026-01-27 | 13F | Hennessy Advisors Inc | 10.000 | -50,00 | 627 | -52,21 | ||||
| 2026-02-17 | 13F | Amundi | 9.020 | 31,09 | 565 | 29,89 | ||||
| 2026-01-16 | 13F | Louisiana State Employees Retirement System | 15.600 | -1,89 | 977 | -6,15 | ||||
| 2026-02-10 | 13F | Commonwealth Of Pennsylvania Public School Empls Retrmt Sys | 8.439 | -4,19 | 529 | -8,33 | ||||
| 2026-01-08 | 13F | True Wealth Design, LLC | 0 | -100,00 | 0 | |||||
| 2026-02-17 | 13F | Roehl & Yi Investment Advisors, LLC | 17.378 | 1.089 | ||||||
| 2026-02-05 | 13F | Amalgamated Bank | 9.907 | -0,34 | 1 | |||||
| 2026-01-08 | 13F | Versant Capital Management, Inc | 295 | 7,27 | 18 | 0,00 | ||||
| 2026-01-30 | 13F | Ares Financial Consulting, LLC | 30 | 2 | ||||||
| 2026-02-17 | 13F | Millennium Management Llc | 446.882 | 31,35 | 28.002 | 25,66 | ||||
| 2026-02-17 | 13F | State Of Wisconsin Investment Board | 82.588 | 2,95 | 5.175 | -1,52 | ||||
| 2025-11-14 | 13F/A | Skopos Labs, Inc. | 0 | -100,00 | 0 | -100,00 | ||||
| 2026-02-17 | 13F | Canada Pension Plan Investment Board | 4.100 | 257 | ||||||
| 2026-02-11 | 13F | Brandywine Global Investment Management, LLC | 20.607 | 1.291 | ||||||
| 2026-02-17 | 13F | Raymond James Financial Inc | 269.146 | -8,96 | 16.980 | -12,31 | ||||
| 2026-01-15 | 13F | Nisa Investment Advisors, Llc | 1.703 | -2,80 | 107 | -7,02 | ||||
| 2025-11-13 | 13F | Renaissance Technologies Llc | 0 | -100,00 | 0 | |||||
| 2026-02-17 | 13F | Aquatic Capital Management LLC | 5.177 | 834,48 | 324 | 800,00 | ||||
| 2026-02-13 | 13F | Police & Firemen's Retirement System of New Jersey | 9.434 | 0,00 | 591 | -4,21 | ||||
| 2026-02-17 | 13F | Man Group plc | 4.527 | 284 | 37,38 | |||||
| 2026-02-18 | 13F | State of Tennessee, Treasury Department | 30.827 | 265,47 | 1.906 | 245,29 | ||||
| 2026-02-09 | 13F | Huntington National Bank | 37 | 0,00 | 2 | 0,00 | ||||
| 2026-02-19 | 13F | Invesco Ltd. | 149.389 | -3,61 | 9.361 | -7,79 | ||||
| 2026-02-10 | 13F | CIBC Asset Management Inc | 3.346 | 210 | ||||||
| 2026-02-17 | 13F | Janus Henderson Group Plc | 15.072 | 0,00 | 944 | -4,36 | ||||
| 2026-02-17 | 13F | United Capital Financial Advisers, Llc | 4.813 | 302 | ||||||
| 2025-11-14 | 13F | Mount Yale Investment Advisors, LLC | 0 | -100,00 | 0 | -100,00 | ||||
| 2026-02-12 | 13F | Cibc World Markets Corp | 0 | -100,00 | 0 | |||||
| 2026-02-13 | 13F | Rhumbline Advisers | 97.217 | -3,04 | 6.092 | -7,25 | ||||
| 2026-02-12 | 13F | Cloud Capital Management, LLC | 0 | -100,00 | 0 | |||||
| 2026-01-23 | 13F | Bellevue Asset Management, Llc | 142 | 0,00 | 9 | -11,11 | ||||
| 2026-02-13 | 13F | Glen Eagle Advisors, LLC | 25 | 0,00 | 2 | 0,00 | ||||
| 2026-02-17 | 13F | California State Teachers Retirement System | 31.790 | -0,09 | 1.992 | -4,46 | ||||
| 2026-01-23 | 13F | State of Alaska, Department of Revenue | 18.819 | -0,05 | 1 | 0,00 | ||||
| 2025-10-30 | 13F | Twin Peaks Wealth Advisors, LLC | 0 | -100,00 | 0 | |||||
| 2026-02-10 | 13F | Mutual Of America Capital Management Llc | 3.896 | 0,57 | 244 | -3,56 | ||||
| 2026-02-09 | 13F | William Blair Investment Management, Llc | 664.138 | -6,42 | 41.615 | -10,47 | ||||
| 2025-11-13 | 13F | Winton Capital Group Ltd | 0 | -100,00 | 0 | -100,00 | ||||
| 2026-02-13 | 13F | Prudential Financial Inc | 32.404 | -7,17 | 2.030 | -11,20 | ||||
| 2026-01-28 | 13F | Teacher Retirement System Of Texas | 0 | -100,00 | 0 | -100,00 | ||||
| 2026-02-10 | 13F | Eurizon Capital SGR S.p.A. | 191 | 12 | ||||||
| 2026-02-12 | 13F | Gould Capital, LLC | 1.933 | 0,00 | 121 | -3,97 | ||||
| 2026-02-17 | 13F | Two Sigma Investments, Lp | 129.486 | -25,47 | 8.114 | -28,71 | ||||
| 2026-01-09 | 13F | Diversified Trust Co | 12.726 | 4,37 | 797 | -0,13 | ||||
| 2026-02-13 | 13F | Entropy Technologies, LP | 4.605 | 289 | ||||||
| 2026-02-10 | 13F | Intech Investment Management Llc | 14.154 | -43,47 | 887 | -45,98 | ||||
| 2026-02-13 | 13F | MAI Capital Management | 27 | 2 | ||||||
| 2026-02-10 | 13F | Envestnet Asset Management Inc | 12.364 | -16,35 | 775 | -20,04 | ||||
| 2026-02-13 | 13F | Morgan Stanley | 369.120 | 37,10 | 23.129 | 31,15 | ||||
| 2026-02-13 | 13F | Quarry LP | 193 | 565,52 | 12 | 1.100,00 | ||||
| 2026-02-17 | 13F | Alliancebernstein L.p. | 39.709 | -0,55 | 2.488 | -4,86 | ||||
| 2026-01-29 | 13F | Teachers Retirement System Of The State Of Kentucky | 8.665 | -11,55 | 1 | |||||
| 2026-02-17 | 13F | Ameriprise Financial Inc | 63.773 | -4,36 | 3.996 | -8,50 | ||||
| 2026-02-17 | 13F | Brevan Howard Capital Management LP | 7.678 | 481 | ||||||
| 2026-02-12 | 13F | Voya Investment Management Llc | 34.283 | 1,33 | 2.148 | -3,02 | ||||
| 2026-02-10 | 13F | Bruce G. Allen Investments, LLC | 11 | 83,33 | 1 | |||||
| 2026-02-13 | 13F | BNP Paribas Asset Management Holding S.A. | 818 | 38,64 | 0 | |||||
| 2026-02-10 | 13F | Rothschild Investment Llc | 509 | 3,88 | 32 | -3,12 | ||||
| 2026-01-29 | 13F | UBS Group AG | 454.807 | 241,23 | 28.498 | 226,44 | ||||
| 2026-02-11 | 13F | Los Angeles Capital Management Llc | 180 | 11 | ||||||
| 2026-02-13 | 13F | Charles Schwab Investment Management Inc | 1.448.700 | 0,47 | 90.776 | -3,88 | ||||
| 2026-01-29 | 13F | Comerica Bank | 10.370 | -17,50 | 650 | -21,14 | ||||
| 2026-03-06 | 13F | Hsbc Holdings Plc | 14.341 | 897 | ||||||
| 2025-11-21 | 13F/A | CIBC Bancorp USA Inc. | 3.634 | 238 | ||||||
| 2026-02-03 | 13F | F/M Investments LLC | 80.351 | -2,62 | 5.035 | -6,85 | ||||
| 2026-01-23 | 13F | Farther Finance Advisors, LLC | 52 | 300,00 | 3 | |||||
| 2026-01-23 | 13F | Assetmark, Inc | 6 | 0 | ||||||
| 2026-02-10 | 13F | Quantbot Technologies LP | 153 | 10 | ||||||
| 2026-02-03 | 13F | McIlrath & Eck, LLC | 128 | 0,00 | 8 | 0,00 | ||||
| 2026-02-17 | 13F | XTX Topco Ltd | 0 | -100,00 | 0 | |||||
| 2025-11-13 | 13F | Marshall Wace, Llp | 0 | -100,00 | 0 | |||||
| 2026-02-02 | 13F | Bay Harbor Wealth Management, LLC | 4 | 0,00 | 0 | |||||
| 2026-02-04 | 13F | Oregon Public Employees Retirement Fund | 7.757 | 0,00 | 486 | -4,33 | ||||
| 2026-02-13 | 13F | Great West Life Assurance Co /can/ | 31.119 | -22,50 | 2 | -50,00 | ||||
| 2026-02-03 | 13F | Cheviot Value Management, LLC | 110 | 0,00 | 7 | 0,00 | ||||
| 2025-11-14 | 13F | Texas Permanent School Fund | 0 | -100,00 | 0 | |||||
| 2026-02-17 | 13F | Engineers Gate Manager LP | 16.891 | 397,97 | 1.058 | 376,58 | ||||
| 2026-01-20 | 13F | Signaturefd, Llc | 0 | -100,00 | 0 | |||||
| 2026-01-29 | 13F | Financial Life Planners | 0 | -100,00 | 0 | |||||
| 2026-02-17 | 13F | Fmr Llc | 255.661 | 53,09 | 16.020 | 46,45 | ||||
| 2026-01-14 | 13F | Jfs Wealth Advisors, Llc | 22 | 46,67 | 1 | |||||
| 2026-01-20 | 13F | Harbor Capital Advisors, Inc. | 14.242 | 7,16 | 1 | |||||
| 2026-01-30 | 13F | Caldwell Securities, Inc | 28.261 | -4,17 | 1.771 | -8,34 | ||||
| 2026-02-06 | 13F | EverSource Wealth Advisors, LLC | 617 | -21,40 | 39 | -25,49 | ||||
| 2026-02-17 | 13F | Public Employees Retirement System Of Ohio | 42.146 | -0,02 | 2.641 | -4,38 | ||||
| 2025-11-06 | 13F | MQS Management LLC | 0 | -100,00 | 0 | |||||
| 2026-01-28 | 13F | Universal- Beteiligungs- und Servicegesellschaft mbH | 20.187 | -0,16 | 1.266 | -4,46 | ||||
| 2026-02-13 | 13F | Victory Capital Management Inc | 1.139.712 | -31,53 | 71.414 | -34,49 | ||||
| 2026-02-17 | 13F | Bridgeway Capital Management Inc | 278.771 | 8,95 | 17.468 | 4,22 | ||||
| 2026-01-26 | 13F | Cwm, Llc | 1.828 | 12,91 | 0 | |||||
| 2026-02-05 | 13F | Thrivent Financial For Lutherans | 55.160 | -5,41 | 3 | 0,00 | ||||
| 2025-11-13 | 13F | Bank Of Montreal /can/ | 0 | -100,00 | 0 | -100,00 | ||||
| 2026-02-04 | 13F | Ameritas Advisory Services, LLC | 0 | -100,00 | 0 | |||||
| 2026-02-17 | 13F | Occudo Quantitative Strategies Lp | 11.873 | 744 | ||||||
| 2026-02-11 | 13F | CSM Advisors, LLC | 7.994 | 21,14 | 1 | |||||
| 2026-02-17 | 13F | Quantinno Capital Management LP | 5.709 | 19,01 | 358 | 13,69 | ||||
| 2026-01-12 | 13F | Rialto Wealth Management, LLC | 3 | -25,00 | 0 | |||||
| 2026-02-13 | 13F | Sei Investments Co | 113.053 | -8,34 | 7.084 | -12,32 | ||||
| 2026-01-15 | 13F | Allspring Global Investments Holdings, LLC | 126.957 | -6,64 | 7.931 | -8,28 | ||||
| 2026-02-17 | 13F | Susquehanna International Group, Llp | 16.309 | -29,03 | 1.022 | -32,16 | ||||
| 2026-02-05 | 13F | Bessemer Group Inc | 317 | 16,12 | 0 | |||||
| 2026-02-12 | 13F | Paradigm Capital Management Inc/ny | 6.000 | 0,00 | 376 | -4,58 | ||||
| 2026-02-12 | 13F | Dimensional Fund Advisors Lp | 2.158.993 | 0,26 | 135.284 | -4,09 | ||||
| 2026-02-06 | 13F | Bare Financial Services, Inc | 94 | 17,50 | 6 | 0,00 | ||||
| 2026-01-23 | 13F | Zwj Investment Counsel Inc | 3.592 | 0,00 | 225 | -4,26 | ||||
| 2026-02-12 | 13F | State Board Of Administration Of Florida Retirement System | 9.291 | 0,00 | 582 | -4,28 | ||||
| 2026-02-13 | 13F | Caitong International Asset Management Co., Ltd | 0 | -100,00 | 0 | |||||
| 2026-02-02 | 13F | Horizon Investments, LLC | 16.211 | 78,61 | 1.016 | 72,33 | ||||
| 2026-02-13 | 13F | Parkside Financial Bank & Trust | 69 | 0,00 | 4 | 0,00 | ||||
| 2026-01-16 | 13F | Standard Life Aberdeen plc | 287.398 | -4,77 | 18.008 | -8,90 | ||||
| 2026-02-13 | 13F | SRS Capital Advisors, Inc. | 225 | -17,28 | 14 | -17,65 | ||||
| 2026-02-06 | 13F | Stieven Capital Advisors, L.P. | 178.956 | -0,28 | 11.213 | -4,60 | ||||
| 2026-01-28 | 13F | Peregrine Capital Management Llc | 93.357 | -4,71 | 5.850 | -8,85 | ||||
| 2026-02-17 | 13F | Mercer Global Advisors Inc /adv | 16.959 | 0,39 | 1.063 | -3,98 | ||||
| 2026-02-06 | 13F | ProShare Advisors LLC | 6.628 | 3,06 | 415 | -1,43 | ||||
| 2026-02-17 | 13F | Voloridge Investment Management, Llc | 9.805 | 614 | ||||||
| 2026-02-13 | 13F | TFO USA Ltd | 33.285 | 0,00 | 2.086 | -4,36 | ||||
| 2026-02-17 | 13F | Numerai GP LLC | 16.909 | 1.060 | ||||||
| 2026-01-26 | 13F | Mirae Asset Global Investments Co., Ltd. | 30.815 | -4,46 | 1.931 | -8,62 | ||||
| 2026-02-10 | 13F | Savant Capital, LLC | 0 | -100,00 | 0 | |||||
| 2026-02-12 | 13F | Swiss National Bank | 68.200 | 1,64 | 4.273 | -2,78 | ||||
| 2026-02-04 | 13F | LRI Investments, LLC | 93 | 0,00 | 6 | -16,67 | ||||
| 2026-02-09 | 13F | Atlantic Trust, LLC | 0 | -100,00 | 0 | |||||
| 2026-02-13 | 13F | Rafferty Asset Management, LLC | 30.138 | -19,48 | 1.888 | -22,97 | ||||
| 2026-02-11 | 13F | Allianz Asset Management GmbH | 50.538 | -41,47 | 3.167 | -44,01 | ||||
| 2026-02-03 | 13F | Wesbanco Bank Inc | 22.169 | 0,00 | 1.389 | -4,34 | ||||
| 2026-02-17 | 13F | Qube Research & Technologies Ltd | 152.158 | 231,65 | 9.534 | 217,27 | ||||
| 2026-02-10 | 13F | Connor, Clark & Lunn Investment Management Ltd. | 24.890 | 176,00 | 1.560 | 164,24 | ||||
| 2026-01-14 | 13F | Spire Wealth Management | 43 | 0,00 | 3 | 0,00 | ||||
| 2026-02-06 | 13F | IFP Advisors, Inc | 18 | 0,00 | 1 | 0,00 | ||||
| 2026-02-06 | 13F | Pnc Financial Services Group, Inc. | 3.108 | -0,16 | 195 | -4,43 | ||||
| 2026-02-17 | 13F | Tower Research Capital LLC (TRC) | 1.048 | -36,91 | 66 | -39,81 | ||||
| 2026-02-17 | 13F | Aristotle Capital Boston, LLC | 218.172 | -9,36 | 13.671 | -13,29 | ||||
| 2026-02-17 | 13F | MIRAE ASSET GLOBAL ETFS HOLDINGS Ltd. | 15.857 | 0,30 | 994 | -4,06 | ||||
| 2026-02-17 | 13F | Westwood Holdings Group Inc | 1.135.362 | -1,55 | 71.142 | -5,82 | ||||
| 2026-02-12 | 13F | Hrt Financial Lp | 0 | -100,00 | 0 | |||||
| 2026-02-13 | 13F | Smartleaf Asset Management LLC | 665 | 0,00 | 42 | -4,65 | ||||
| 2026-02-06 | 13F | Larson Financial Group LLC | 33 | 0,00 | 2 | 0,00 | ||||
| 2026-02-17 | 13F | Kemnay Advisory Services Inc. | 492 | 31 | ||||||
| 2026-01-28 | 13F | John W. Rosenthal Capital Management, Inc. | 30.877 | 0,00 | 1.935 | -4,35 | ||||
| 2026-01-30 | 13F | Us Bancorp \de\ | 2.154 | 0,00 | 135 | -4,96 | ||||
| 2026-02-12 | 13F | Nuveen, LLC | 749.083 | 17,88 | 46.938 | 12,77 | ||||
| 2026-02-10 | 13F | Natixis Advisors, L.p. | 15.290 | -5,10 | 1 | -100,00 | ||||
| 2026-02-13 | 13F | Panagora Asset Management Inc | 219.577 | 4,35 | 13.759 | -0,17 | ||||
| 2026-02-11 | 13F | Empowered Funds, LLC | 144.226 | 23,98 | 9.037 | 18,61 | ||||
| 2026-02-17 | 13F | Russell Investments Group, Ltd. | 91.934 | 62,74 | 5.761 | 55,68 | ||||
| 2026-02-17 | 13F | Optiver Holding B.V. | 0 | -100,00 | 0 | |||||
| 2026-02-03 | 13F | Farmers & Merchants Investments Inc | 21 | 0,00 | 1 | 0,00 | ||||
| 2026-02-17 | 13F | Bank Of America Corp /de/ | 136.760 | -7,06 | 8.569 | -11,08 | ||||
| 2026-02-12 | 13F | Wealthspire Advisors, LLC | 0 | -100,00 | 0 | |||||
| 2026-01-28 | 13F | Badgley Phelps Wealth Managers, LLC | 4.099 | 0,00 | 257 | -4,48 | ||||
| 2026-02-17 | 13F | Balyasny Asset Management Llc | 4.909 | 8,53 | 308 | 3,72 | ||||
| 2026-02-02 | 13F | Principal Financial Group Inc | 206.075 | 6,05 | 12.913 | 1,45 | ||||
| 2026-01-28 | 13F | Arizona State Retirement System | 9.635 | -5,91 | 604 | -10,00 | ||||
| 2025-11-14 | 13F | ExodusPoint Capital Management, LP | 41.256 | 225,93 | 2.702 | |||||
| 2026-02-11 | 13F | Picton Mahoney Asset Management | 20 | 0,00 | 1 | |||||
| 2026-01-14 | 13F | Cascade Investment Advisors, Inc. | 22.565 | -0,07 | 1.414 | -4,40 | ||||
| 2026-02-09 | 13F | Hantz Financial Services, Inc. | 20 | -86,84 | 0 | |||||
| 2026-02-17 | 13F | Captrust Financial Advisors | 5.498 | 1,40 | 345 | -3,10 | ||||
| 2026-02-13 | 13F | Wells Fargo & Company/mn | 79.417 | 7,34 | 4.976 | 2,68 | ||||
| 2025-11-12 | 13F | Simplex Trading, Llc | Put | 0 | -100,00 | 0 | ||||
| 2025-11-12 | 13F | Simplex Trading, Llc | 0 | -100,00 | 0 | |||||
| 2026-02-13 | 13F | Sterling Capital Management LLC | 1.971 | -16,52 | 124 | -20,13 | ||||
| 2026-02-11 | 13F | J.w. Cole Advisors, Inc. | 0 | -100,00 | 0 | |||||
| 2026-02-17 | 13F | Advisor Group Holdings, Inc. | 2.269 | -0,22 | 142 | -6,58 | ||||
| 2026-02-13 | 13F | Colony Group, LLC | 65.137 | -2,45 | 4.082 | -6,42 | ||||
| 2026-01-15 | 13F | Financial Planning Hawaii, Inc. | 4.714 | 295 | ||||||
| 2026-02-13 | 13F | Basswood Capital Management, L.l.c. | 216.813 | -35,60 | 13.586 | -38,39 | ||||
| 2026-02-04 | 13F | Atlantic Union Bankshares Corp | 200 | 0,00 | 13 | -7,69 | ||||
| 2026-02-05 | 13F | Allworth Financial LP | 33 | 17,86 | 2 | 100,00 | ||||
| 2026-02-06 | 13F | Princeton Capital Management Llc | 7.281 | 37,87 | 456 | 32,17 | ||||
| 2026-02-12 | 13F | CIBC Private Wealth Group, LLC | 8 | 1 | ||||||
| 2026-01-30 | 13F | Torren Management, LLC | 12 | 1 | ||||||
| 2026-02-06 | 13F | Profund Advisors Llc | 5.772 | 88,50 | 362 | 80,50 | ||||
| 2026-01-16 | 13F | DiNuzzo Private Wealth, Inc. | 6 | 0,00 | 0 | |||||
| 2026-02-17 | 13F | Trexquant Investment LP | 80.693 | 5.056 | ||||||
| 2025-10-24 | 13F | Opal Wealth Advisors, LLC | 0 | -100,00 | 0 | |||||
| 2025-10-28 | 13F | BRYN MAWR TRUST Co | 43 | 0,00 | 3 | 0,00 | ||||
| 2026-02-12 | 13F | New York State Common Retirement Fund | 26.368 | -6,11 | 1.652 | -10,17 | ||||
| 2025-11-14 | 13F | Squarepoint Ops LLC | 0 | -100,00 | 0 | |||||
| 2026-02-17 | 13F | Citadel Advisors Llc | 233.670 | 14.642 | ||||||
| 2026-02-12 | 13F | Steward Partners Investment Advisory, Llc | 160 | 0,00 | 10 | 0,00 | ||||
| 2026-02-17 | 13F | Hancock Whitney Corp | 5.424 | 1,25 | 340 | -3,14 | ||||
| 2026-02-10 | 13F | Root Financial Partners, LLC | 125 | 11,61 | 8 | 0,00 | ||||
| 2026-02-17 | 13F | Aqr Capital Management Llc | 45.838 | 39,10 | 2.872 | 33,09 | ||||
| 2026-01-26 | 13F/A | Phocas Financial Corp. | 113.401 | -0,23 | 7.106 | -4,57 | ||||
| 2026-02-11 | 13F | LPL Financial LLC | 3.363 | -32,65 | 211 | -35,78 | ||||
| 2026-02-11 | 13F | Jpmorgan Chase & Co | 75.880 | 8,39 | 4.755 | 3,69 | ||||
| 2026-01-28 | 13F | Salomon & Ludwin, LLC | 244 | -15,86 | 16 | -16,67 | ||||
| 2026-02-17 | 13F | Price T Rowe Associates Inc /md/ | 33.787 | 5,95 | 2 | 0,00 | ||||
| 2026-01-29 | 13F | Vanguard Group Inc | 3.837.199 | 1,17 | 240.439 | -3,22 | ||||
| 2026-02-13 | 13F | Natixis | 5.200 | 326 | ||||||
| 2026-02-17 | 13F | Capstone Investment Advisors, Llc | 5.005 | 314 | ||||||
| 2026-01-27 | 13F | Zurcher Kantonalbank (Zurich Cantonalbank) | 10.094 | 0,00 | 632 | -4,39 | ||||
| 2026-01-07 | 13F | Massmutual Trust Co Fsb/adv | 392 | 0,00 | 25 | -4,00 | ||||
| 2026-02-03 | 13F | Sequoia Financial Advisors, LLC | 9.610 | 6,87 | 602 | 2,38 | ||||
| 2026-02-12 | 13F | Jane Street Group, Llc | 36.777 | -55,14 | 2.304 | -57,09 | ||||
| 2026-02-13 | 13F | Verition Fund Management LLC | 8.179 | 18,02 | 512 | 13,02 | ||||
| 2026-02-17 | 13F | Tudor Investment Corp Et Al | 62.393 | -35,29 | 3.910 | -38,10 | ||||
| 2026-02-06 | 13F | Global Retirement Partners, LLC | 1.197 | 0,76 | 75 | -2,60 | ||||
| 2026-02-12 | 13F | MetLife Investment Management, LLC | 212.945 | -0,68 | 13.343 | -4,98 | ||||
| 2026-02-13 | 13F | Umb Bank N A/mo | 155 | -20,92 | 10 | -25,00 | ||||
| 2026-02-17 | 13F | Maryland State Retirement & Pension System | 4.972 | 0,00 | 312 | -4,31 | ||||
| 2026-02-17 | 13F | D. E. Shaw & Co., Inc. | 50.002 | 3.133 | ||||||
| 2026-02-10 | 13F | Bank of New York Mellon Corp | 320.609 | -2,31 | 20.089 | -6,55 | ||||
| 2026-02-12 | 13F | Campbell & CO Investment Adviser LLC | 41.715 | 213,74 | 2.614 | 200,34 | ||||
| 2026-02-13 | 13F | Arrowstreet Capital, Limited Partnership | 17.169 | 1.076 | ||||||
| 2025-11-10 | 13F | Clear Creek Financial Management, LLC | 0 | -100,00 | 0 | |||||
| 2025-11-13 | 13F | Dynamic Technology Lab Private Ltd | 0 | -100,00 | 0 | |||||
| 2026-02-09 | 13F | Quest Partners LLC | 1 | -99,58 | 0 | -100,00 | ||||
| 2026-02-10 | 13F | Nomura Asset Management Co Ltd | 350 | 0,00 | 22 | -4,55 | ||||
| 2026-02-10 | 13F | Bnp Paribas Arbitrage, Sa | 10.024 | 23,31 | 628 | 18,05 | ||||
| 2026-01-21 | 13F | SJS Investment Consulting Inc. | 3 | 0,00 | 0 | |||||
| 2026-01-05 | 13F | GAMMA Investing LLC | 795 | -30,08 | 50 | -33,78 | ||||
| 2026-02-09 | 13F | Keating Financial Advisory Services, Inc. | 15 | 1 | ||||||
| 2026-02-12 | 13F | EntryPoint Capital, LLC | 5.194 | 325 | ||||||
| 2026-02-13 | 13F | Public Sector Pension Investment Board | 0 | -100,00 | 0 | |||||
| 2026-02-13 | 13F | Ubs Asset Management Americas Inc | 94.281 | 3,29 | 5.908 | -1,19 | ||||
| 2026-02-13 | 13F | Neuberger Berman Group LLC | 5.083 | -2,14 | 319 | -6,47 | ||||
| 2026-02-13 | 13F | First Trust Advisors Lp | 40.310 | -3,18 | 2.526 | -7,41 | ||||
| 2026-02-17 | 13F | Royal Bank Of Canada | 17.519 | 0,96 | 1.097 | -3,43 | ||||
| 2026-02-17 | 13F | Wellington Management Group Llp | 231.366 | -84,25 | 14.497 | -84,94 | ||||
| 2026-02-13 | 13F | Stifel Financial Corp | 48.074 | -11,61 | 3.012 | -15,44 | ||||
| 2026-02-11 | 13F | Cerity Partners LLC | 5.844 | 66,35 | 366 | 59,13 | ||||
| 2026-01-30 | 13F | New York State Teachers Retirement System | 13.585 | 0,00 | 1 | |||||
| 2026-02-11 | 13F | Franklin Resources Inc | 7.707 | 17,27 | 483 | 12,09 | ||||
| 2026-02-11 | 13F | Deutsche Bank Ag\ | 29.844 | 4,39 | 1.870 | -0,11 | ||||
| 2026-02-12 | 13F | Wood Tarver Financial Group, LLC | 5.863 | 0,00 | 0 | |||||
| 2026-01-22 | 13F | Maseco Llp | 215 | 0,94 | 13 | 0,00 | ||||
| 2026-02-09 | 13F | Legal & General Group Plc | 84.727 | -5,69 | 5.309 | -9,79 | ||||
| 2026-02-09 | 13F | Jackson Creek Investment Advisors LLC | 0 | -100,00 | 0 | |||||
| 2026-01-23 | 13F | Sippican Capital Advisors | 12.360 | -0,90 | 774 | -5,15 | ||||
| 2026-02-11 | 13F | Illinois Municipal Retirement Fund | 17.673 | -3,07 | 1.107 | -7,29 | ||||
| 2026-02-20 | 13F | Sunbelt Securities, Inc. | 39 | 0,00 | 2 | 0,00 | ||||
| 2026-01-15 | 13F | Fortitude Family Office, LLC | 6 | -25,00 | 0 | |||||
| 2026-01-29 | 13F | Dunhill Financial, LLC | 1 | 0 | ||||||
| 2026-02-06 | 13F | Handelsbanken Fonder AB | 6.944 | 0,00 | 0 | |||||
| 2026-02-13 | 13F | Pinnacle Wealth Planning Services, Inc. | 758 | 47 | ||||||
| 2025-10-24 | 13F | Hemington Wealth Management | 37 | -11,90 | 0 | |||||
| 2026-02-17 | 13F | Susquehanna Fundamental Investments, Llc | 13.899 | 871 | ||||||
| 2025-11-14 | 13F | Sapience Investments, LLC | 0 | -100,00 | 0 | |||||
| 2026-02-09 | 13F | Geode Capital Management, Llc | 840.454 | -0,54 | 52.672 | -4,85 | ||||
| 2026-02-05 | 13F | Elyxium Wealth, LLC | 35 | 2 | ||||||
| 2026-02-02 | 13F | Fifth Third Bancorp | 144 | 35,85 | 9 | 50,00 | ||||
| 2026-02-13 | 13F | State Street Corp | 1.771.401 | -1,96 | 110.996 | -6,21 | ||||
| 2026-02-14 | 13F | Rockefeller Capital Management L.P. | 353 | 126,28 | 22 | 120,00 | ||||
| 2026-02-13 | 13F | Toroso Investments, LLC | 6.703 | -11,43 | 420 | -15,15 | ||||
| 2026-02-13 | 13F | Edgestream Partners, L.P. | 22.533 | -64,56 | 1.412 | -66,12 | ||||
| 2026-01-09 | 13F | SG Americas Securities, LLC | 22.605 | 836,02 | 1 | |||||
| 2026-01-15 | 13F | Lodestone Wealth Management LLC | 1.058 | 66 | ||||||
| 2026-02-12 | 13F | Great Lakes Advisors, Llc | 3.951 | -1,20 | 248 | -5,36 | ||||
| 2026-01-30 | 13F | Keybank National Association/oh | 7.197 | -8,39 | 451 | -12,45 | ||||
| 2026-02-17 | 13F | Jones Financial Companies Lllp | 621 | 38,00 | 39 | 31,03 | ||||
| 2026-02-06 | 13F | Covestor Ltd | 4 | 100,00 | 0 | |||||
| 2026-02-12 | 13F | Ensign Peak Advisors, Inc | 2.080 | -67,40 | 130 | -68,82 | ||||
| 2026-02-09 | 13F | Fisher Asset Management, LLC | 367.148 | -6,16 | 23.005 | -10,23 | ||||
| 2026-02-12 | 13F | Ankerstar Wealth, LLC | 2 | 0 | ||||||
| 2026-01-26 | 13F | KBC Group NV | 986 | 0,00 | 0 | |||||
| 2026-02-11 | 13F | Ameritas Investment Partners, Inc. | 2.848 | 178 | ||||||
| 2026-01-28 | 13F | Klp Kapitalforvaltning As | 7.400 | 5,71 | 464 | 1,09 | ||||
| 2026-01-23 | 13F | Deprince Race & Zollo Inc | 488.295 | 93,84 | 30.597 | 85,44 | ||||
| 2026-02-10 | 13F | Goldman Sachs Group Inc | 366.689 | 60,71 | 22.977 | 53,75 | ||||
| 2026-02-13 | 13F | Barclays Plc | 63.754 | -15,86 | 3.995 | -11,48 | ||||
| 2026-02-09 | 13F | Annis Gardner Whiting Capital Advisors, LLC | 0 | -100,00 | 0 | |||||
| 2026-02-11 | 13F | Gilpin Wealth Management, Llc | 2 | 0 | ||||||
| 2026-02-12 | 13F | DRW Securities, LLC | 6.122 | 384 | ||||||
| 2026-02-17 | 13F | Point72 Asset Management, L.P. | 78.038 | 4.890 | ||||||
| 2026-02-13 | 13F | Public Employees Retirement Association Of Colorado | 746 | 0,00 | 0 | |||||
| 2026-02-05 | 13F | HFM Investment Advisors, LLC | 2 | 0,00 | 0 | |||||
| 2025-11-13 | 13F | Norges Bank | 0 | -100,00 | 0 | |||||
| 2026-02-12 | 13F | Quadrant Capital Group Llc | 50 | 0,00 | 3 | 0,00 | ||||
| 2026-02-17 | 13F | Schonfeld Strategic Advisors LLC | 5.761 | 361 | ||||||
| 2025-10-22 | 13F | Geneos Wealth Management Inc. | 0 | -100,00 | 0 | -100,00 | ||||
| 2026-01-21 | 13F | Yousif Capital Management, Llc | 9.217 | -13,92 | 592 | -15,69 | ||||
| 2026-01-29 | 13F | Pictet Asset Management Holding SA | 5.093 | 18,72 | 319 | 13,93 | ||||
| 2026-02-12 | 13F | BlackRock, Inc. | 4.960.241 | 0,92 | 310.809 | -3,46 | ||||
| 2026-02-13 | 13F | Manufacturers Life Insurance Company, The | 0 | -100,00 | 0 | |||||
| 2026-02-06 | 13F | HighTower Advisors, LLC | 4.360 | -1,51 | 273 | -5,54 | ||||
| 2026-02-13 | 13F | Y-Intercept (Hong Kong) Ltd | 35.585 | 339,92 | 2.230 | 321,36 | ||||
| 2026-02-11 | 13F | Siena Capital Partners GP, LLC | 60.973 | 0,00 | 3.821 | -4,33 | ||||
| 2026-02-13 | 13F | American Century Companies Inc | 675.721 | -0,98 | 42.341 | -5,27 | ||||
| 2026-02-17 | 13F | Two Sigma Advisers, Lp | 18.700 | -49,18 | 1.172 | -51,41 | ||||
| 2026-01-14 | 13F | Tradewinds Capital Management, LLC | 6.992 | 0,00 | 438 | -4,16 | ||||
| 2026-02-17 | 13F | Northern Trust Corp | 431.659 | -5,40 | 27.048 | -9,50 | ||||
| 2026-02-13 | 13F | Citigroup Inc | 31.844 | -46,01 | 1.995 | -48,34 |