Grundlæggende statistik
| Institutionelle aktier (lange) | 16.507.392 - 49,21% (ex 13D/G) - change of -4,44MM shares -21,21% MRQ |
| Institutionel værdi (lang) | $ 1.742.587 USD ($1000) |
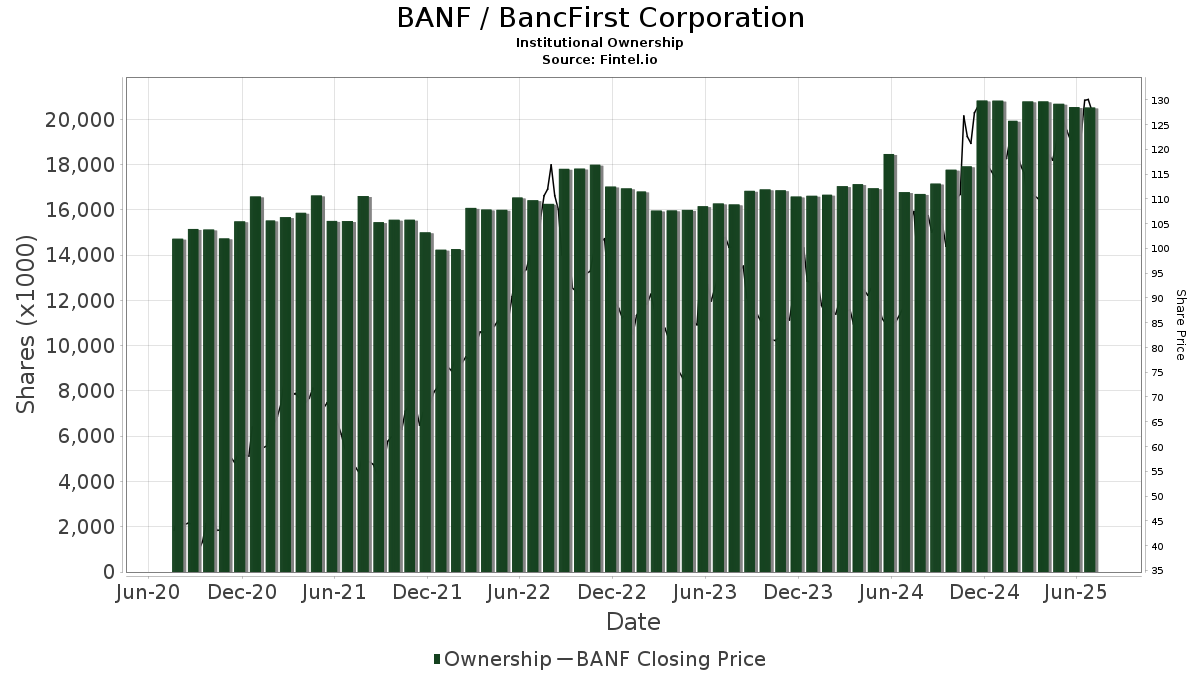
Institutionelt ejerskab og aktionærer
BancFirst Corporation (US:BANF) har 263 institutionelle ejere og aktionærer, der har indsendt 13D/G- eller 13F-formularer til Securities Exchange Commission (SEC). Disse institutioner har i alt 16,507,392 aktier. Største aktionærer omfatter BlackRock, Inc., Kayne Anderson Rudnick Investment Management Llc, Vanguard Group Inc, State Street Corp, Dimensional Fund Advisors Lp, BancFirst Trust & Investment Management, Geode Capital Management, Llc, Wells Fargo & Company/mn, Fuller & Thaler Asset Management, Inc., and Norges Bank .
BancFirst Corporation (NasdaqGS:BANF) institutionel ejerskabsstruktur viser aktuelle positioner i virksomheden efter institutioner og fonde, samt seneste ændringer i positionsstørrelse. Større aktionærer kan omfatte individuelle investorer, investeringsforeninger, hedgefonde eller institutioner. Skema 13D angiver, at investoren besidder (eller besidder) mere end 5 % af virksomheden og har til hensigt (eller har til hensigt at) aktivt at forfølge en ændring i forretningsstrategi. Skema 13G indikerer en passiv investering på over 5%.
The share price as of March 27, 2026 is 106,72 / share. Previously, on March 28, 2025, the share price was 109,51 / share. This represents a decline of 2,55% over that period.
Fondens stemningsscore
Fund Sentiment Score (fka Ownership Accumulation Score) finder de aktier, der bliver mest købt af fonde. Det er resultatet af en sofistikeret, multi-faktor kvantitativ model, der identificerer virksomheder med de højeste niveauer af institutionel akkumulering. Scoringsmodellen bruger en kombination af den samlede stigning i oplyste ejere, ændringerne i porteføljeallokeringer i disse ejere og andre målinger. Tallet går fra 0 til 100, hvor højere tal indikerer et højere niveau af akkumulering for sine jævnaldrende, og 50 er gennemsnittet.
Opdateringsfrekvens: Dagligt
Se Ownership Explorer, som giver en liste over højest rangerende virksomheder.
AI+ Ask Fintel’s AI assistant about BancFirst Corporation.
Select a question to share a public post with an AI-crafted answer.
Thinking of good questions…
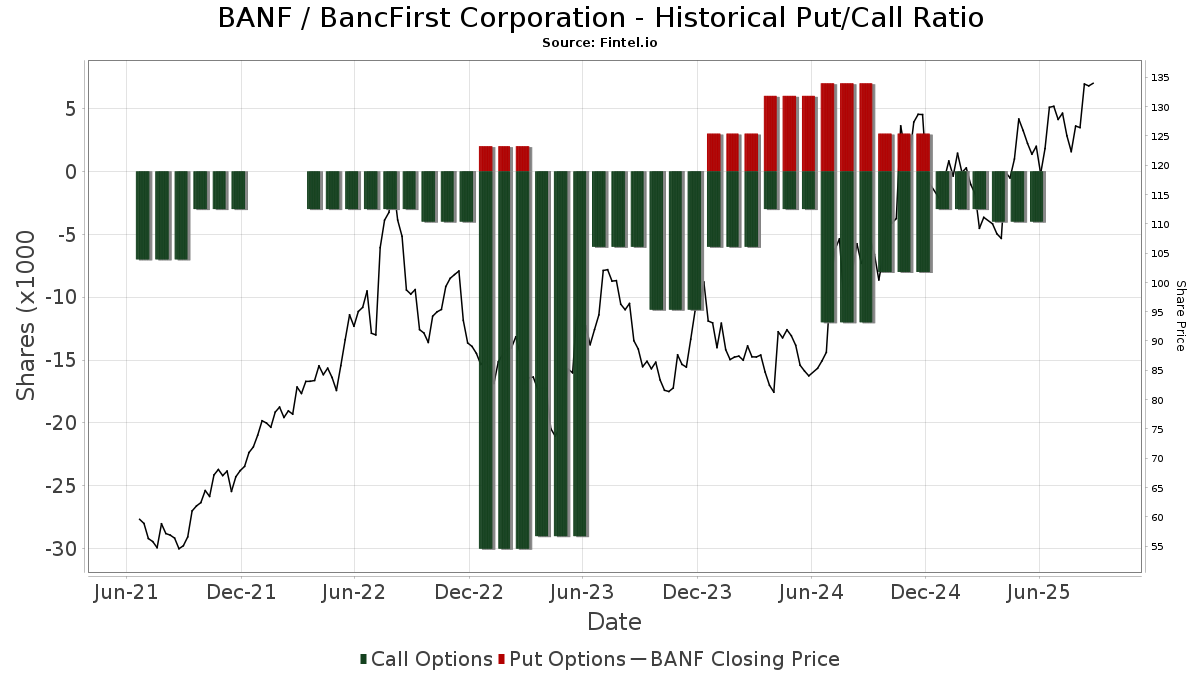
Institutionel Put/Call-forhold
Ud over at indberette standardaktie- og gældsudstedelser skal institutter med mere end 100 mill. aktiver under forvaltning også oplyse deres put- og call-optionsbeholdninger. Da salgsoptioner generelt indikerer negativ stemning, og købsoptioner indikerer positiv stemning, kan vi få en fornemmelse af den overordnede institutionelle stemning ved at plotte forholdet mellem put og kald. Diagrammet til højre viser det historiske put/call-forhold for dette instrument.
Brug af Put/Call Ratio som en indikator for investorernes stemning overvinder en af de vigtigste mangler ved at bruge totalt institutionelt ejerskab, som er, at en betydelig mængde af aktiver under forvaltning investeres passivt for at spore indekser. Passivt forvaltede fonde køber typisk ikke optioner, så indikatoren for put/call-forholdet følger mere nøje følelsen af aktivt forvaltede fonde.
13D/G-arkivering
Vi præsenterer 13D/G ansøgninger separat fra 13F ansøgninger på grund af den forskellige behandling af SEC. 13D/G-ansøgninger kan indgives af grupper af investorer (med én ledende), hvorimod 13F-ansøgninger ikke kan. Dette resulterer i situationer, hvor en investor kan indsende en 13D/G, der rapporterer én værdi for de samlede aktier (der repræsenterer alle de aktier, der ejes af investorgruppen), men derefter indsender en 13F, der rapporterer en anden værdi for de samlede aktier (der udelukkende repræsenterer deres egne) ejendomsret). Det betyder, at aktieejerskab af 13D/G-arkiver og 13F-arkiveringer ofte ikke er direkte sammenlignelige, så vi præsenterer dem separat.
Bemærk: Fra den 16. maj 2021 viser vi ikke længere ejere, der ikke har indsendt en 13D/G inden for det seneste år. Tidligere viste vi den fulde historie af 13D/G-arkiver. Generelt skal enheder, der er forpligtet til at indgive 13D/G-ansøgninger, indgive mindst årligt, før de indsender en afsluttende ansøgning. Dog forlader fonde nogle gange positioner uden at indsende en afsluttende ansøgning (dvs. de afvikler), så visning af den fulde historie resulterede nogle gange i forvirring om det nuværende ejerskab. For at undgå forvirring viser vi nu kun 'aktuelle' ejere - det vil sige - ejere, der har anmeldt inden for det seneste år.
Upgrade to unlock premium data.
| Fil dato | Form | Investor | Forrige Aktier |
Seneste Aktier |
Δ Aktier (Procent) |
Ejendomsret (Procent) |
Δ Ejerskab (Procent) |
|
|---|---|---|---|---|---|---|---|---|
| 2026-03-26 | VANGUARD GROUP INC | 2,149,673 | 0 | -100.00 | 0.00 | -100.00 | ||
| 2025-08-13 | KAYNE ANDERSON RUDNICK INVESTMENT MANAGEMENT LLC | 2,158,302 | 2,537,991 | 17.59 | 7.60 | 15.85 |
13F og NPORT arkivering
Detaljer om 13F-arkivering er gratis. Detaljer om NP-ansøgninger kræver et premium-medlemskab. Grønne rækker angiver nye positioner. Røde rækker angiver lukkede positioner. Klik på linket ikon for at se den fulde transaktionshistorik.
Opgrader
for at låse premium-data op og eksportere til Excel ![]() .
.
| Fil dato | Kilde | Investor | Type | Gennemsnitlig pris (Øst) |
Aktier | Δ Aktier (%) |
Rapporteret Værdi ($1000) |
Δ Værdi (%) |
Port Alloc (%) |
|
|---|---|---|---|---|---|---|---|---|---|---|
| 2026-02-03 | 13F | Bokf, Na | 0 | -100,00 | 0 | |||||
| 2026-02-12 | 13F | Fuller & Thaler Asset Management, Inc. | 270.370 | -0,24 | 28.665 | -16,36 | ||||
| 2026-02-03 | 13F | Capstone Triton Financial Group, LLC | 15.066 | 3,25 | 1.597 | -13,44 | ||||
| 2025-10-15 | 13F | Stephens Consulting, LLC | 0 | -100,00 | 0 | |||||
| 2026-01-16 | 13F | Louisiana State Employees Retirement System | 9.500 | 0,00 | 1.007 | -16,15 | ||||
| 2026-02-13 | 13F | Pathstone Holdings, LLC | 1.949 | -19,99 | 207 | -33,12 | ||||
| 2026-02-10 | 13F | Argent Trust Co | 0 | -100,00 | 0 | |||||
| 2026-02-13 | 13F | Healthcare Of Ontario Pension Plan Trust Fund | 27.286 | 2.893 | ||||||
| 2026-01-15 | 13F | Nisa Investment Advisors, Llc | 216 | -18,18 | 23 | -30,30 | ||||
| 2026-02-06 | 13F | Quantum Private Wealth, LLC | 0 | -100,00 | 0 | |||||
| 2026-02-13 | 13F | Marshall Wace, Llp | 22.934 | 2.431 | ||||||
| 2026-02-13 | 13F | Public Employees Retirement Association Of Colorado | 1.902 | 0,00 | 0 | |||||
| 2026-02-17 | 13F | Point72 Asset Management, L.P. | 3.074 | 326 | ||||||
| 2026-02-17 | 13F | Schonfeld Strategic Advisors LLC | 3.010 | 319 | ||||||
| 2026-02-12 | 13F | DRW Securities, LLC | 2.328 | 32,88 | 247 | 11,31 | ||||
| 2026-02-17 | 13F | CWM Advisors, LLC | 4.407 | 22,59 | 467 | 2,86 | ||||
| 2025-11-14 | 13F | Texas Permanent School Fund | 0 | -100,00 | 0 | -100,00 | ||||
| 2026-02-10 | 13F | Commonwealth Of Pennsylvania Public School Empls Retrmt Sys | 5.116 | -2,72 | 542 | -18,50 | ||||
| 2026-02-06 | 13F | Vestmark Advisory Solutions, Inc. | 18.539 | -5,63 | 1.966 | -20,86 | ||||
| 2025-11-07 | 13F | Hodges Capital Management Inc. | 41.500 | 8,64 | 5.248 | 11,12 | ||||
| 2026-02-13 | 13F | Police & Firemen's Retirement System of New Jersey | 5.785 | 0,10 | 613 | -16,03 | ||||
| 2026-02-12 | 13F | Bank Of Montreal /can/ | 4.153 | 32,85 | 440 | 11,39 | ||||
| 2026-02-17 | 13F | Clark Capital Management Group, Inc. | 0 | -100,00 | 0 | |||||
| 2026-01-21 | 13F | Flagship Harbor Advisors, Llc | 5 | 1 | ||||||
| 2026-02-12 | 13F | Alps Advisors Inc | 3.448 | 1,11 | 366 | -15,31 | ||||
| 2026-02-17 | 13F | Canada Pension Plan Investment Board | 2.600 | 276 | ||||||
| 2026-02-17 | 13F | Aquatic Capital Management LLC | 803 | -85,65 | 85 | -87,98 | ||||
| 2026-02-19 | 13F | Invesco Ltd. | 154.645 | -5,42 | 16.395 | -20,71 | ||||
| 2026-02-13 | 13F | MAI Capital Management | 0 | -100,00 | 0 | |||||
| 2026-01-29 | 13F | Sanctuary Advisors, LLC | 4.172 | -13,50 | 442 | -27,42 | ||||
| 2026-02-17 | 13F | Janus Henderson Group Plc | 10.486 | 19,74 | 1.111 | 0,27 | ||||
| 2026-01-26 | 13F | KBC Group NV | 656 | 0,00 | 0 | |||||
| 2026-02-13 | 13F | Stifel Financial Corp | 22.874 | -11,85 | 2.425 | -26,09 | ||||
| 2026-01-27 | 13F | Evergreen Capital Management Llc | 1.890 | -28,76 | 201 | -40,18 | ||||
| 2026-02-10 | 13F | Goldman Sachs Group Inc | 125.698 | 20,07 | 13.327 | 0,67 | ||||
| 2026-02-11 | 13F | Parallel Advisors, LLC | 919 | 0,55 | 97 | -15,65 | ||||
| 2026-01-30 | 13F/A | M&t Bank Corp | 2.281 | 0,22 | 242 | -16,03 | ||||
| 2026-01-27 | 13F | GHP Investment Advisors, Inc. | 374 | 0,00 | 40 | -17,02 | ||||
| 2026-02-14 | 13F | Rockefeller Capital Management L.P. | 1.996 | 12,58 | 212 | -5,80 | ||||
| 2026-02-17 | 13F | Millennium Management Llc | 78.441 | 8.316 | ||||||
| 2026-02-18 | 13F | State of Tennessee, Treasury Department | 4.443 | -24,16 | 489 | -34,05 | ||||
| 2026-02-12 | 13F | Principal Securities, Inc. | 0 | -100,00 | 0 | |||||
| 2026-01-29 | 13F | UBS Group AG | 27.593 | -19,62 | 2.925 | -32,62 | ||||
| 2026-02-13 | 13F | Prudential Financial Inc | 19.259 | -6,15 | 2.081 | -19,81 | ||||
| 2026-02-13 | 13F | Cynosure Management, Llc | 3.852 | 408 | ||||||
| 2026-01-26 | 13F | Whittier Trust Co Of Nevada Inc | 358 | 0,00 | 39 | -15,56 | ||||
| 2026-02-02 | 13F | Sachetta, LLC | 102 | 0,00 | 11 | -16,67 | ||||
| 2026-02-13 | 13F | Manufacturers Life Insurance Company, The | 0 | -100,00 | 0 | |||||
| 2026-01-23 | 13F | Avion Wealth | 0 | -100,00 | 0 | |||||
| 2026-02-12 | 13F | Custom Index Systems, Llc | 2.427 | -34,67 | 257 | -45,20 | ||||
| 2026-01-09 | 13F | Diversified Trust Co | 5.250 | 45,23 | 557 | 21,66 | ||||
| 2026-02-17 | 13F | Cetera Investment Advisers | 4.154 | -13,82 | 440 | -27,75 | ||||
| 2026-01-29 | 13F | Vanguard Group Inc | 2.272.814 | -0,41 | 240.964 | -16,50 | ||||
| 2026-02-17 | 13F | Raymond James Financial Inc | 133.109 | -0,79 | 14.112 | -16,82 | ||||
| 2026-02-17 | 13F | State Of Wisconsin Investment Board | 0 | -100,00 | 0 | -100,00 | ||||
| 2026-02-12 | 13F | Cibc World Markets Corp | 0 | -100,00 | 0 | |||||
| 2026-01-12 | 13F | Curated Wealth Partners LLC | 4.457 | 30,55 | 473 | 9,51 | ||||
| 2026-01-29 | 13F | Teachers Retirement System Of The State Of Kentucky | 5.050 | -6,12 | 1 | |||||
| 2025-11-12 | 13F | Aster Capital Management (DIFC) Ltd | 0 | -100,00 | 0 | -100,00 | ||||
| 2026-02-17 | 13F | Lazard Asset Management Llc | 11.442 | 3,75 | 1.213 | -12,98 | ||||
| 2025-11-21 | 13F/A | CIBC Bancorp USA Inc. | 2.227 | 282 | ||||||
| 2026-02-10 | 13F | Envestnet Asset Management Inc | 36.729 | -18,76 | 3.894 | -31,88 | ||||
| 2026-02-09 | 13F | Harbour Investments, Inc. | 695 | 74 | ||||||
| 2026-01-28 | 13F | Teacher Retirement System Of Texas | 7.021 | -17,91 | 744 | -31,17 | ||||
| 2026-02-06 | 13F | Bare Financial Services, Inc | 20 | -45,95 | 2 | -50,00 | ||||
| 2025-11-13 | 13F | Dynamic Technology Lab Private Ltd | 0 | -100,00 | 0 | -100,00 | ||||
| 2026-01-29 | 13F | Comerica Bank | 11.947 | -17,17 | 1.267 | -30,55 | ||||
| 2026-02-12 | 13F | Voya Investment Management Llc | 3.846 | 0,00 | 408 | -16,26 | ||||
| 2026-02-06 | 13F | EverSource Wealth Advisors, LLC | 494 | -2,56 | 52 | -18,75 | ||||
| 2026-02-13 | 13F | Kestra Advisory Services, LLC | 390 | 41 | ||||||
| 2026-02-05 | 13F | Atria Investments Llc | 15.283 | -8,88 | 1.620 | -23,58 | ||||
| 2026-02-10 | 13F | Mutual Of America Capital Management Llc | 34.576 | -4,31 | 3.663 | -19,41 | ||||
| 2026-02-17 | 13F | California State Teachers Retirement System | 20.654 | -0,09 | 2.190 | -16,23 | ||||
| 2026-01-08 | 13F | Wealth Enhancement Advisory Services, Llc | 0 | -100,00 | 0 | -100,00 | ||||
| 2025-11-14 | 13F/A | Skopos Labs, Inc. | 0 | -100,00 | 0 | |||||
| 2026-02-05 | 13F | Thrivent Financial For Lutherans | 14.201 | -4,68 | 2 | 0,00 | ||||
| 2026-02-06 | 13F | Gsa Capital Partners Llp | 0 | -100,00 | 0 | |||||
| 2026-02-17 | 13F | Ameriprise Financial Inc | 42.038 | -7,54 | 4.457 | -22,47 | ||||
| 2026-02-13 | 13F | Great West Life Assurance Co /can/ | 17.986 | -24,54 | 2 | -66,67 | ||||
| 2026-01-14 | 13F | Mitchell & Pahl Private Wealth, Llc | 9.801 | 1.039 | ||||||
| 2025-09-29 | NP | DPST - Direxion Daily Regional Banks Bull 3X Shares | 14.090 | -3,01 | 1.754 | 2,51 | ||||
| 2026-02-02 | 13F | Bay Harbor Wealth Management, LLC | 2 | -33,33 | 0 | |||||
| 2026-02-17 | 13F | Dark Forest Capital Management Lp | 28.926 | 27,57 | 3.067 | 6,94 | ||||
| 2025-11-12 | 13F | Park Square Financial Group, LLC | 0 | -100,00 | 0 | -100,00 | ||||
| 2026-01-20 | 13F | Harbor Capital Advisors, Inc. | 118 | -1,67 | 0 | |||||
| 2026-03-06 | 13F | Hsbc Holdings Plc | 4.433 | 470 | ||||||
| 2026-02-13 | 13F | Charles Schwab Investment Management Inc | 189.037 | -0,87 | 20.042 | -16,88 | ||||
| 2026-01-23 | 13F | Private Wealth Management Group, LLC | 15 | 0,00 | 2 | 0,00 | ||||
| 2026-02-17 | 13F | Alliancebernstein L.p. | 28.071 | 7,67 | 2.976 | -9,71 | ||||
| 2026-02-13 | 13F | Quarry LP | 31 | -85,97 | 3 | -88,89 | ||||
| 2026-02-13 | 13F | Rhumbline Advisers | 58.485 | -3,39 | 6.201 | -19,01 | ||||
| 2026-01-14 | 13F | Jfs Wealth Advisors, Llc | 39 | 34,48 | 4 | 33,33 | ||||
| 2026-02-10 | 13F | Lido Advisors, LLC | 8.159 | 0,00 | 1.033 | -0,19 | ||||
| 2026-02-04 | 13F | Oregon Public Employees Retirement Fund | 4.752 | 2,15 | 504 | -14,46 | ||||
| 2026-02-03 | 13F | SBI Securities Co., Ltd. | 5 | 0,00 | 1 | |||||
| 2026-02-12 | 13F | Xponance, Inc. | 0 | -100,00 | 0 | |||||
| 2026-02-06 | 13F | Cullen/frost Bankers, Inc. | 312 | 13,87 | 33 | -2,94 | ||||
| 2026-02-03 | 13F | Everence Capital Management Inc | 2.790 | 0,00 | 0 | |||||
| 2026-02-17 | 13F | Occudo Quantitative Strategies Lp | 6.416 | 680 | ||||||
| 2026-01-23 | 13F | Tectonic Advisors Llc | 0 | -100,00 | 0 | |||||
| 2026-02-13 | 13F | Walleye Capital LLC | 2.953 | 313 | ||||||
| 2026-02-13 | 13F | Mariner, LLC | 4.095 | 11,40 | 431 | -7,33 | ||||
| 2026-02-13 | 13F | Victory Capital Management Inc | 27.978 | 7,90 | 2.966 | -9,52 | ||||
| 2026-01-23 | 13F | State of Alaska, Department of Revenue | 11.997 | 1,82 | 1 | 0,00 | ||||
| 2026-01-28 | 13F | Geneos Wealth Management Inc. | 3.522 | 0,00 | 373 | -16,18 | ||||
| 2026-01-15 | 13F | Fortitude Family Office, LLC | 8 | -20,00 | 1 | -100,00 | ||||
| 2026-01-26 | 13F | Cwm, Llc | 389 | -34,29 | 0 | |||||
| 2026-02-13 | 13F | National Bank Of Canada /fi/ | 1.255 | -10,04 | 133 | -25,00 | ||||
| 2026-02-10 | 13F | Intech Investment Management Llc | 8.789 | 0,00 | 932 | -16,20 | ||||
| 2026-02-06 | 13F | Global Retirement Partners, LLC | 205 | 6,77 | 22 | -12,50 | ||||
| 2026-02-17 | 13F | Public Employees Retirement System Of Ohio | 136 | -1,45 | 14 | -17,65 | ||||
| 2026-02-17 | 13F | Bridgeway Capital Management Inc | 12.400 | -33,69 | 1.315 | -44,42 | ||||
| 2026-01-28 | 13F | Universal- Beteiligungs- und Servicegesellschaft mbH | 2.143 | -10,18 | 230 | -23,92 | ||||
| 2026-02-03 | 13F | NewEdge Wealth, LLC | 18.586 | -5,33 | 1.970 | -9,30 | ||||
| 2026-02-17 | 13F | Fmr Llc | 63.084 | -1,50 | 6.688 | -17,41 | ||||
| 2026-02-13 | 13F | Parkside Financial Bank & Trust | 1.551 | 11,90 | 164 | -6,29 | ||||
| 2026-02-13 | 13F | Public Sector Pension Investment Board | 0 | -100,00 | 0 | |||||
| 2026-01-15 | 13F | Capital Advisors Inc/ok | 3.146 | 0,00 | 334 | -16,12 | ||||
| 2026-02-06 | 13F | Pnc Financial Services Group, Inc. | 845 | 49,56 | 90 | 25,35 | ||||
| 2026-02-03 | 13F | SummerHaven Investment Management, LLC | 6.477 | 0,00 | 687 | -16,24 | ||||
| 2026-02-10 | 13F | Connor, Clark & Lunn Investment Management Ltd. | 2.110 | 10,94 | 224 | -7,08 | ||||
| 2026-02-12 | 13F | State Board Of Administration Of Florida Retirement System | 5.624 | 0,00 | 596 | -16,17 | ||||
| 2026-02-17 | 13F | Wiley Bros.-aintree Capital, Llc | 15.996 | 3,90 | 1.696 | -13,07 | ||||
| 2026-02-10 | 13F | State of Wyoming | 0 | -100,00 | 0 | |||||
| 2026-02-06 | 13F | IFP Advisors, Inc | 328 | 0,00 | 35 | -17,07 | ||||
| 2026-02-05 | 13F | Bessemer Group Inc | 6.935 | 22,31 | 1 | |||||
| 2026-02-13 | 13F | OMERS ADMINISTRATION Corp | 0 | -100,00 | 0 | |||||
| 2026-02-13 | 13F | Entropy Technologies, LP | 5.202 | 552 | ||||||
| 2025-11-14 | 13F | Two Sigma Investments, Lp | 0 | -100,00 | 0 | -100,00 | ||||
| 2026-02-12 | 13F | BRYN MAWR TRUST Co | 0 | -100,00 | 0 | -100,00 | ||||
| 2026-01-08 | 13F | True Wealth Design, LLC | 8 | -27,27 | 1 | -100,00 | ||||
| 2026-02-12 | 13F | Renaissance Technologies Llc | 22.569 | 513,45 | 2.393 | 414,41 | ||||
| 2026-02-05 | 13F | Td Private Client Wealth Llc | 401 | 0,00 | 43 | -16,00 | ||||
| 2026-02-09 | 13F | Key FInancial Inc | 46 | 0,00 | 5 | -20,00 | ||||
| 2026-01-23 | 13F | Farther Finance Advisors, LLC | 101 | 24,69 | 11 | 0,00 | ||||
| 2026-01-23 | 13F | Assetmark, Inc | 33 | -5,71 | 3 | -25,00 | ||||
| 2026-02-13 | 13F | Rafferty Asset Management, LLC | 20.414 | 4,71 | 2.164 | -12,21 | ||||
| 2025-10-30 | 13F | Twin Peaks Wealth Advisors, LLC | 0 | -100,00 | 0 | -100,00 | ||||
| 2026-02-17 | 13F | Qube Research & Technologies Ltd | 62.863 | -18,52 | 6.665 | -31,69 | ||||
| 2026-02-17 | 13F | Mercer Global Advisors Inc /adv | 17.594 | 8,52 | 1.865 | -9,02 | ||||
| 2026-02-17 | 13F | Voloridge Investment Management, Llc | 32.290 | 35,39 | 3.423 | 13,53 | ||||
| 2026-02-17 | 13F | Numerai GP LLC | 11.094 | 1.176 | ||||||
| 2026-02-17 | 13F | Susquehanna Portfolio Strategies, LLC | 9.131 | -36,70 | 968 | -46,93 | ||||
| 2026-02-03 | 13F | Wesbanco Bank Inc | 4.260 | 0,00 | 452 | -16,17 | ||||
| 2026-02-06 | 13F | ProShare Advisors LLC | 4.058 | 3,23 | 430 | -13,48 | ||||
| 2026-02-11 | 13F | Los Angeles Capital Management Llc | 576 | -97,25 | 63 | -97,62 | ||||
| 2026-02-12 | 13F | Swiss National Bank | 42.718 | 2,15 | 4.529 | -14,36 | ||||
| 2026-02-06 | 13F | Ironwood Investment Counsel, LLC | 11.427 | 0,00 | 1.211 | -16,14 | ||||
| 2025-09-29 | NP | KCXIX - Knights of Columbus U.S. All Cap Index Fund I Shares | 83 | 7,79 | 10 | 11,11 | ||||
| 2026-02-13 | 13F | Sei Investments Co | 36.713 | -4,22 | 3.892 | -19,70 | ||||
| 2026-02-12 | 13F | Dimensional Fund Advisors Lp | 892.946 | -2,12 | 94.675 | -17,94 | ||||
| 2026-01-08 | 13F | Versant Capital Management, Inc | 0 | -100,00 | 0 | -100,00 | ||||
| 2026-02-13 | 13F | Integrated Wealth Concepts LLC | 0 | -100,00 | 0 | -100,00 | ||||
| 2026-02-13 | 13F | Anb Bank | 0 | -100,00 | 0 | |||||
| 2026-02-17 | 13F | Quantinno Capital Management LP | 4.922 | 6,08 | 522 | -11,09 | ||||
| 2026-01-23 | 13F | Eagle Bay Advisors LLC | 379 | 40 | ||||||
| 2026-02-13 | 13F | Kayne Anderson Rudnick Investment Management Llc | 2.614.640 | -8,29 | 277.204 | -23,11 | ||||
| 2026-02-17 | 13F | Royal Bank Of Canada | 24.046 | -15,32 | 2.549 | -29,00 | ||||
| 2025-09-29 | NP | SUNAMERICA SERIES TRUST - SA Small Cap Index Portfolio Class 1 | 2.399 | 5,96 | 299 | 12,03 | ||||
| 2026-02-12 | 13F | CIBC Private Wealth Group, LLC | 22 | -15,38 | 2 | -33,33 | ||||
| 2026-01-22 | 13F | Richardson Financial Services Inc. | 0 | -100,00 | 0 | -100,00 | ||||
| 2026-02-17 | 13F | Susquehanna International Group, Llp | 12.044 | 12,11 | 1.277 | -6,04 | ||||
| 2026-02-06 | 13F | Profund Advisors Llc | 2.597 | 47,89 | 275 | 23,87 | ||||
| 2026-02-17 | 13F | Susquehanna International Group, Llp | Put | 2.300 | 21,05 | 244 | 1,25 | |||
| 2026-02-05 | 13F | Northwestern Mutual Wealth Management Co | 1.278 | 708,86 | 65 | 236,84 | ||||
| 2026-01-28 | 13F | Arizona State Retirement System | 6.075 | -4,80 | 644 | -20,10 | ||||
| 2026-02-12 | 13F | New York State Common Retirement Fund | 6.586 | -26,71 | 698 | -38,56 | ||||
| 2026-02-17 | 13F | Balyasny Asset Management Llc | 2.324 | 19,61 | 246 | 0,41 | ||||
| 2026-02-17 | 13F | Bank Of America Corp /de/ | 108.533 | 12,87 | 11.507 | -5,37 | ||||
| 2026-01-28 | 13F | John W. Rosenthal Capital Management, Inc. | 26.105 | 0,00 | 2.768 | -16,15 | ||||
| 2026-02-17 | 13F | Russell Investments Group, Ltd. | 2.628 | 42,90 | 279 | 19,83 | ||||
| 2026-01-30 | 13F | Torren Management, LLC | 626 | 66 | ||||||
| 2026-02-12 | 13F | Steward Partners Investment Advisory, Llc | 1.499 | 3,74 | 159 | -13,19 | ||||
| 2026-02-09 | 13F | Atlantic Trust, LLC | 0 | -100,00 | 0 | |||||
| 2026-02-10 | 13F | Quantbot Technologies LP | 5.477 | 581 | ||||||
| 2026-02-13 | 13F | SRS Capital Advisors, Inc. | 58 | -53,60 | 6 | -60,00 | ||||
| 2026-02-17 | 13F | Kemnay Advisory Services Inc. | 72 | 8 | ||||||
| 2026-02-02 | 13F | Principal Financial Group Inc | 120.235 | 6,08 | 12.747 | -11,06 | ||||
| 2026-02-03 | 13F | Farmers & Merchants Investments Inc | 11 | 0,00 | 1 | 0,00 | ||||
| 2026-02-17 | 13F | Tower Research Capital LLC (TRC) | 610 | -21,29 | 65 | -34,02 | ||||
| 2026-02-12 | 13F | Wealthspire Advisors, LLC | 0 | -100,00 | 0 | |||||
| 2026-01-30 | 13F | Us Bancorp \de\ | 409 | 6,79 | 43 | -10,42 | ||||
| 2026-02-17 | 13F | Susquehanna International Group, Llp | Call | 4.300 | -8,51 | 456 | -23,40 | |||
| 2026-02-03 | 13F | Plan Group Financial, LLC | 7.244 | 768 | ||||||
| 2026-02-05 | 13F | Allworth Financial LP | 263 | -10,85 | 28 | -27,03 | ||||
| 2026-02-13 | 13F | Caitong International Asset Management Co., Ltd | 31 | -40,38 | 3 | -50,00 | ||||
| 2026-01-06 | 13F | JBR Co Financial Management Inc | 10.068 | -0,05 | 1.067 | -16,18 | ||||
| 2026-01-30 | 13F | Ares Financial Consulting, LLC | 22 | 2 | ||||||
| 2026-02-12 | 13F | Pinnacle Holdings, LLC | 360 | 0,00 | 38 | -15,56 | ||||
| 2026-02-13 | 13F | BNP Paribas Asset Management Holding S.A. | 236 | 34,09 | 0 | |||||
| 2026-01-05 | 13F | GAMMA Investing LLC | 841 | -11,29 | 89 | -25,21 | ||||
| 2026-01-20 | 13F | Signaturefd, Llc | 1.873 | 5,22 | 199 | -12,00 | ||||
| 2026-02-04 | 13F | Ameritas Advisory Services, LLC | 0 | -100,00 | 0 | |||||
| 2026-02-13 | 13F | Smartleaf Asset Management LLC | 337 | -1,17 | 36 | -16,28 | ||||
| 2026-02-24 | 13F | Bell Investment Advisors, Inc | 44 | 0,00 | 5 | -20,00 | ||||
| 2026-02-17 | 13F | MIRAE ASSET GLOBAL ETFS HOLDINGS Ltd. | 9.697 | 0,26 | 1.028 | -15,94 | ||||
| 2026-01-29 | 13F | UMA Financial Services, Inc. | 0 | -100,00 | 0 | |||||
| 2026-02-09 | 13F | Hantz Financial Services, Inc. | 41 | 215,38 | 0 | |||||
| 2026-02-17 | 13F | Jump Financial, LLC | 2.069 | 219 | ||||||
| 2026-02-12 | 13F | Great Lakes Advisors, Llc | 0 | -100,00 | 0 | |||||
| 2026-01-12 | 13F | Rialto Wealth Management, LLC | 2 | 0,00 | 0 | |||||
| 2026-02-18 | 13F | Caitlin John, LLC | 0 | 0 | ||||||
| 2026-01-16 | 13F | DiNuzzo Private Wealth, Inc. | 6 | 0,00 | 1 | |||||
| 2026-02-12 | 13F | Advisors Asset Management, Inc. | 1.245 | 9,50 | 132 | -8,39 | ||||
| 2026-01-27 | 13F | Zurcher Kantonalbank (Zurich Cantonalbank) | 3.340 | 0,00 | 354 | -16,11 | ||||
| 2026-02-06 | 13F | Tortoise Investment Management, LLC | 0 | -100,00 | 0 | |||||
| 2026-02-13 | 13F | Verition Fund Management LLC | 168.591 | 30,77 | 17.874 | 9,65 | ||||
| 2026-02-10 | 13F | Bank of New York Mellon Corp | 160.031 | -7,93 | 16.966 | -22,81 | ||||
| 2026-02-13 | 13F | Wells Fargo & Company/mn | 281.160 | -3,08 | 29.809 | -18,74 | ||||
| 2025-10-24 | 13F | Meeder Asset Management Inc | 0 | -100,00 | 0 | -100,00 | ||||
| 2026-02-17 | 13F | Voleon Capital Management Lp | 2.658 | 282 | ||||||
| 2026-02-11 | 13F | BI Asset Management Fondsmaeglerselskab A/S | 0 | -100,00 | 0 | |||||
| 2025-11-14 | 13F | Horizon Investments, LLC | 0 | -100,00 | 0 | |||||
| 2026-01-09 | 13F | SG Americas Securities, LLC | 11.722 | 1.012,14 | 1 | |||||
| 2026-01-07 | 13F | Massmutual Trust Co Fsb/adv | 3 | 0,00 | 0 | |||||
| 2026-02-10 | 13F | Rothschild Investment Llc | 30 | 0,00 | 3 | 0,00 | ||||
| 2026-02-10 | 13F | Bnp Paribas Arbitrage, Sa | 6.952 | -44,93 | 737 | -53,82 | ||||
| 2026-01-22 | 13F | Advantage Alpha Capital Partners LP | 0 | -100,00 | 0 | |||||
| 2026-02-09 | 13F | Huntington National Bank | 0 | -100,00 | 0 | |||||
| 2026-02-11 | 13F | LPL Financial LLC | 5.840 | -17,92 | 619 | -31,15 | ||||
| 2026-02-13 | 13F | Sterling Capital Management LLC | 223 | 34,34 | 24 | 15,00 | ||||
| 2025-09-29 | NP | CRSSX - CATHOLIC RESPONSIBLE INVESTMENTS SMALL-CAP FUND Institutional Shares | 7.877 | -1,51 | 981 | 4,03 | ||||
| 2026-02-12 | 13F | Nuveen, LLC | 45.866 | -2,40 | 4.863 | -18,18 | ||||
| 2026-02-17 | 13F | Twinbeech Capital Lp | 1.992 | 211 | ||||||
| 2026-02-13 | 13F | Morgan Stanley | 242.422 | 16,42 | 25.702 | -2,39 | ||||
| 2026-01-21 | 13F | SJS Investment Consulting Inc. | 4 | 0,00 | 0 | |||||
| 2026-01-29 | 13F | D.a. Davidson & Co. | 3.132 | 0,00 | 332 | -16,16 | ||||
| 2026-02-13 | 13F | Ubs Asset Management Americas Inc | 39.517 | -2,82 | 4.190 | -18,52 | ||||
| 2026-02-17 | 13F | Maryland State Retirement & Pension System | 3.028 | 1,99 | 321 | -14,40 | ||||
| 2025-11-12 | 13F | Group One Trading, L.p. | Put | 0 | -100,00 | 0 | -100,00 | |||
| 2026-02-03 | 13F | Denali Advisors Llc | 3.100 | -71,56 | 329 | -76,20 | ||||
| 2026-02-10 | 13F | Smith Group Asset Management, LLC | 2.052 | -0,05 | 218 | -16,22 | ||||
| 2026-02-12 | 13F | Jane Street Group, Llc | 33.417 | 71,84 | 3.543 | 44,04 | ||||
| 2026-02-12 | 13F | Quadrant Capital Group Llc | 3.659 | -0,38 | 388 | -16,59 | ||||
| 2026-02-17 | 13F | Citadel Advisors Llc | 70.880 | 89,35 | 7.515 | 58,76 | ||||
| 2026-02-17 | 13F | Tudor Investment Corp Et Al | 31.105 | 933,05 | 3.298 | 767,63 | ||||
| 2026-02-17 | 13F | Price T Rowe Associates Inc /md/ | 20.031 | 3,45 | 2 | 0,00 | ||||
| 2026-02-09 | 13F | Quest Partners LLC | 862 | 0,00 | 91 | -16,51 | ||||
| 2026-02-17 | 13F | Aqr Capital Management Llc | 10.739 | -21,34 | 1.139 | -34,07 | ||||
| 2026-02-17 | 13F | Algert Global Llc | 0 | -100,00 | 0 | |||||
| 2025-11-12 | 13F | Transce3nd, LLC | 0 | -100,00 | 0 | |||||
| 2025-09-29 | NP | CFSLX - Column Small Cap Fund | 25 | 0,00 | 3 | 0,00 | ||||
| 2026-02-09 | 13F | Keating Financial Advisory Services, Inc. | 20 | 2 | ||||||
| 2025-11-17 | 13F | Kestra Investment Management, LLC | 0 | -100,00 | 0 | |||||
| 2025-09-29 | NP | RZG - Invesco S&P SmallCap 600 Pure Growth ETF This fund is a listed as child fund of Invesco Ltd. and if that institution has disclosed ownership in this security, then these positions will not be double counted when calculating total shares and total value | 2.471 | -9,92 | 308 | -4,95 | ||||
| 2026-02-13 | 13F | Pacific Center for Financial Services | 1.750 | 0,00 | 221 | 0,00 | ||||
| 2025-09-29 | NP | PRFZ - Invesco FTSE RAFI US 1500 Small-Mid ETF This fund is a listed as child fund of Invesco Ltd. and if that institution has disclosed ownership in this security, then these positions will not be double counted when calculating total shares and total value | 18.586 | -9,34 | 2.314 | -4,18 | ||||
| 2026-02-05 | 13F | Wakefield Asset Management LLLP | 0 | -100,00 | 0 | |||||
| 2026-02-09 | 13F | Geode Capital Management, Llc | 515.916 | -0,18 | 54.705 | -16,31 | ||||
| 2025-09-29 | NP | RSSL - Global X Russell 2000 ETF | 10.685 | -11,54 | 1.330 | -6,54 | ||||
| 2026-02-10 | 13F | Root Financial Partners, LLC | 100 | -11,50 | 11 | -28,57 | ||||
| 2026-02-12 | 13F | Cloud Capital Management, LLC | 0 | -100,00 | 0 | |||||
| 2026-02-17 | 13F | Gallagher Fiduciary Advisors, LLC | 7.702 | 4,89 | 817 | -12,07 | ||||
| 2026-02-02 | 13F | Fifth Third Bancorp | 78 | 90,24 | 8 | 60,00 | ||||
| 2026-02-12 | 13F | Brown Brothers Harriman & Co | 66 | 0,00 | 7 | -25,00 | ||||
| 2026-02-17 | 13F | Optiver Holding B.V. | 32 | -61,90 | 3 | -70,00 | ||||
| 2026-01-22 | 13F | Apollon Wealth Management, LLC | 3.267 | -0,49 | 346 | -16,63 | ||||
| 2026-02-12 | 13F | MetLife Investment Management, LLC | 11.376 | -5,94 | 1.206 | -21,12 | ||||
| 2026-02-17 | 13F | Crawford Investment Counsel Inc | 0 | -100,00 | 0 | |||||
| 2026-02-13 | 13F | JustInvest LLC | 0 | -100,00 | 0 | |||||
| 2026-02-13 | 13F | Umb Bank N A/mo | 124 | 39,33 | 13 | 18,18 | ||||
| 2026-02-13 | 13F | State Street Corp | 1.375.873 | 7,58 | 146.537 | -9,74 | ||||
| 2026-02-06 | 13F | Handelsbanken Fonder AB | 4.958 | 0,00 | 1 | |||||
| 2025-11-14 | 13F | Squarepoint Ops LLC | 0 | -100,00 | 0 | -100,00 | ||||
| 2026-02-11 | 13F | Jpmorgan Chase & Co | 114.717 | -7,48 | 12.162 | -22,42 | ||||
| 2026-02-11 | 13F | Simplex Trading, Llc | 98 | 10 | ||||||
| 2026-02-11 | 13F | Illinois Municipal Retirement Fund | 11.086 | 7,30 | 1.175 | -10,03 | ||||
| 2026-02-13 | 13F | Liberty One Investment Management, Llc | 0 | -100,00 | 0 | |||||
| 2026-01-27 | 13F | Regions Financial Corp | 40.544 | 1,26 | 4.298 | -15,11 | ||||
| 2026-01-21 | 13F | Retirement Investment Advisors, Inc. | 0 | -100,00 | 0 | |||||
| 2026-01-28 | 13F | Salomon & Ludwin, LLC | 111 | -21,28 | 12 | -35,29 | ||||
| 2026-02-17 | 13F | Zacks Investment Management | 24.538 | -6,76 | 2.601 | -21,82 | ||||
| 2025-11-14 | 13F | Full Sail Capital, LLC | 15.930 | -4,20 | 2.014 | -2,00 | ||||
| 2025-10-24 | 13F | Hemington Wealth Management | 60 | 1,69 | 0 | |||||
| 2026-02-13 | 13F | First Trust Advisors Lp | 73.523 | -20,29 | 7.795 | -33,17 | ||||
| 2026-02-17 | 13F | Susquehanna Fundamental Investments, Llc | 8.284 | 0,00 | 878 | -16,14 | ||||
| 2026-02-12 | 13F | Federated Hermes, Inc. | 12.365 | 34,24 | 1.311 | 12,54 | ||||
| 2025-11-03 | 13F | Annis Gardner Whiting Capital Advisors, LLC | 0 | -100,00 | 0 | |||||
| 2026-02-05 | 13F | Cambridge Investment Research Advisors, Inc. | 2.676 | 15,34 | 0 | |||||
| 2026-02-06 | 13F | Legacy Financial Group, Inc. | 9.675 | 20,83 | 1.026 | 1,28 | ||||
| 2026-01-05 | 13F | BancFirst Trust & Investment Management | 852.081 | -3,89 | 92.076 | -18,68 | ||||
| 2026-02-09 | 13F | New Age Alpha Advisors, LLC | 604 | -37,92 | 64 | -47,97 | ||||
| 2026-01-07 | 13F | Impact Capital Partners LLC | 3.842 | -22,99 | 407 | -35,40 | ||||
| 2026-02-06 | 13F | HighTower Advisors, LLC | 3.276 | -2,59 | 347 | -18,35 | ||||
| 2026-02-10 | 13F | Heritage Trust Co | 3.959 | 0,00 | 420 | -16,20 | ||||
| 2026-02-19 | 13F | CI Private Wealth, LLC | 3.623 | 56,37 | 384 | 31,06 | ||||
| 2026-02-12 | 13F | BlackRock, Inc. | 3.074.356 | 1,40 | 325.943 | -14,98 | ||||
| 2026-02-06 | 13F | Covestor Ltd | 519 | -36,40 | 0 | |||||
| 2026-02-11 | 13F | Gilpin Wealth Management, Llc | 2 | 0 | ||||||
| 2026-01-30 | 13F | Arlington Trust Co LLC | 0 | -100,00 | 0 | |||||
| 2026-01-28 | 13F | Klp Kapitalforvaltning As | 4.600 | 0,00 | 490 | -16,12 | ||||
| 2026-02-05 | 13F | Amalgamated Bank | 6.007 | 1,92 | 1 | |||||
| 2026-02-11 | 13F | Ameritas Investment Partners, Inc. | 1.745 | 185 | ||||||
| 2026-02-17 | 13F | Advisor Group Holdings, Inc. | 885 | -82,89 | 94 | -85,87 | ||||
| 2026-02-17 | 13F | Prelude Capital Management, Llc | 2.154 | 228 | ||||||
| 2026-02-13 | 13F | Champlain Investment Partners, LLC | 0 | -100,00 | 0 | |||||
| 2026-02-13 | 13F | Pinnacle Wealth Planning Services, Inc. | 491 | 52 | ||||||
| 2026-01-16 | 13F | Ronald Blue Trust, Inc. | 347 | -5,45 | 37 | -21,74 | ||||
| 2026-02-06 | 13F | Larson Financial Group LLC | 2 | 0,00 | 0 | |||||
| 2026-02-12 | 13F | Callan Family Office, LLC | 27.925 | -16,66 | 2.961 | -30,12 | ||||
| 2026-02-04 | 13F | Pensionmark Financial Group, Llc | 2.854 | -16,74 | 303 | -30,25 | ||||
| 2026-02-13 | 13F | Citigroup Inc | 19.840 | 8,69 | 2.103 | -8,88 | ||||
| 2026-02-05 | 13F | HFM Investment Advisors, LLC | 2 | 0,00 | 0 | |||||
| 2026-02-17 | 13F | Advisory Services Network, LLC | 0 | -100,00 | 0 | |||||
| 2026-02-11 | 13F | Deutsche Bank Ag\ | 19.854 | 3,75 | 2.105 | -13,02 | ||||
| 2026-02-11 | 13F | Cerity Partners LLC | 2.300 | -41,00 | 244 | -50,61 | ||||
| 2026-02-11 | 13F | Franklin Resources Inc | 2.596 | -24,78 | 275 | -36,93 | ||||
| 2026-02-12 | 13F | Hm Payson & Co | 226 | 0,00 | 24 | -17,86 | ||||
| 2026-01-23 | 13F | Burney Co/ | 0 | -100,00 | 0 | |||||
| 2026-02-17 | 13F | Northern Trust Corp | 241.179 | -4,16 | 25.570 | -19,65 | ||||
| 2026-02-09 | 13F | Legal & General Group Plc | 52.670 | -6,05 | 5.584 | -21,22 | ||||
| 2026-02-13 | 13F | American Century Companies Inc | 153.261 | 35,58 | 16.249 | 13,67 | ||||
| 2026-01-30 | 13F | New York State Teachers Retirement System | 4.237 | 0,00 | 0 | |||||
| 2026-02-13 | 13F | Barclays Plc | 39.792 | 28,43 | 4.219 | 7,68 | ||||
| 2026-02-17 | 13F | Jones Financial Companies Lllp | 452 | 134,20 | 48 | 88,00 | ||||
| 2026-02-17 | 13F | Guggenheim Capital Llc | 11.232 | -11,04 | 1.191 | -25,44 | ||||
| 2026-02-17 | 13F | First Manhattan Co | 0 | -100,00 | 0 | |||||
| 2026-01-21 | 13F | Yousif Capital Management, Llc | 5.566 | -12,18 | 621 | -22,60 | ||||
| 2026-02-17 | 13F | Creative Planning | 12.779 | -28,82 | 1.355 | -40,35 | ||||
| 2026-02-10 | 13F | Norges Bank | 261.493 | 27.723 | ||||||
| 2026-02-13 | 13F | Y-Intercept (Hong Kong) Ltd | 16.316 | 1.730 | ||||||
| 2026-01-29 | 13F | Pictet Asset Management Holding SA | 3.019 | 0,00 | 320 | -16,01 | ||||
| 2026-02-13 | 13F | Edgestream Partners, L.P. | 4.310 | 13,72 | 457 | -4,80 | ||||
| 2026-02-12 | 13F | Ensign Peak Advisors, Inc | 1.829 | -71,10 | 194 | -75,87 |
Other Listings
| DE:BF1 | 89,00 € |