Grundlæggende statistik
| Institutionelle ejere | 184 total, 179 long only, 0 short only, 5 long/short - change of 14,91% MRQ |
| Gennemsnitlig porteføljeallokering | 0.0544 % - change of 30,88% MRQ |
| Institutionelle aktier (lange) | 2.849.238 (ex 13D/G) - change of 0,40MM shares 16,30% MRQ |
| Institutionel værdi (lang) | $ 231.999 USD ($1000) |
Institutionelt ejerskab og aktionærer
ARK ETF Trust - ARK Autonomous Technology & Robotics ETF (US:ARKQ) har 184 institutionelle ejere og aktionærer, der har indsendt 13D/G- eller 13F-formularer til Securities Exchange Commission (SEC). Disse institutioner har i alt 2,849,238 aktier. Største aktionærer omfatter Bank Of America Corp /de/, Morgan Stanley, LPL Financial LLC, Wells Fargo & Company/mn, DRW Securities, LLC, Kingstone Capital Partners Texas, LLC, Prudential Plc, Brookstone Capital Management, Raymond James Financial Inc, and EWG Elevate Inc. .
ARK ETF Trust - ARK Autonomous Technology & Robotics ETF (BATS:ARKQ) institutionel ejerskabsstruktur viser aktuelle positioner i virksomheden efter institutioner og fonde, samt seneste ændringer i positionsstørrelse. Større aktionærer kan omfatte individuelle investorer, investeringsforeninger, hedgefonde eller institutioner. Skema 13D angiver, at investoren besidder (eller besidder) mere end 5 % af virksomheden og har til hensigt (eller har til hensigt at) aktivt at forfølge en ændring i forretningsstrategi. Skema 13G indikerer en passiv investering på over 5%.
The share price as of September 15, 2025 is 103,11 / share. Previously, on September 16, 2024, the share price was 56,20 / share. This represents an increase of 83,47% over that period.

Fondens stemningsscore
Fund Sentiment Score (fka Ownership Accumulation Score) finder de aktier, der bliver mest købt af fonde. Det er resultatet af en sofistikeret, multi-faktor kvantitativ model, der identificerer virksomheder med de højeste niveauer af institutionel akkumulering. Scoringsmodellen bruger en kombination af den samlede stigning i oplyste ejere, ændringerne i porteføljeallokeringer i disse ejere og andre målinger. Tallet går fra 0 til 100, hvor højere tal indikerer et højere niveau af akkumulering for sine jævnaldrende, og 50 er gennemsnittet.
Opdateringsfrekvens: Dagligt
Se Ownership Explorer, som giver en liste over højest rangerende virksomheder.
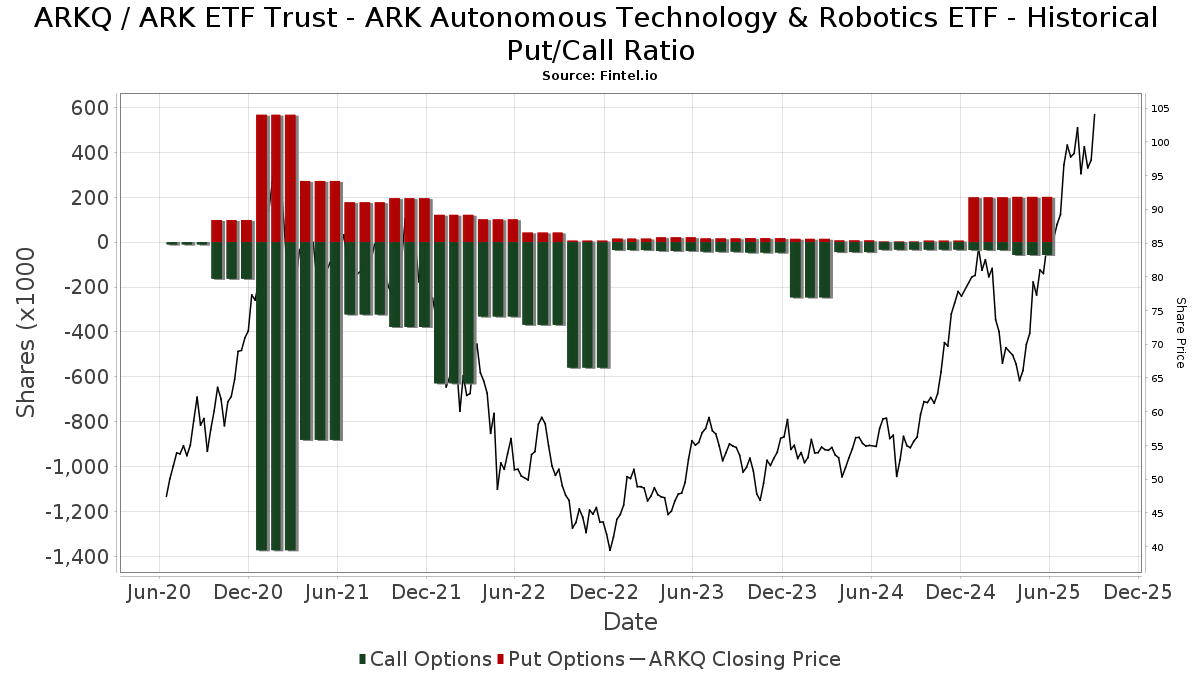
Institutionel Put/Call-forhold
Ud over at indberette standardaktie- og gældsudstedelser skal institutter med mere end 100 mill. aktiver under forvaltning også oplyse deres put- og call-optionsbeholdninger. Da salgsoptioner generelt indikerer negativ stemning, og købsoptioner indikerer positiv stemning, kan vi få en fornemmelse af den overordnede institutionelle stemning ved at plotte forholdet mellem put og kald. Diagrammet til højre viser det historiske put/call-forhold for dette instrument.
Brug af Put/Call Ratio som en indikator for investorernes stemning overvinder en af de vigtigste mangler ved at bruge totalt institutionelt ejerskab, som er, at en betydelig mængde af aktiver under forvaltning investeres passivt for at spore indekser. Passivt forvaltede fonde køber typisk ikke optioner, så indikatoren for put/call-forholdet følger mere nøje følelsen af aktivt forvaltede fonde.
13F og NPORT arkivering
Detaljer om 13F-arkivering er gratis. Detaljer om NP-ansøgninger kræver et premium-medlemskab. Grønne rækker angiver nye positioner. Røde rækker angiver lukkede positioner. Klik på linket ikon for at se den fulde transaktionshistorik.
Opgrader
for at låse premium-data op og eksportere til Excel ![]() .
.
| Fil dato | Kilde | Investor | Type | Gennemsnitlig pris (Øst) |
Aktier | Δ Aktier (%) |
Rapporteret Værdi ($1000) |
Δ Værdi (%) |
Port Alloc (%) |
|
|---|---|---|---|---|---|---|---|---|---|---|
| 2025-08-12 | 13F | J.w. Cole Advisors, Inc. | 2.825 | 252 | ||||||
| 2025-08-14 | 13F | Citadel Advisors Llc | Put | 3.700 | -48,61 | 330 | -31,03 | |||
| 2025-08-14 | 13F | CoreCap Advisors, LLC | 14 | 0,00 | 1 | |||||
| 2025-08-14 | 13F | Colony Group, LLC | 2.311 | 206 | ||||||
| 2025-07-25 | 13F | Atria Wealth Solutions, Inc. | 4.534 | -40,69 | 404 | -20,36 | ||||
| 2025-07-11 | 13F | Wealth Management Partners, LLC | 16.164 | -3,04 | 1.425 | 29,08 | ||||
| 2025-08-14 | 13F | Citadel Advisors Llc | Call | 15.300 | 21,43 | 1.364 | 63,55 | |||
| 2025-08-12 | 13F | Fairscale Capital, LLC | 1.999 | 0,00 | 194 | 46,97 | ||||
| 2025-07-08 | 13F | Strategic Advocates LLC | 19.113 | 3,70 | 1.704 | 39,56 | ||||
| 2025-08-06 | 13F | Csenge Advisory Group | 9.258 | -23,85 | 736 | -6,36 | ||||
| 2025-08-12 | 13F | SRS Capital Advisors, Inc. | 8.115 | 10,42 | 724 | 48,77 | ||||
| 2025-05-15 | 13F | Hrt Financial Lp | 0 | -100,00 | 0 | |||||
| 2025-08-11 | 13F | Rothschild Investment Llc | 10 | 0,00 | 1 | |||||
| 2025-08-14 | 13F | Wealth Advisors of Tampa Bay, LLC | 0 | -100,00 | 0 | |||||
| 2025-08-15 | 13F | Captrust Financial Advisors | 4.215 | 376 | ||||||
| 2025-08-08 | 13F | Atlantic Trust, LLC | 5.080 | 0,00 | 453 | 34,52 | ||||
| 2025-08-11 | 13F | HighTower Advisors, LLC | 14.852 | 3,02 | 1.324 | 38,64 | ||||
| 2025-08-05 | 13F | Fourth Dimension Wealth, LLC | 1 | 0,00 | 0 | |||||
| 2025-07-22 | 13F | Powell Investment Advisors, LLC | 865 | 77 | ||||||
| 2025-08-12 | 13F | Steward Partners Investment Advisory, Llc | 5.132 | -30,30 | 458 | -6,16 | ||||
| 2025-07-17 | 13F | Investment Research & Advisory Group, Inc. | 32 | 3 | ||||||
| 2025-08-14 | 13F | Glen Eagle Advisors, LLC | 90 | 0,00 | 8 | 60,00 | ||||
| 2025-05-16 | 13F | Coppell Advisory Solutions LLC | 0 | -100,00 | 0 | |||||
| 2025-08-11 | 13F | Western Wealth Management, LLC | 2.853 | -6,76 | 254 | 7,63 | ||||
| 2025-08-13 | 13F | StoneX Group Inc. | 2.815 | -10,35 | 251 | 20,67 | ||||
| 2025-08-11 | 13F | Aptus Capital Advisors, LLC | 8 | 0,00 | 1 | |||||
| 2025-08-14 | 13F | Harwood Advisory Group, LLC | 132 | -1,49 | 12 | 10,00 | ||||
| 2025-08-18 | 13F/A | National Bank Of Canada /fi/ | 595 | -38,85 | 53 | -17,19 | ||||
| 2025-07-14 | 13F | Armstrong Advisory Group, Inc | 107 | 10 | ||||||
| 2025-08-07 | 13F | Montag A & Associates Inc | 298 | 0,00 | 27 | 36,84 | ||||
| 2025-05-06 | 13F | Rsm Us Wealth Management Llc | 0 | -100,00 | 0 | |||||
| 2025-08-13 | 13F | IAG Wealth Partners, LLC | 797 | 0,00 | 71 | 36,54 | ||||
| 2025-07-15 | 13F | Mather Group, Llc. | 6.429 | 0,00 | 573 | 34,82 | ||||
| 2025-07-17 | 13F | Saxon Interests, Inc. | 4.344 | 0,00 | 288 | 0,00 | ||||
| 2025-07-31 | 13F | Whipplewood Advisors, LLC | 0 | -100,00 | 0 | |||||
| 2025-05-02 | 13F | Transcendent Capital Group LLC | 0 | -100,00 | 0 | |||||
| 2025-08-15 | 13F | First Heartland Consultants, Inc. | 0 | -100,00 | 0 | |||||
| 2025-08-12 | 13F | Park Square Financial Group, LLC | 0 | -100,00 | 0 | |||||
| 2025-08-18 | 13F | Geneos Wealth Management Inc. | 767 | 539,17 | 68 | 871,43 | ||||
| 2025-08-12 | 13F | Wood Tarver Financial Group, LLC | 299 | 0,00 | 0 | -100,00 | ||||
| 2025-08-13 | 13F | Mount Yale Investment Advisors, LLC | 12 | 1 | ||||||
| 2025-08-18 | 13F | Wolverine Trading, Llc | Put | 2.500 | 221 | |||||
| 2025-07-08 | 13F | Nbc Securities, Inc. | 1.750 | -39,88 | 0 | |||||
| 2025-07-14 | 13F | Abound Wealth Management | 0 | -100,00 | 0 | |||||
| 2025-08-18 | 13F | Wolverine Trading, Llc | Call | 8.100 | 716 | |||||
| 2025-08-14 | 13F | Murphy & Mullick Capital Management Corp | 70 | 0,00 | 6 | 50,00 | ||||
| 2025-08-13 | 13F | Scotia Capital Inc. | 3.207 | 0,63 | 286 | 35,07 | ||||
| 2025-08-11 | 13F/A | Purus Wealth Management, LLC | 6.869 | -0,04 | 612 | 34,51 | ||||
| 2025-07-23 | 13F | Nbt Bank N A /ny | 126 | 0,00 | 11 | 37,50 | ||||
| 2025-05-16 | 13F/A | Kestra Investment Management, LLC | 0 | -100,00 | 0 | |||||
| 2025-07-29 | 13F | JTC Employer Solutions Trusteee Ltd | 2.165 | 0,00 | 0 | |||||
| 2025-07-31 | 13F | Oppenheimer Asset Management Inc. | 8.221 | 0,88 | 733 | 35,99 | ||||
| 2025-05-15 | 13F | Barclays Plc | 0 | -100,00 | 0 | |||||
| 2025-07-17 | 13F | Eagle Wealth Strategies Llc | 3.026 | 270 | ||||||
| 2025-08-06 | 13F | Commonwealth Equity Services, Llc | 48.179 | -5,67 | 4 | 33,33 | ||||
| 2025-05-12 | 13F | Kohmann Bosshard Financial Services, LLC | 0 | -100,00 | 0 | |||||
| 2025-05-13 | 13F | EverSource Wealth Advisors, LLC | 0 | -100,00 | 0 | |||||
| 2025-07-22 | 13F | Mascoma Wealth Management LLC | 0 | -100,00 | 0 | |||||
| 2025-08-11 | 13F | TD Waterhouse Canada Inc. | 215 | -20,96 | 19 | 5,56 | ||||
| 2025-08-14 | 13F | Wells Fargo & Company/mn | 187.515 | 16,35 | 16.721 | 56,58 | ||||
| 2025-05-13 | 13F | Tyler-Stone Wealth Management | 0 | -100,00 | 0 | |||||
| 2025-08-11 | 13F | Principal Securities, Inc. | 711 | -15,46 | 63 | -3,08 | ||||
| 2025-08-12 | 13F | Archer Investment Corp | 105 | 0,00 | 9 | 50,00 | ||||
| 2025-08-14 | 13F | Smartleaf Asset Management LLC | 77 | 7 | ||||||
| 2025-07-16 | 13F/A | CX Institutional | 21 | 0 | ||||||
| 2025-08-06 | 13F | Aspect Partners, LLC | 0 | -100,00 | 0 | |||||
| 2025-04-08 | 13F | Parallel Advisors, LLC | 0 | -100,00 | 0 | |||||
| 2025-08-14 | 13F | Susquehanna International Group, Llp | 31.375 | -14,05 | 2.798 | 15,67 | ||||
| 2025-07-24 | 13F | Us Bancorp \de\ | 2.366 | 0,00 | 211 | 34,62 | ||||
| 2025-08-14 | 13F | Susquehanna International Group, Llp | Put | 2.300 | 205 | |||||
| 2025-08-14 | 13F | Susquehanna International Group, Llp | Call | 9.600 | 856 | |||||
| 2025-07-16 | 13F | Signaturefd, Llc | 2.505 | 2,00 | 223 | 37,65 | ||||
| 2025-07-17 | 13F | Global Trust Asset Management, LLC | 550 | 175,00 | 49 | 276,92 | ||||
| 2025-07-25 | 13F | Cwm, Llc | 21.175 | 1,26 | 2 | 0,00 | ||||
| 2025-07-18 | 13F | Truist Financial Corp | 22.287 | 568,08 | 1.987 | 799,10 | ||||
| 2025-08-12 | 13F | Jaffetilchin Investment Partners, LLC | 4.002 | 357 | ||||||
| 2025-05-12 | 13F | Simplex Trading, Llc | 0 | -100,00 | 0 | |||||
| 2025-08-07 | 13F | Kestra Private Wealth Services, Llc | 2.602 | 232 | ||||||
| 2025-08-14 | 13F | DHK Financial Advisors, Inc. | 10.425 | 0,00 | 930 | 34,64 | ||||
| 2025-05-15 | 13F | Citadel Advisors Llc | 0 | -100,00 | 0 | -100,00 | ||||
| 2025-08-13 | 13F | Kilter Group LLC | 397 | 35 | ||||||
| 2025-08-05 | 13F | Huntington National Bank | 21 | 40,00 | ||||||
| 2025-08-14 | 13F | Marshall Investment Management, Llc | 0 | -100,00 | 0 | |||||
| 2025-07-16 | 13F | Essex Financial Services, Inc. | 2.923 | 261 | ||||||
| 2025-08-01 | 13F | Envestnet Asset Management Inc | 40.626 | 79,06 | 3.623 | 140,98 | ||||
| 2025-04-25 | 13F | WASHINGTON TRUST Co | 0 | -100,00 | 0 | |||||
| 2025-07-28 | 13F | BRYN MAWR TRUST Co | 0 | -100,00 | 0 | |||||
| 2025-08-01 | 13F | Bessemer Group Inc | 12 | 0,00 | 0 | |||||
| 2025-07-18 | 13F | PFG Investments, LLC | 3.600 | 321 | ||||||
| 2025-08-13 | 13F | Northwestern Mutual Wealth Management Co | 3.644 | 20,03 | 325 | 61,19 | ||||
| 2025-07-21 | 13F | Credential Qtrade Securities Inc. | 0 | -100,00 | 0 | -100,00 | ||||
| 2025-07-23 | 13F | West Paces Advisors Inc. | 0 | -100,00 | 0 | |||||
| 2025-08-01 | 13F | Gwn Securities Inc. | 0 | -100,00 | 0 | |||||
| 2025-08-14 | 13F | Atomi Financial Group, Inc. | 10.036 | -2,92 | 895 | 30,70 | ||||
| 2025-08-11 | 13F | Blue Bell Private Wealth Management, Llc | 12 | 0,00 | 1 | |||||
| 2025-07-21 | 13F | Barrett & Company, Inc. | 247 | 0,00 | 22 | 37,50 | ||||
| 2025-08-08 | 13F | Advyzon Investment Management, LLC | 5.892 | 2,68 | 525 | 38,16 | ||||
| 2025-08-12 | 13F | Global Retirement Partners, LLC | 2.446 | 318,12 | 218 | 384,44 | ||||
| 2025-08-14 | 13F | Raymond James Financial Inc | 52.518 | 12,51 | 4.683 | 51,46 | ||||
| 2025-08-14 | 13F | Stifel Financial Corp | 17.731 | 25,47 | 1.581 | 68,91 | ||||
| 2025-03-21 | 13F | Prostatis Group LLC | 0 | -100,00 | 0 | |||||
| 2025-08-05 | 13F | Financial Sense Advisors, Inc. | 40.205 | 3.585 | ||||||
| 2025-08-15 | 13F | North Ridge Wealth Advisors, Inc. | 0 | -100,00 | 0 | |||||
| 2025-08-13 | 13F | Navis Wealth Advisors, LLC | 5.419 | 0,00 | 483 | 34,54 | ||||
| 2025-07-21 | 13F | DHJJ Financial Advisors, Ltd. | 1 | 0,00 | 0 | |||||
| 2025-08-04 | 13F | Roble, Belko & Company, Inc | 119 | 0 | ||||||
| 2025-08-14 | 13F | Heritage Wealth Management, Inc. | 2.709 | 242 | ||||||
| 2025-08-15 | 13F | Kestra Advisory Services, LLC | 15.895 | 2,65 | 1.417 | 38,11 | ||||
| 2025-05-02 | 13F | Capital A Wealth Management, LLC | 126 | -82,83 | 8 | -85,71 | ||||
| 2025-07-15 | 13F | Financial Management Professionals, Inc. | 352 | 0,00 | 31 | 34,78 | ||||
| 2025-08-11 | 13F | One Capital Management, LLC | 6.798 | 47,43 | 606 | 98,69 | ||||
| 2025-08-01 | 13F | Rossby Financial, LCC | 61 | 144,00 | 5 | 400,00 | ||||
| 2025-08-14 | 13F | Comerica Bank | 100 | -45,65 | 9 | -33,33 | ||||
| 2025-08-14 | 13F | GWM Advisors LLC | 6.992 | 44,58 | 623 | 94,69 | ||||
| 2025-08-12 | 13F | Prudential Plc | 78.450 | 23,84 | 6.995 | 66,67 | ||||
| 2025-08-14 | 13F | Qube Research & Technologies Ltd | 0 | -100,00 | 0 | |||||
| 2025-08-04 | 13F | Atria Investments Llc | 0 | -100,00 | 0 | |||||
| 2025-05-14 | 13F | Group One Trading, L.p. | 0 | -100,00 | 0 | -100,00 | ||||
| 2025-07-17 | 13F | Avondale Wealth Management | 345 | 0,00 | 31 | 36,36 | ||||
| 2025-08-05 | 13F | Bank of New York Mellon Corp | 14.972 | 0,00 | 1.335 | 34,58 | ||||
| 2025-08-14 | 13F | Jane Street Group, Llc | Put | 7.200 | -76,77 | 642 | -68,74 | |||
| 2025-08-14 | 13F | Jane Street Group, Llc | Call | 24.500 | 5,60 | 2.185 | 42,09 | |||
| 2025-09-04 | 13F/A | Advisor Group Holdings, Inc. | 28.299 | 19,02 | 2.524 | 60,25 | ||||
| 2025-08-12 | 13F | LPL Financial LLC | 310.658 | 30,21 | 27.701 | 75,23 | ||||
| 2025-08-05 | 13F | GPS Wealth Strategies Group, LLC | 35 | 0,00 | 3 | 50,00 | ||||
| 2025-08-08 | 13F | Avantax Advisory Services, Inc. | 37.278 | 39,78 | 3.324 | 88,12 | ||||
| 2025-07-31 | 13F | Cambridge Investment Research Advisors, Inc. | 26.716 | 1,72 | 2 | 100,00 | ||||
| 2025-08-19 | 13F | Advisory Services Network, LLC | 2.086 | 202 | ||||||
| 2025-07-11 | 13F | Kingstone Capital Partners Texas, LLC | 126.153 | 7 | ||||||
| 2025-08-14 | 13F | Sunbelt Securities, Inc. | 146 | 0,00 | 11 | 22,22 | ||||
| 2025-07-09 | 13F | Dynamic Advisor Solutions LLC | 2.813 | 251 | ||||||
| 2025-08-14 | 13F | Mercer Global Advisors Inc /adv | 12.170 | 0,75 | 1.085 | 35,63 | ||||
| 2025-08-07 | 13F | Tacita Capital Inc | 4.600 | 4,55 | 410 | 40,89 | ||||
| 2025-07-10 | 13F | Wealth Enhancement Advisory Services, Llc | 6.229 | 0,10 | 553 | 33,98 | ||||
| 2025-08-14 | 13F | EP Wealth Advisors, Inc. | 3.513 | 313 | ||||||
| 2025-08-14 | 13F | Federation des caisses Desjardins du Quebec | 993 | 0,00 | 89 | 35,38 | ||||
| 2025-08-07 | 13F | Traynor Capital Management, Inc. | 2.794 | 241 | ||||||
| 2025-08-11 | 13F | Covestor Ltd | 5 | 0 | ||||||
| 2025-07-31 | 13F | Wealthfront Advisers Llc | 38.830 | 13,36 | 3.462 | 52,58 | ||||
| 2025-08-11 | 13F | Compass Capital Corp /ma/ /adv | 6.151 | 471 | ||||||
| 2025-08-06 | 13F | First Horizon Advisors, Inc. | 6.311 | -1,16 | 563 | 32,86 | ||||
| 2025-08-07 | 13F | PFG Advisors | 6.006 | 1,69 | 536 | 36,83 | ||||
| 2025-08-13 | 13F | Walleye Capital LLC | 6.910 | -2,15 | 616 | 31,91 | ||||
| 2025-07-09 | 13F | Breakwater Investment Management | 0 | -100,00 | 0 | |||||
| 2025-07-31 | 13F | AlTi Global, Inc. | 12.186 | 0,00 | 1.087 | 34,57 | ||||
| 2025-08-04 | 13F | Whalen Wealth Management Inc. | 2.941 | 262 | ||||||
| 2025-07-11 | 13F | Farther Finance Advisors, LLC | 3.303 | -1,96 | 295 | 31,25 | ||||
| 2025-07-14 | 13F | UMA Financial Services, Inc. | 251 | 24,88 | 22 | 69,23 | ||||
| 2025-08-08 | 13F | Creative Planning | 5.008 | 12,16 | 447 | 51,19 | ||||
| 2025-08-11 | 13F | Private Advisor Group, LLC | 46.486 | 26,10 | 4.145 | 69,74 | ||||
| 2025-07-14 | 13F | Painted Porch Advisors LLC | 0 | -100,00 | 0 | -100,00 | ||||
| 2025-07-16 | 13F | Highline Wealth Partners Llc | 649 | -80,84 | 58 | -74,55 | ||||
| 2025-08-14 | 13F | Cubist Systematic Strategies, LLC | 6.992 | 623 | ||||||
| 2025-07-03 | 13F | Garde Capital, Inc. | 8 | 0,00 | 1 | |||||
| 2025-05-06 | 13F | Advisors Preferred, LLC | 0 | -100,00 | 0 | |||||
| 2025-08-08 | 13F | Cetera Investment Advisers | 20.852 | 1,19 | 1.859 | 36,19 | ||||
| 2025-08-14 | 13F | DRW Securities, LLC | Put | 187.000 | 15,01 | 16.675 | 54,78 | |||
| 2025-08-14 | 13F | DRW Securities, LLC | 10.405 | -80,03 | 928 | -73,14 | ||||
| 2025-08-14 | 13F | Fwl Investment Management, Llc | 684 | 61 | ||||||
| 2025-08-14 | 13F | Bank Of America Corp /de/ | 579.927 | -5,01 | 51.712 | 27,84 | ||||
| 2025-05-12 | 13F | Sandy Spring Bank | 48 | 0,00 | 3 | 0,00 | ||||
| 2025-08-12 | 13F | WealthTrak Capital Management LLC | 23 | 0,00 | 2 | 100,00 | ||||
| 2025-04-11 | 13F | Insight Advisors, LLC/ PA | 0 | -100,00 | 0 | |||||
| 2025-08-12 | 13F | Pathstone Holdings, LLC | 2.485 | 222 | ||||||
| 2025-05-19 | 13F/A | Jane Street Group, Llc | 0 | -100,00 | 0 | -100,00 | ||||
| 2025-08-14 | 13F | UBS Group AG | 20.333 | -57,85 | 1.813 | -43,26 | ||||
| 2025-05-08 | NP | QALTX - Quantified Alternative Investment Fund Investor Class Shares | 0 | -100,00 | 0 | -100,00 | ||||
| 2025-08-14 | 13F | Mml Investors Services, Llc | 12.697 | 8,12 | 1 | |||||
| 2025-07-17 | 13F | Wolff Wiese Magana Llc | 35 | 0,00 | 3 | 50,00 | ||||
| 2025-08-14 | 13F | NCP Inc. | 0 | -100,00 | 0 | |||||
| 2025-08-14 | 13F | Oxford Financial Group Ltd | 1.436 | 0,00 | 128 | 34,74 | ||||
| 2025-09-02 | 13F | Pvg Asset Management Corp | 5.612 | 500 | ||||||
| 2025-07-28 | 13F | Kiker Wealth Management, LLC | 0 | -100,00 | 0 | |||||
| 2025-07-29 | 13F | Activest Wealth Management | 190 | -58,70 | 17 | -46,67 | ||||
| 2025-08-13 | 13F | Green Harvest Asset Management LLC | 2.903 | 259 | ||||||
| 2025-08-13 | 13F | Crescent Grove Advisors, LLC | 13.088 | 2,22 | 1.167 | 37,62 | ||||
| 2025-05-09 | 13F | Headlands Technologies LLC | 0 | -100,00 | 0 | |||||
| 2025-08-06 | 13F | Atlantic Union Bankshares Corp | 48 | 4 | ||||||
| 2025-07-17 | 13F | Nelson, Van Denburg & Campbell Wealth Management Group, LLC | 2.520 | 225 | ||||||
| 2025-08-04 | 13F | Spire Wealth Management | 3.786 | -8,17 | 338 | 23,44 | ||||
| 2025-08-12 | 13F | Insigneo Advisory Services, Llc | 2.262 | 202 | ||||||
| 2025-08-14 | 13F | Mariner, LLC | 9.902 | -3,73 | 883 | 29,52 | ||||
| 2025-08-14 | 13F | D. E. Shaw & Co., Inc. | 6.556 | 65,81 | 585 | 123,75 | ||||
| 2025-07-30 | 13F | Capstone Triton Financial Group, LLC | 0 | -100,00 | 0 | |||||
| 2025-08-12 | 13F | Boreal Capital Management LLC | 150 | 13 | ||||||
| 2025-08-05 | 13F | Key FInancial Inc | 350 | 31 | ||||||
| 2025-08-13 | 13F | Renaissance Technologies Llc | 2.500 | -81,06 | 223 | -74,60 | ||||
| 2025-05-13 | 13F | Hartland & Co., LLC | 0 | -100,00 | 0 | |||||
| 2025-08-12 | 13F | Franklin Resources Inc | 1.500 | 134 | ||||||
| 2025-08-13 | 13F | Russell Investments Group, Ltd. | 150 | 417,24 | 13 | 1.200,00 | ||||
| 2025-07-29 | 13F | Stratos Wealth Partners, LTD. | 3.722 | 332 | ||||||
| 2025-07-28 | 13F | Harbour Investments, Inc. | 354 | 0,00 | 32 | 34,78 | ||||
| 2025-08-04 | 13F | Creative Financial Designs Inc /adv | 18 | 0,00 | 2 | 0,00 | ||||
| 2025-08-05 | 13F | Sigma Planning Corp | 3.172 | -19,96 | 283 | 7,63 | ||||
| 2025-08-07 | 13F | Allworth Financial LP | 2.045 | 0,00 | 182 | 30,00 | ||||
| 2025-08-04 | 13F | Integrity Alliance, Llc. | 0 | -100,00 | 0 | |||||
| 2025-08-08 | 13F | Tortoise Investment Management, LLC | 60 | 0,00 | 5 | 66,67 | ||||
| 2025-08-05 | 13F | Scarborough Advisors, LLC | 425 | 38 | ||||||
| 2025-08-15 | 13F | Morgan Stanley | 411.262 | 30,68 | 36.672 | 75,87 | ||||
| 2025-07-08 | 13F | Granite Bay Wealth Management, LLC | 3.300 | 0 | ||||||
| 2025-08-08 | 13F | Larson Financial Group LLC | 16 | 0,00 | 1 | 0,00 | ||||
| 2025-04-28 | 13F | Mutual Advisors, LLC | 0 | -100,00 | 0 | -100,00 | ||||
| 2025-07-17 | 13F | Beacon Capital Management, LLC | 337 | 0,00 | 30 | 36,36 | ||||
| 2025-07-30 | 13F | Brookstone Capital Management | 60.604 | -3,78 | 5.404 | 29,50 | ||||
| 2025-07-28 | 13F | Copia Wealth Management | 4.969 | -1,21 | 443 | 33,03 | ||||
| 2025-07-11 | 13F | Adirondack Trust Co | 28 | 0,00 | 2 | 100,00 | ||||
| 2025-08-12 | 13F | Marshall & Sterling Wealth Advisors Inc. | 172 | 0,58 | 15 | 36,36 | ||||
| 2025-05-12 | 13F | Citigroup Inc | 0 | -100,00 | 0 | |||||
| 2025-08-12 | 13F | CIBC Private Wealth Group, LLC | 86 | 0,00 | 8 | 40,00 | ||||
| 2025-08-19 | 13F | Newbridge Financial Services Group, Inc. | 9.679 | 863 | ||||||
| 2025-07-31 | 13F | Hartford Financial Management Inc. | 32.515 | -1,25 | 2.899 | 32,92 | ||||
| 2025-07-24 | 13F | IFP Advisors, Inc | 40 | 0,00 | 4 | 50,00 | ||||
| 2025-07-18 | 13F | SOA Wealth Advisors, LLC. | 276 | 0,00 | 25 | 33,33 | ||||
| 2025-07-22 | 13F | Belpointe Asset Management LLC | 4.406 | -1,12 | 393 | 32,88 | ||||
| 2025-04-24 | 13F | Decker Retirement Planning Inc. | 0 | -100,00 | 0 | |||||
| 2025-08-29 | 13F | Centaurus Financial, Inc. | 1.214 | -20,39 | 0 | |||||
| 2025-07-22 | 13F | Wealthcare Advisory Partners LLC | 2.509 | 224 | ||||||
| 2025-08-08 | 13F | Glassman Wealth Services | 200 | 0,00 | 18 | 30,77 | ||||
| 2025-08-11 | 13F | Hexagon Capital Partners LLC | 0 | -100,00 | 0 | |||||
| 2025-07-17 | 13F | Albion Financial Group /ut | 55 | 0,00 | 5 | 33,33 | ||||
| 2025-07-24 | 13F | Ronald Blue Trust, Inc. | 743 | -48,69 | 66 | -30,53 | ||||
| 2025-05-15 | 13F | Tower Research Capital LLC (TRC) | 0 | -100,00 | 0 | |||||
| 2025-07-23 | 13F | Gerber, Llc | 2.392 | 213 | ||||||
| 2025-07-30 | 13F | Financial Perspectives, Inc | 427 | -62,84 | 38 | -50,00 | ||||
| 2025-08-11 | 13F | Strategic Wealth Partners, Ltd. | 222 | 20 | ||||||
| 2025-07-10 | 13F | Oliver Lagore Vanvalin Investment Group | 2 | 0,00 | 0 | |||||
| 2025-08-08 | 13F | United Asset Strategies, Inc. | 3.847 | 0,00 | 343 | 35,04 | ||||
| 2025-07-15 | 13F | EWG Elevate Inc. | 49.338 | 4.399 | ||||||
| 2025-07-30 | 13F | Strategic Blueprint, LLC | 5.051 | 0,26 | 450 | 35,14 | ||||
| 2025-07-30 | 13F | Princeton Global Asset Management LLC | 40 | 0,00 | 4 | 50,00 | ||||
| 2025-08-12 | 13F | MAI Capital Management | 1.592 | 0,51 | 142 | 35,58 | ||||
| 2025-05-08 | 13F | Harvest Fund Management Co., Ltd | 0 | -100,00 | 0 | |||||
| 2025-08-06 | 13F | AE Wealth Management LLC | 1.193 | -28,00 | 106 | -2,75 | ||||
| 2025-08-12 | 13F | Proequities, Inc. | 0 | 0 | ||||||
| 2025-07-14 | 13F | AdvisorNet Financial, Inc | 280 | 0,00 | 25 | 33,33 | ||||
| 2025-08-06 | 13F | Golden State Wealth Management, LLC | 229 | 172,62 | 20 | 300,00 | ||||
| 2025-08-14 | 13F | Royal Bank Of Canada | 14.478 | -55,48 | 1.291 | -40,09 | ||||
| 2025-08-08 | 13F | Pnc Financial Services Group, Inc. | 1.219 | 0,00 | 109 | 35,00 | ||||
| 2025-07-10 | 13F | Peoples Bank/KS | 0 | -100,00 | 0 | |||||
| 2025-07-21 | 13F | Ameritas Advisory Services, LLC | 304 | 27 | ||||||
| 2025-04-23 | 13F | Financial Life Planners | 0 | -100,00 | 0 | |||||
| 2025-08-12 | 13F | Jpmorgan Chase & Co | 33.217 | 0,06 | 2.962 | 34,65 |